

Summary
Previous research has offered widely varying prevalence estimates for sleep apnea in the population, leaving uncertain which breathing patterns are abnormal. To explore the distribution of sleep apnea in the population and its co-morbidities, random telephone dialing was used between 1990 and 1994 to recruit subjects for a prevalence survey of sleep-disordered breathing in San Diego adults. Events from which blood oxygen desaturations ≥4% resulted were monitored with home recording instruments, usually for three consecutive nights. Among 190 women ages 40–64 years, a median of 4.3 desaturation events per hour of sleep were observed. A higher median of 6.7 events per hour was observed among 165 men. Frequencies were much higher among members of minority groups, leading to a standard estimate that 16.3% of U.S. Hispanics and racial minorities have ≥20 events/hour as compared to 4.9% of non-Hispanic Whites ages 40–64. Obesity indicated by body-mass index was the most important demographic predictor of sleep-disordered breathing, followed by age, male gender, and ethnicity. Quality of well-being was not significantly impaired in subjects with more respiratory events; however, there was some increase in blood pressure and wake-within-sleep associated with sleep-disordered breathing. This survey indicates that sleep-disordered breathing is more common, especially among minorities, than had been previously believed, but less co-morbidity may be associated.
Keywords: Prevalence, Apnea, Sleep, Epidemiology, Oximetry
In 1974, Webb reported that a majority of middle-aged adults experienced substantial numbers of apneas on an average night (1). Webb cited Bülow, whose landmark work had also noted a high frequency of periodic breathing in sleep (2). Nevertheless, recent generations of sleep physiologists have often ignored Webb’s data and have assumed that sleep apnea is a relatively uncommon process among healthy adults (3).
Many authorities have considered as few as five apneas per hour of sleep as abnormal. In some clinical studies, the criterion for pathologic sleep apnea utilized has been set as low as a respiratory-disturbance index (RDI) of five or more. The RDI is the number of apneas plus hypopneas per hour of sleep, e.g. where hypopneas are defined as reductions of tidal volume of 50–90% for 10 seconds or more (4,5). Commonly, subjects may display as many hypopneas as apneas. Additional criteria for hypopneas sometimes include a drop in blood oxygen saturation ≥4% (6). Such criteria have become important in guiding when sleep-disordered breathing should be treated and when treatment should be reimbursed. Some authorities have attempted to define a sleep-apnea syndrome by combining sleep-respiratory event frequency with snoring, daytime sleepiness, and other symptoms. For example, the International classification of sleep disorders required “More than five obstructive apneas …” per hour of sleep and either excessive sleepiness or insomnia for a diagnosis of obstructive sleep-apnea syndrome (OSAS) (7). In one paragraph of that nosology, snoring was discussed as an “essential” feature and in another paragraph as an “associated” feature. Alternative criteria of 10, 15, 20, 30, or 40 apnea or hypopnea events per hour of sleep have been discussed as pathologic thresholds; however, no boundary criteria dividing normality from the pathologic range have been more widely accepted than the criterion of five events per hour of sleep.
Bixler et al. recruited 100 subjects, ages 18–74, from medical center staff and acquaintances, carefully screened them to exclude any lacking “normalcy”, and found none with more than 30 apneas per night (8). In contrast, screening first by questionnaire and then recording groups with sleepiness, insomnia or not in the laboratory, Lavie found that 21% of industrial workers had five or more apneas per hour, from which a minimum working-population prevalence of 1% for sleep-apnea syndrome was inferred (9). At first, Lavie’s disturbing estimate was considered large and possibly excessive, but similar estimates were reported by others. With a similar two-step procedure, Gislason et al. found that 16 of 61 men (ages 30–69 years) had an RDI ≥ 5 plus symptoms, but inferred an Uppsala population prevalence for the sleep-apnea syndrome of only 1.3% (10). Further, 14 of 22 Icelandic women, screened and recorded polysomnographically, had at least 30 events per night, but the sleep-apnea-syndrome prevalence estimated for Icelandic women (aged 40–59 years) was only 2.5% (11). Cirignotta and colleagues found that 21 of 40 male snorers had an RDI ≥ 5, from which it was estimated that 3.4–5% of men (ages 40–59) in Bologna have stage ≥1 “heavy snorers disease” (12). When it was learned that roughly a quarter or more of elderly individuals had at least five apneas per hour of sleep, it was thought that sleep-apnea syndrome might differ during retirement ages from the syndrome among middle-aged adults (13,14). Indeed, when Schmidt-Nowara and colleagues noted that of Hispanics living in a small town at high altitude in New Mexico, as many as 62% of men ages 40–64 years and 48% of women had at least five 10-second events per hour of sleep, the result was suspected (even by the authors) to be possibly technically flawed or aberrant (15).
Considerable surprise greeted the finding by Young et al. that 9% of women and 24% of men from a survey of Wisconsin governmental employees ages 30–60 years had at least five apneas or hypopneas per hour of sleep and that 2% of women and 4% of men in this middle-aged work force had an apnea syndrome characterized by an RDI ≥ 5 plus hypersomnia (6). Initially, these epidemiologically elegant results were interpreted to mean that the sleep-apnea syndrome was far more common than had been recognized, despite limitation of the sample to state employees.
Our group has sought to more accurately define the prevalence of sleep-disordered breathing and its medical significance using a special home-recording technology that permitted structured random sampling of the general population with recording for 3 nights.
METHODS
Subject recruitment
From July 1990 through June 1994, telephone calls were made to homes in four selected areas of the City of San Diego, surveyed for 1 year each. These areas were selected to span the range from high to low income and social class and to provide an adequate sample of ethnic minorities, the largest minority group in San Diego being Hispanic. Haynes reverse telephone directories were used to identify a pseudo-random set of operating telephone numbers, to which a “1” was added to assure access to both unlisted and listed numbers. Staff called the computed numbers, inquired if there was any resident from 40 to 64 years of age and, if so, asked to conduct brief telephone interviews with any such persons. Once a particular number was selected, calls were made at least three times, if necessary, during weekdays, weekday evenings, and weekends, so as not to exclude working persons. Records of these telephone calls were not complete, but approximately 12,495 telephone numbers were called, of which 11,028 were discarded because the telephone was disconnected or non-residential, the occupants were unreachable after three tries, or the residents were below age 40 years or above age 65. Of 1,467 persons ages 40–64 years identified by the telephoning, 1,085 or 74% complied with telephone interviews. The purpose of the telephone interviews was to establish rapport and to determine demographic characteristics of persons contacted.
After the telephone interview was completed, staff asked permission for an interviewer to visit the subject’s home to conduct a home interview and sleep recording. Because we sought to equalize the numbers of subjects in 5-year age groups from 40 to 64 years (Table 1) and because fewer men were available for telephone interviews and fewer minority persons agreed to home interviews, some subjects who completed telephone interviews were not invited to participate in home interviews in order to improve the gender and age balance of the home sample and to make its minority percentage more representative of the City of San Diego. Thirty-four percent of those requested to schedule a home interview complied, representing roughly 25% of suitable persons identified by random telephone dialing. Although limited compliance, stratification requirements, and other obstacles prevented us from collecting a precise random sample of adults in the City of San Diego, the recruitment techniques were designed to produce a sample as free as possible from recruitment biases and loosely representative of the city.
TABLE 1.
Distribution of sample by age and gender, San Diego, California 1990–1994
| Age (years) | Women Number (%) | Men Number (%) |
|---|---|---|
| 40–44 | 43 (23) | 34 (21) |
| 45–49 | 45 (24) | 35 (21) |
| 50–54 | 41 (22) | 42 (25) |
| 55–59 | 31 (16) | 29 (18) |
| 60–64 | 30 (16) | 25 (15) |
| Total | 190 (100) | 165 (100) |
| Mean | 50.8 years | 51.4 years |
Home interviews
At a scheduled appointment, a staff member visited the subject’s home, obtained written informed consent under supervision of UCSD’s Institutional Review Board and then completed a structured interview. The interview included a questionnaire for reported sleep patterns and sleep-related symptoms (such as snoring or falling asleep in various situations), a selection of items from the National Health Interview survey, a medication recall list, and the quality of well-being questionnaire, which is an extensively tested and validated instrument designed to assess overall health, function, and quality of life (16). The interviewer measured blood pressures three times while subjects were sitting quietly and then measured height, weight, neck circumference, waist circumference, hip circumference, and neck skinfold. The interviewer also left with subjects for later completion the CES-D depression survey instrument (17), supplemented by eight items measuring atypical depression from the SIGHSAD-SR (18) and two items for men regarding sexual and erectile function. Either at the completion of the interview or soon after, the interviewer set up the home-recording instruments and left a log for completion during the home recordings. The log was used to chart times at work, outdoors, asleep, and when the wrist-activity monitor was removed. Most of the interviews were obtained by a single staff member (M.A.M.). When appropriate, a native Spanish-speaking staff member (R.S.S.) assisted the interviews using Spanish translations of the survey instruments. Interview data were entered into databases, using double-entry and error-screening routines to minimize errors.
Home oximetry
Five special home-recording systems were built for this study, The main components were CSI503 pulse oximeters, modified by the manufacturer (Criticare Systems, Inc., Waukesha, WI) to produce computer-code estimates of blood oxygen saturation, pulse rate, and probe status each second. Pulse oximetry was recorded with photoelectric probes worn on the fingers. The pulse oximeters were mounted on portable lunch-box-shaped computer systems programmed to store oxygen saturation, pulse rate, and probe status each second for up to 4 nights. In addition, electronic components were mounted on the computers to measure illumination at the bedside computer and to record sound-pressure levels at the throat. Computer-mounted microphones monitored snoring. These measurements were also stored by the computers second by second. Recordings were conducted at home both to obtain representative conditions for each subject and to promote compliance because we expected unsatisfactory compliance with laboratory polysomnography from randomly selected persons. For each subject, staff attempted to obtain home recordings for 3 consecutive nights to improve the reliability of measurement of that subject. Subjects were paid $50 for completion of the home recordings and interviews.
Pulse-oximetry data were plotted second by second for editing of recording artifacts, and each night’s valid data were exported to a computer file. The oxygen-saturation time series was then processed by a version of the SATSCORE algorithm (19), an extension of the PROFOX program (20), in order to enumerate those respiratory events that produced ≥4% desaturations. The program contained various logical criteria to exclude recording artifacts and was adjusted to be relatively conservative in its identification of respiratory events.
Actillume
The Actillume (Ambulatory Monitoring, Inc., Ardsley, NY) is a wrist-mounted monitor of wrist motion (using a linear accelerometer) and illumination. For this study, both mean wrist motion each minute and the maximum 10 seconds of each minute was stored. A computer algorithm similar to that described by Cole et al. (21) was used to automatically score sleep vs. wake from the measurements of maximal activity, using 1 minute epochs. Using data from the nightly sleep logs, supplemented with illumination data and expert judgement, the sleep periods were defined and sleep vs. wake scores were edited. The illumination data usually provided precise indications of when the lights were turned off at night and, thus, allowed the timing synchronization of the Actillumes and bedside computers to be verified.
Desaturation index: the ODI4
The ODI4 is the ≥4% oxygen-desaturation index indicating the number of events per hour of sleep in which blood oxygen desaturated 4% or more. From the Actillume-scored estimates of sleep time and the oximetry-derived estimates of ≥4% oxygen-desaturation events during that sleep, the ODI4 was computed for each night and then averaged across all nights for each subject. Due to various instrument failures, human errors, and limited compliance, successful oximetry and Actillume recordings were not always obtained for 3 nights. There were five subjects with 4 nights of initial recording (1.4%), 318 subjects with 3 nights (89.6%), 26 subjects with 2 nights (7.3%), and six subjects with 1 night (1.7%). When 1 or 2 nights were considered technically adequate, only those nights were used to obtain the average ODI4 for that subject. Preliminary results from the first portion of this study, including a scatterplot illustrating night-to-night recording variability, were published previously (22).
To validate the oximetry methodology, 18 of the same subjects agreed to be recorded for 1 night in our laboratory. Full polysomnograms were recorded including: electroencephalogram (EEG), electroculogram (EOG), chin and tibialis electromyogram (EMG), nostril thermocouples, chest and abdominal motion transducers, and finger-pulse oximetry, simultaneous with independent recordings using the home-recording oximetry technology and Actillume system. The polysomnograms were scored by hand by standard methods (23), 30 seconds at a time, for the occurrence of apneas (defined as reductions of estimated tidal volume of 90% or more for 10 seconds or more) and hypopneas (defined as reductions of estimated tidal volume of 50% or more for 10 seconds or more). Oximetric criteria were not used in scoring apneas and hypopneas. The polysomnographically derived RDIs, representing the apneas plus hypopneas per hour of sleep, were then compared with the independently estimated ODI4.
Followups
After successfully completing an initial interview and home-recording sequence, subjects (usually selected for high ODI4) were asked to complete up to three additional sequences of interviews and home recordings at approximately 1 year intervals.
Statistical analyses
Since the distribution of ODI4 was highly skewed, log10[ODI4] (the logarithmic transform) was used to normalize the distribution. To define a level of ODI4 that might conservatively select those subjects with disordered respiration in sleep of pathologic degree, a criterion of ODI4 ≥20 was selected. The direct method of standardization was used to estimate the prevalence of ODI4 ≥20 in the U.S. population, adjusting for age, gender, and ethnic group using the 1990 census as the standard. Because the number of Hispanics exceeded all other minority groups combined in this sample and results for the Hispanics proved reasonably comparable to those for other minorities, it seemed most reasonable to contrast non-Hispanic Whites dichotomously against all other ethnic groups combined (i.e. Hispanics whether or not White, Blacks, Asians, Native Americans, and Others, using the census categories). In San Diego, almost all persons classified by the census in the “Other” racial category were Hispanic as well as an almost equal number of Whites.
To examine the relationships of log10[ODI4] to the very large number of questionnaire items, items were prospectively separated into three categories of predicted association: positively anticipated, considered uncertain, or considered quite unlikely. Age, gender, ethnicity, and BMI (body mass index, kg/m2) were subject characteristics that might influence both sleep-disordered breathing and symptoms but, with the possible exception of BMI, could not be caused by sleep-disordered breathing. Partial correlation coefficients were computed, controlling for age, gender, ethnicity, and BMI, using SPSS for Windows, Version 6.1. When so many significance tests are computed, the overall chance of Type I errors (false-positive correlations) exceeds the Type I error frequency for single tests, so the p-plot method (24) was used to estimate which partial correlations were truly statistically reliable. In addition, the somewhat more conservative Holm method (25) was used to supplement the p-plot method.
To examine what symptoms might be caused by pathologic sleep-disordered respiration, the significance of ODI4 ≥20 as a predictor of symptoms was examined with control for age, gender, ethnicity, and BMI. For symptoms that could be transformed to Gaussian distributions, analyses of co-variance (ANCOVAs) were computed by SPSS, using ODI4 ≥20, gender, and ethnicity as dichotomous factors with age and BMI as covariates. For symptoms that were expressly dichotomous or classifiable in a few levels, logistic regressions or polychotomous logistic regressions were computed as appropriate, using ODI4 ≥20, gender, ethnicity, age, and BMI as independent predictors.
RESULTS
Sample
From 417 subjects completing home interviews, 355 subjects had interview and recording data that were judged sufficiently complete and technically satisfactory. The final sample consisted of 190 women and 165 men ages 40–64 years when initially recorded. Table 1 shows that men and women were well-matched in age. Although the telephone sample had a minority percentage representative of the city, due to reduced compliance among minorities, the home-interview sample had a significantly lower percentage of minorities than the telephone-interview sample (p < 0.001). The home-interview sample also had higher education (p < 0.02) but lower income (p < 0.01) than the telephone-interview sample. Home-recorded subjects were 285 non-Hispanic Whites (80%), 44 Hispanics (13%), 12 Blacks (3%), and 14 other subjects (4%, mainly Asian, thus, not the same as the census Other category). Within the same age group, the 1990 Census recorded the City of San Diego to be 66% non-Hispanic White, 14% Hispanic, 7% Black, and 13% all others. Of the home-interview sample, 63% reported snoring as compared to 56% of all completing telephone interviews (p < 0.001). The home sample was not significantly different from the telephone sample by age, gender, reported doctor visits in the previous year, or reported hypertension, heart trouble, nightly awakenings, sleep trouble, or sleep duration.
Reliability and validation of methods
The night-to-night reliability of log10[ODI4] as indicated by pair wise correlations among nights 1–3 ranged from r = 0.72 to r = 0.79. For the 18 subjects recorded simultaneously by polysomnogram, Actillume, and the oximetry computer system, the polysomnographic RDI averaged 25 ± 26, and ODI4 from oximetry-Actillume technology averaged 23 ± 27 (p = 0.37, ns). Mean log10 values were 1.23 and 1.18 respectively, also not significantly different. The Pearson correlation of RDI with lab ODI4 was 0.93 (p < 0.001, one-tailed), and for log10 indices, the correlation was r = 0.91 (p < 0.001, one-tailed). Comparing the lab polysomnographic log10[RDI] values with the home log10[ODI4] means for the same subjects, the correlation was r = 0.67, and there was no significant difference between the means. In other words, home ODI4 was an unbiased indicator of laboratory polysomnographic RDI, and variability due to measurement method was small compared to measurement variability due to night-to-night fluctuations.
ODI4
The typical brief blood-oxygen-desaturation events caused by sleep-respiratory disturbances were observed repeatedly in almost all subjects. As shown in Fig. 1, the median ODI4 for women was 4.3, whereas the median for men was higher at 6.7. Since the distributions were strongly positively skewed, the mean ODI4s for women and men were 7.3 ± 11.4 standard deviation (SD) and 10.5 ± 13.7 SD, respectively. A total of 28 subjects (7.9%) had an ODI4 ≥20, 5.3% of the women and 10.9% of the men.
FIG. 1.
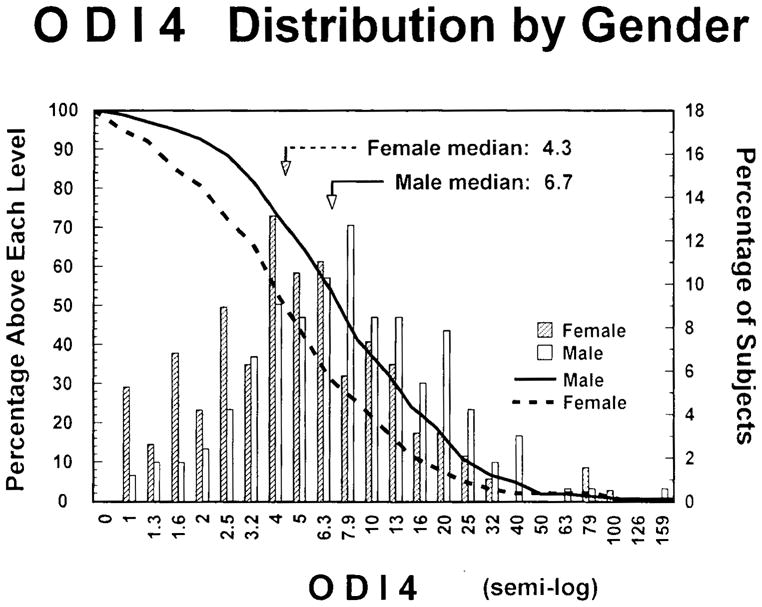
The solid and dotted lines show the percentages (left axis) of men and women with ODI4 greater or equal to each level on the abscissa. The histogram bars show the percentages (right axis) of males and females in each ODI4 range. The abscissa ranges are spaced logarithmically. ODI4 is ≥4% oxygen-desaturation events per hour of sleep.
As shown in Fig. 2, ODI4 ≥20 was found twice as often among men as women. ODI4 ≥20 was more common among older subjects, with an unexpected peak in the group from 50 to 54. The peak in ODI4 ≥20 in this age group was apparently a statistical aberration, since the mean log10[ODI4] was almost identical for ages 50–54, 55–59, and 60–64. Figure 2 shows that ODI4 ≥20 was observed about three times as frequently among Hispanics and non-Whites as among the White subjects. Subjects with BMI ≥30 had an ODI4 ≥20 at many times the prevalence of non-obese subjects. The mean and median BMI for women were 26.0 and 24.0 respectively, and for men, 27.0 and 26.0. A BMI ≥30 was found in 21% of subjects.
FIG. 2.
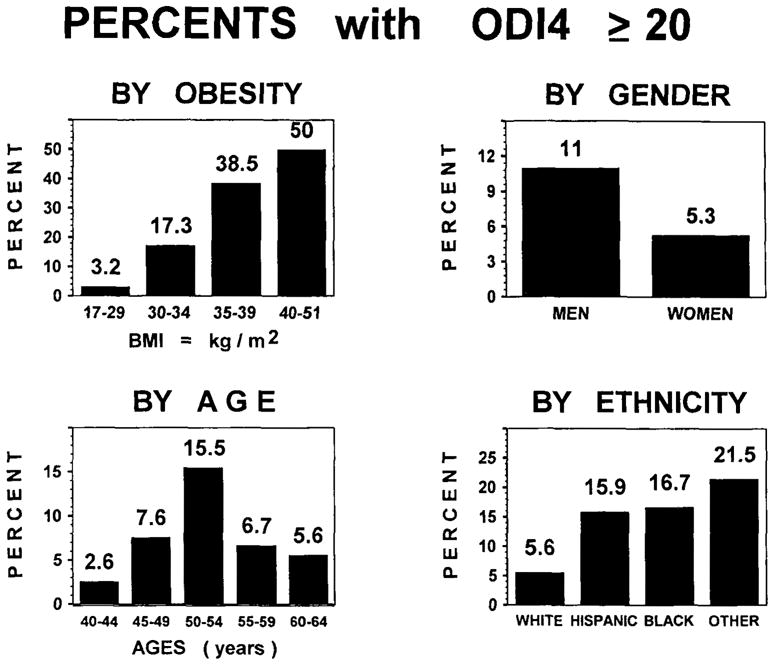
Percentages of subjects with ODI4 < 20 or ≥20 are shown by obesity, gender, age, and ethnicity, grouping non-Hispanic Whites, Hispanics, Blacks, and all other minorities (mostly Asians).
Using the direct method of standardization, adjusting for age and ethnicity, the estimated prevalence of ODI4 ≥20 for the United States population aged 40–64 years was 7.2% [95% confidence interval (C.I.) = 4.7–9.7] for both genders combined. The adjusted prevalences were 9.3% (C.I. = 5.4–13.2) for men and 5.2% (95% C.I. = 2.1–8.3) for women. Adjusting for age and gender, the White prevalence was 4.9% (95% C.I. = 2.5–7.2), whereas the similar estimate for Hispanics and non-Whites combined was 16.3% (95% C.I. = 8.1–24.5).
Correlates of log10[ODI4]
The important demographic correlates of log10[ODI4] were BMI, gender, age, and ethnicity (dichotomized), all of which were significant predictors in a combined multiple-regression model, together accounting for R2 = 0.25 (multiple r = 0.50). Attempting to isolate effects of Hispanic ethnicity, the log10[ODI4] partial correlation was not quite significant (p = 0.08) when contrasting Hispanics alone versus non-Hispanic Whites, controlling for gender, age, and BMI. Removing each term from the model one by one reduced R2 by 0.102 for BMI, 0.043 for age, 0.043 for gender, and 0.013 for ethnicity, indicating that BMI was the most important predictor. Waist circumference, waist-to-height ratio, and neck circumference were similar to BMI as predictors and highly intercorrelated. Adding reported loudness of snoring to the model improved R2 to 0.287. In this expanded model, snoring became a stronger correlate than age or gender, but this should not imply that snoring was considered as a causal predictor.
Partial correlations of particular interest (controlled for BMI, age, gender, and ethnicity) are shown in Table 2. The plot of observed probabilities (p plot) indicated that partial correlation coefficients with p < 0.01 (rp ≥ 0.14 for n = 355) could be considered significant despite the large number of statistical tests. Snoring, sleep minutes and percentage, diastolic and systolic blood pressures, reported heart trouble other than myocardial infarction (negative correlation), sleep satisfaction, and neck circumference were considered significant correlates by the p-plot method. Using the stricter Holm correction, sleep satisfaction and neck circumference were equivocal (Holm-adjusted p = 0.09) and reported heart trouble would not be significant (prospective prediction of this relationship as uncertain resulted in a non-significant Holm criterion). Considering the multiple-comparison criteria, the three correlates listed at the bottom of Table 2 should not be regarded as significant. The partial correlations of reported snoring with systolic and diastolic blood pressures were significant after control for BMI, age, gender, and ethnicity, but snoring did not remain an independent correlate once log10[ODI4] was introduced as a predictor of blood pressure.
TABLE 2.
Partial correlations with ODI4
| Variable | Partial r | Pa |
|---|---|---|
| Total sleep time (by Actillume) | −0.23 | <0.001 |
| Snoring loudness (e.g. none = 0, soft = 1, … heard throughout house = 4) | 0.23 | <0.001 |
| Sleep percent of recording time (by Actillume) | −0.19 | 0.001 |
| Diastolic blood pressure | 0.16 | 0.003 |
| Systolic blood pressure | 0.16 | 0.004 |
| Reported having heart trouble other than myocardial infarction | −0.15 | 0.004 |
| Sleep satisfaction (1 = very satisfied … 4 = very troubled) | 0.14 | 0.008 |
| Neck circumference | 0.14 | 0.009 |
| Having had an ulcer | 0.13 | 0.012 |
| Falling asleep in conversation with friends (days/week) | 0.13 | 0.013 |
| Having erectile problems (for men) | 0.21 | 0.017 |
Probabilities of partial correlations were not corrected for multiple testing, but p plots suggested that p < 0.01 indicated multiple correlations not due to chance. The other independent variables in the models were BMI, age, gender, and ethnicity.
Since sleep minutes was the divisor in computation of ODI4, the negative correlations of sleep minutes and percentage with log10[ODI4] were computational artifacts—neither had a significant partial correlation with the nightly number of desaturations. On the other hand, the nightly number of desaturations had significant partial correlations with both total oximetry-recording time (rp = 0.20, p < 0.001) and wake time within the sleep period (rp = 0.23, p < 0.001), indicating that subjects with more desaturations spent more time in bed and more time awake in bed at night to attain an average amount of sleep. There was no U-shaped relationship between sleep duration and ODI4 in these data, unlike data from an elderly San Diego sample (26).
The remaining 140 variables considered all had very small partial correlations that were not statistically significant. Of those 140 variables, Table 3 lists a selection that were suspected to be correlates of log10[ODI4], but that did not have significant partial correlations. Of particular note, the quality of well-being scale was not significantly correlated with log10[ODI4] (p = 0.09) after control for BMI, age, gender, and ethnicity (Fig. 3). Also, after controlling for age and BMI (ethnicity was not significant in this subanalysis), menopausal status did not significantly predict log10[ODI4] among women whose status was unclouded by reproductive hormone replacement or surgery (in this analysis, log10[ODI4] was the dependent variable).
TABLE 3.
Variables without significant partial correlationa to ODI4 (p > 0.05)
|
Controlled for BMI, age, gender, and ethnicity.
FIG. 3.
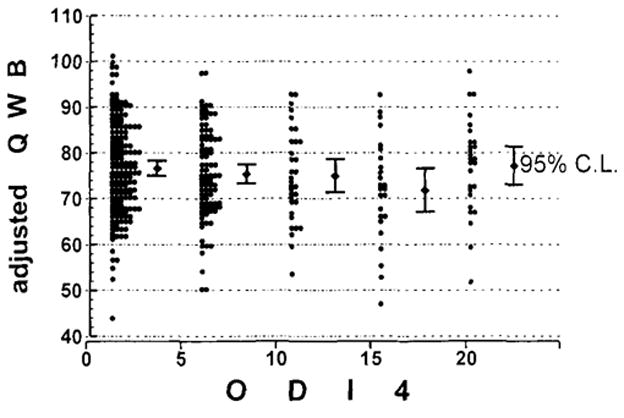
Adjusted quality of well-being scale (QWB) scores are plotted for subjects with five levels of ODI4. The group with ODI4 ≥20 includes subjects with ODI4 from 20 to 128. Although the theoretical range of QWB-scale scores is 0–100, adjustment for age, gender, BMI, and ethnicity produced one slightly higher adjusted score
The criterion of ODI4 ≥20 corresponded, on a logarithmic scale, to the mean log10[ODI4] + ≥1.38 SD(log10[ODI4]), that is, 1.38 SDs above the mean. When ODI4 was examined as a dichotomous predictor using the criterion of ODI4 ≥20, only increased snoring (p < 0.001) and decreased Actillume minutes of sleep (p = 0.007) were significantly predicted after adjustment for gender, ethnicity, age, and BMI. Notably, systolic and diastolic blood pressures, sleep satisfaction, neck circumference, and quality of well being were not significantly associated with ODI4 ≥20 after adjustment. Figure 4 illustrates the relationship of systolic blood pressure to adjusted ODI4, showing why the somewhat non-linear relationship produced a significant partial correlation with ODI4 but no significant association when dichotomization with criterion ODI4 ≥20 was employed. There were weak trends that ODI4 ≥20 was related to gasping in sleep (p = 0.016), falling asleep when reading (p = 0.017), use of ant-acids (p = 0.040), subjective sleep sufficiency (p = 0.046), and Actillume sleep percentage (p = 0.048), but none of these relationships could be considered statistically “significant” using the criteria established by the p-plot and Holm methods. For erectile problems in men, the dichotomous relationship was equivocal (p = 0.097), like the partial correlation. Note that none of 141 remaining variables, including those listed in Table 3, were significantly associated with ODI4 ≥20 in the dichotomizing models.
FIG. 4.
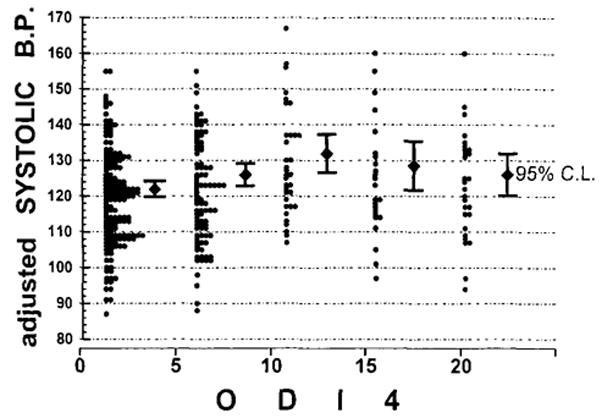
Adjusted systolic blood pressures are plotted for five levels of ODI4. The group with ODI4 ≥20 includes subjects with ODI4 from 20 to 128. Blood pressures were adjusted for age, gender, BMI, and ethnicity.
Followups
There were 22 cases where an initial ODI4 could be compared with a similar ODI4 at the last followup, giving a range of followups of 2–42 months with a mean of 20 months after the initial study. In these cases, initial mean ODI4 and mean log10[ODI4] were 19.0 and 0.99, respectively. At followup, these had risen to 20.1 and 1.05 (changes not significant). The correlations of ODI4 and log10[ODI4] from initial to followup recordings were r = 0.84 and r = 0.72, respectively. Considering changes over time as the absolute-value differences between successive log10[ODI4] measurements, the correlation was r = 0.07 (ns) with months of followup, demonstrating no greater variability in ODI4 as the interval of followup increased.
DISCUSSION
Our data confirm the reports of Webb (1) and Schmidt-Nowara and Jennum (15) showing that sleep-disordered breathing is pervasive among middle-aged U.S. adults. In the Schmidt-Nowara and Jennum Hispanic population sample (15) and our mixed-ethnicity sample, prevalences of ≥5 events per hour were almost identical for similar ages. Indeed, the sometimes recommended criterion for abnormality of RDI ≥5 would select more than half of all men ages 40–64 and almost half of the women 40–64 in the U.S. population.
Though the RDI prevalences reported by Young and colleagues were considered remarkably high, our estimated prevalences for the general U.S. population were almost exactly twice the comparable estimates obtained from Wisconsin state employees (6). Whereas our colleagues estimated roughly 10.0% of men and 3.8% of women in the general U.S. population ages 40–60 years would have an apnea-hypopnea index ≥ 15 (6), we would estimate that ODI4 ≥ 15 is found among 20.3% of men and 7.6% of women of comparable ages. Our estimates exceeded the 95% confidence intervals of Young et al. for the entire U.S. population (for males, conversely, their prevalence estimate was below our confidence interval), but our estimates for Whites were virtually identical to their overall estimates. Note that the somewhat more lenient criterion of ODI4 ≥15 yields higher estimated population prevalences than we described for ODI4 ≥20 in the results above. We doubt that disparities between the San Diego and Wisconsin results lie in recording methodologies, since our validation data demonstrated that the polysomnographic RDI and the oximetric ODI4 (with our methodology) are virtually equivalent. Others have previously reported similar validations (27,28). We doubt that our colleagues’ focus on governmental employees could account for the disparity, since our data showed that employment status, income, and education were not significant correlates of ODI4, and we identified no recruitment biases in our sample that could account for such disparity. Rather, it seems likely that our sleep-disordered breathing prevalences were higher because our U.S. estimates were adjusted for ethnic status. Perhaps the Wisconsin sample included too few minority subjects for adjustment.
Our data may be contrasted with a report that only 5% of men ages 35–65 years had ODI5 ≥ 5 in an English general practice (29). Part of this disparity results from use of different desaturation criterion (ODI5 vs. ODI4), less obesity in Britain (30), and the some-what younger English age group, but ethnic or racial factors may also have been operative. The BMIs of our subjects were comparable to U.S. national prevalences—slightly below national norms for women and slightly above national norms for men (31). Our prevalences for ODI4 ≥ 5 are at least twice those of Bear-park et al. for ODI3 ≥ 5 among Busselton, Australia men (here the difference in criteria should have produced higher Australian prevalences) (32). Although our mean BMI for males, 27.0, was almost identical to that of Bearpark et al. (26.9) (32), the Australian sample may have been almost entirely of British extraction. On the other hand, in another Australian sample ages 35–69 years, the prevalence of ODI4 ≥20 among men (16.6%) was actually higher than in our sample and among women (4.6%) about the same (33). Subjects ages 65–69 years tended to raise the averages in this sample by their particularly high prevalence. In a northern Italian population sample of men ages 40–65, ODI5 >20 was found in 4.8% (34). This lower prevalence, compared with San Diego, might be partly explained by the desaturation criterion of >4% (essentially, ODI5) and the slightly lower mean BMI in the Italian study; however, correlations between ODI5 and snoring or BMI were similar to those in San Diego. In summary, it appears that factors of ethnicity, age, and obesity contribute to differing prevalence estimates in diverse contemporary surveys, but a relatively high prevalence of sleep-disordered breathing is consistently found.
The very high prevalence of ODI4 ≥20 among our minority subjects is a source of concern. It has been suggested that sleep apnea might be a factor causing more frequent hypertension among African-Americans (35–37). Our sample was not large enough to reliably contrast prevalence of ODI4 ≥20 between distinct minority groups, but the prevalence for Hispanics, Blacks, and our other minorities (largely Asian) seemed quite similar. Such findings might actually reflect social, ethnic, or developmental influences on sleep-disordered breathing rather than genetic racial factors, especially since about half of San Diego Hispanics are classified by the census as White. We might expect minority ethnic groups to have ODI4 ≥20 prevalence distinctly different from each other, as well as from Whites, if the differences were predominantly of genetic etiology.
Like the Wisconsin sample (6), our results indicated considerable sleep-disordered breathing among women and demonstrated substantial ODI4 rates for women at all ages. Both surveys suggested that there may have been a bias toward men in referrals to sleep clinics, where very high male: female apnea ratios are reported. We could not confirm any significant age-BMI-independent increase in sleep-disordered breathing after menopause as reported in the Wisconsin sample and previous studies (38); however, menopause effects were not significant in Wisconsin for the higher criterion levels.
After carefully collecting quality of well-being (QWB) scale data to assess potential influences of sleep-disordered breathing on overall health status and morbidity, we could not demonstrate any significant associations of adjusted ODI4 or ODI4 ≥20 with QWB (Fig. 3). Lack of association of ODI4 with a question on general health status and numerous other items from the National Health Interview, mood inventories, sleep symptoms, and medication inventories documented surprisingly little association of sleep-disordered breathing with medical co-morbidities once factors of age, gender, obesity, and ethnicity were controlled. The sample size would have been sufficient to detect small effects. There is some question whether or not sleep-disordered breathing might be a cause of obesity (39); therefore, control for obesity might negatively bias the partial correlations of log10[ODI4] with symptoms. Indeed, controlling only for age, gender, and ethnicity, significant partial correlations were found between log10[ODI4] and QWB (rp = −0.17, p = 0.001), reported hypertension (rp = 0.15, p = 0.004), the CES-D depression scale (rp = 0.14, p = 0.011), and reported poor health (rp = 0.21, p < 0.001), but even without controlling for BMI, these correlations remained small.
Even specific sleep complaints such as poor sleep satisfaction and reported daytime sleepiness had only statistically equivocal (and clinically trivial) associations with ODI4, with the exception of an appreciable association with reported snoring. Only very weak associations were found between sleep-disordered breathing and questions regarding hypersomnolence. Similarly, the majority of Wisconsin subjects with complaints of hypersomnolence had apnea-hypopnea scores < 5 (6), so hypersomnolence was not a sensitive or specific indicator of sleep-disordered breathing in Wisconsin subjects. Reported snoring was significantly associated with ODI4 in San Diego subjects, but snoring was found to be only a modest predictor of ODI4 ≥20 and was not strongly associated with ODI4 at any level. Although we hope to present our objective sound-pressure recordings separately, we note here that these recordings supported the conclusion that snoring sounds and desaturation events are only weakly associated. Prediction of ODI4 could be done mainly by obesity, age, gender, and ethnicity, irrespective of symptoms. Subjects with high ODI4, e.g. ODI4 ≥20, were not a clinically and symptomatically distinctive group. Although these three-night recordings might be expected to be more reliable, as contrasted to similar one-night recordings from elderly San Diegans (14), the associations of questionnaire-reported symptoms with sleep-breathing disturbances were found to be minimal below age 65 years, as they were above age 65.
In these San Diego data, clustering of high ODI4 (at any level), reports of hypersomnolence, and reports of snoring were too weak to confirm that in this population there is a distinct sleep-apnea syndrome. Only modest co-variance of symptoms with sleep-disordered breathing was also found in studies in Australia (40) and England (29). The question arises whether sleep-disordered breathing, snoring, and hypersomnia might be relatively independent co-morbidities in the population. Because it is obese men with symptoms of snoring and daytime sleepiness whose referral to sleep clinics has become popularized, patients in whom such symptoms are associated (perhaps fortuitously) are often represented in clinic sleep-apnea case series. Patients without symptoms would rarely be referred to fee-for-service sleep clinics, since asymptomatic patients would be unmotivated to undergo a very expensive diagnostic and treatment regimen. Evidently, women have been rarely referred, especially premenopausal women, so the sleep-clinic literature has reported an extraordinary predominance of sleep-apnea syndromes among men, inconsistent with the population samples. Thus, preconceptions of sleep-disordered breathing may have pre-selected clinic patients with a clustering of symptoms that we have been unable to confirm as a clustering in the population.
The high population prevalence of sleep-disordered breathing that we have observed strengthens the argument that sleep apnea, determined by home oximetry, is a widespread population health problem but tends to minimize our impression of the associated morbidity. Whereas associations of the number of desaturations with increased time-in-bed and wake-after-sleep-onset suggest that sleep-disordered breathing interfered mildly with the efficiency of nocturnal sleep, the daytime sleepiness associated with sleep-disordered breathing often seemed trivial. Significant associations of ODI4 with modest increases in systolic and diastolic pressures [similar to those reported by Hla et al. (41)] do show that sleep apnea, as indicated by home oximetry, may cause mild blood-pressure elevations, but snoring independent of ODI4, age, gender, ethnicity, and obesity was not associated with hypertension. In summary, these analyses suggest that widespread sleep-disordered breathing may produce definite but rather limited morbidity in the population as a whole.
Randomizing treatment trials and mortality-risk studies could provide additional assessment of the consequences of sleep-disordered breathing. No convincing long-term, randomized-treatment trials have yet been published, but randomized trials that distinguish symptom reduction from spontaneous remission and placebo effects might help estimate the type and amount of morbidity caused by sleep-disordered breathing. Examining mortality, several studies have found that sleep-disordered breathing is associated with increased mortality, but sleep-disordered breathing may not be an independent mortality predictor. In a San Diego City sample with age >65 years, AI > 20 was associated with reduced survival but was not independent of age and histories of cardiovascular and pulmonary disease (42,43). Although multivariate analyses have not yet been fully summarized, results from a Veterans Affairs hospital male inpatient sample (44) also leave uncertain the extent to which sleep-disordered breathing is an independent risk factor. Bliwise et al., Mant et al., and Lavie et al. had similar findings (45–47).
We would caution that there are some patients with extreme sleep apnea who should indubitably be promptly treated. Our data do not argue against treatment of extreme cases but do suggest that the value of treating modest degrees of sleep apnea (e.g. with ODI4 of 5–20, as determined by home oximetry) should be examined critically when associated symptoms are not compelling.
Acknowledgments
This report is dedicated to the late O. J. Kaplan, who with R. Z. Kaplan, designed and supervised the sampling techniques for this study. M. A. Mowen, R. L. Fell, C. M. Senger, R. M. Kaplan, R. S. Sepulveda, and J. D. Assmus contributed to the scientific design and execution of this research. This research was supported by HL40930, MH00117, AG12364, AG02711, the Research Service of the Veterans Affairs Medical Center, San Diego, the Weingart Foundation, and the Sam and Rose Stein Institute for Research on Aging.
References
- 1.Webb P. Periodic breathing during sleep. J Appl Physiol. 1974;37:899–903. doi: 10.1152/jappl.1974.37.6.899. [DOI] [PubMed] [Google Scholar]
- 2.Bülow K. Respiration and wakefulness in man. Acta Physiol Scand. 1963;59:5–110. [PubMed] [Google Scholar]
- 3.Guilleminault C, van den Hoed J, Mitler MM. Clinical overview of sleep apnea syndromes. In: Guilleminault C, Dement WC, editors. Sleep apnea syndromes. New York: Alan R Liss; 1978. pp. 1–12. [Google Scholar]
- 4.Bornstein SK. Respiratory monitoring during sleep: polysomnography. In: Guilleminault C, editor. Sleeping and waking disorders: indications and techniques. Menlo Park, CA: Addison-Wesley; 1982. pp. 183–212. [Google Scholar]
- 5.Guilleminault C. Treatments in obstructive sleep apnea. In: Guilleminault C, Partinen M, editors. Obstructive sleep apnea syndrome: clinical research and treatment. New York: Raven Press; 1990. pp. 99–118. [Google Scholar]
- 6.Young T, Palta M, Dempsey J, Skatrud J, Weber S, Badr S. The occurrence of sleep disordered breathing among middle-aged adults. N Engl J Med. 1993;328:1230–5. doi: 10.1056/NEJM199304293281704. [DOI] [PubMed] [Google Scholar]
- 7.Thorpy MJ. Diagnostic Classification Steering Committee. International classification of sleep disorders: diagnostic and coding manual. Rochester, MN: American Sleep Disorders Association; 1990. [Google Scholar]
- 8.Bixler EO, Kales A, Soldatos CR, Vela-Bueno A, Jacoby JA, Scarone S. Sleep apneic activity in a normal population. Res Comm Chem Pathol Pharmacol. 1982;36:141–52. [PubMed] [Google Scholar]
- 9.Lavie P. Incidence of sleep apnea in a presumably healthy working population: a significant relationship with excessive daytime sleepiness. Sleep. 1983;6:312–8. [PubMed] [Google Scholar]
- 10.Gislason T, Almqvist M, Eriksson G, Taube A, Boman G. Prevalence of sleep apnea syndrome among Swedish men—an epidemiological study. J Clin Epidemiol. 1988;41(6):571–6. doi: 10.1016/0895-4356(88)90061-3. [DOI] [PubMed] [Google Scholar]
- 11.Gislason T, Benediktsdottir B, Bjornsson JK, Kjartanson G, Kjeld M, Kristbjarnarson H. Snoring, hypertension, and the sleep apnea syndrome. An epidemiologic survey of middle-aged women. Chest. 1993;103(4):1147–51. doi: 10.1378/chest.103.4.1147. [DOI] [PubMed] [Google Scholar]
- 12.Cirignotta F, D’Alessandro R, Partinen M, et al. Prevalence of every night snoring and obstructive sleep apnoeas among 30–69-year-old men in Bologna, Italy. Acta Neurol Scand. 1989;79:366–72. doi: 10.1111/j.1600-0404.1989.tb03802.x. [DOI] [PubMed] [Google Scholar]
- 13.Carskadon MA, Dement WC. Respiration during sleep in the aged human. J Gerontol. 1981;36:420–3. doi: 10.1093/geronj/36.4.420. [DOI] [PubMed] [Google Scholar]
- 14.Ancoli-Israel S, Kripke DF, Klauber MR, Mason WJ, Fell R, Kaplan O. Sleep disordered breathing in community-dwelling elderly. Sleep. 1991;14(6):486–95. doi: 10.1093/sleep/14.6.486. [DOI] [PMC free article] [PubMed] [Google Scholar]
- 15.Schmidt-Nowara WW, Jennum P. Epidemiology of sleep apnea. In: Guilleminault C, Partinen M, editors. Obstructive sleep apnea syndrome: clinical research and treatment. New York: Raven Press; 1990. pp. 1–8. [Google Scholar]
- 16.Kaplan RM. Using quality of life information to set priorities in health policy. Soc Indicators Res. 1994;33:121–63. [Google Scholar]
- 17.Radloff LS. The CES-D scale: a self-report depression scale for research in the general population. Appl Psychol Measure. 1977;1:385–401. [Google Scholar]
- 18.Williams JBW, Link MJ, Rosenthal NE, Terman M. Seasonal affective disorder assessment tools packet. In: Terman M, editor. SLBTR 1988–1990: the complete works. New York: SLBTR; 1990. pp. 207–42. [Google Scholar]
- 19.Kripke DF. Recognition of Cheyne-Stokes respiration with pulse oximetry. Sleep Res. 1994;23:277. (abstract) [Google Scholar]
- 20.Timms RM, Dawson A, Taft R, Erman MK, Mitler MM. Oxygen saturation by oximetry: analysis by microcomputer. J Polysomnogr Technol. 1988 Spring;:13–21. [Google Scholar]
- 21.Cole RJ, Kripke DF, Gruen W, Mullaney DJ, Gillin JC. Automatic sleep/wake identification from wrist activity. Sleep. 1992;15:461–9. doi: 10.1093/sleep/15.5.461. [DOI] [PubMed] [Google Scholar]
- 22.Kripke DF, Ancoli-Israel S, Mason WJ, et al. Desaturation in sleep of adults 40 to 64 years. In: Kuna ST, Suratt PM, Remmers JE, editors. Sleep and respiration in aging adults. New York: Elsevier; 1991. pp. 171–6. [Google Scholar]
- 23.Rechtschaffen A, Kales A, editors. A manual of standardized terminology, techniques and scoring system for sleep stages of human subjects. Los Angeles: Brain Information Service, Brain Research Institute, UCLA; 1968. [Google Scholar]
- 24.Schweder T, Spjotvoll E. Plots of P-values to evaluate many tests simultaneously. Biometrika. 1982;69:493–502. [Google Scholar]
- 25.Holm S. A simple sequentially rejective multiple testing procedure. Scand J Stat. 1979;6:65–70. [Google Scholar]
- 26.Kripke DF, Ancoli-Israel S, Mason WJ, Kaplan O. Sleep apnea: association with deviant sleep durations and increased mortality. In: Guilleminault C, Partinen M, editors. Obstructive sleep apnea syndrome: clinical research and treatment. New York: Raven Press; 1990. pp. 9–14. [Google Scholar]
- 27.Pepin JL, Levy P, Lepaulle B, Brambilla C, Guilleminault C. Does oximetry contribute to the detection of apneic events? Mathematical processing of the SaO2 signal. Chest. 1991;99(5):1151–7. doi: 10.1378/chest.99.5.1151. [DOI] [PubMed] [Google Scholar]
- 28.Stoohs R, Guilleminault C. MESAM 4: an ambulatory device for the detection of patients at risk for obstructive sleep apnea syndrome (OSAS) Chest. 1992;101(5):1221–7. doi: 10.1378/chest.101.5.1221. [DOI] [PubMed] [Google Scholar]
- 29.Stradling JR, Crosby JH. Predictors and prevalence of obstructive sleep apnoea and snoring in 1001 middle aged men. Thorax. 1991;46(2):85–90. doi: 10.1136/thx.46.2.85. [DOI] [PMC free article] [PubMed] [Google Scholar]
- 30.Millar WJ, Stephens T. The prevalence of overweight and obesity in Britain, Canada, and the United States. Am J Public Health. 1987;77:38–41. doi: 10.2105/ajph.77.1.38. [DOI] [PMC free article] [PubMed] [Google Scholar]
- 31.National Center for Health Statistics. DHHS (PHS) 87–1688 ed. Hyattsville, MD: U.S. Dept. HHS; 1987. Anthropometric reference data and prevalence of overweight: United States, 1976–80. [PubMed] [Google Scholar]
- 32.Bearpark H, Elliott L, Grunstein R, et al. Snoring and sleep apnea: a population study in Australian men. Am J Respir Crit Care Med. 1995;151:1459–65. doi: 10.1164/ajrccm.151.5.7735600. [DOI] [PubMed] [Google Scholar]
- 33.Olson LG, King MT, Hensley MJ, Saunders NA. A community study of snoring and sleep-disordered breathing. Am J Respir Crit Care Med. 1995;152:711–6. doi: 10.1164/ajrccm.152.2.7633731. [DOI] [PubMed] [Google Scholar]
- 34.Ferini-Strambi L, Zucconi M, Palazzi S, et al. Snoring and nocturnal oxygen desaturations in an Italian middle-aged male population: epidemiologic study with an ambulatory device. Chest. 1994;105:1759–64. doi: 10.1378/chest.105.6.1759. [DOI] [PubMed] [Google Scholar]
- 35.Redline S. Age-related differences in sleep apnea: generalizability of findings in older populations. In: Kuna ST, Suratt PM, Remmers JE, editors. Sleep and respiration in aging adults. New York: Elsevier; 1991. pp. 184–94. [Google Scholar]
- 36.Redline S, Tishler PV, Tosteson TD, et al. The familial aggregation of obstructive sleep apnea. Am J Respir Crit Care Med. 1995;151:682–7. doi: 10.1164/ajrccm/151.3_Pt_1.682. [DOI] [PubMed] [Google Scholar]
- 37.Ancoli-Israel S, Klauber MR, Stepnowsky C, Estline E, Chinn A, Fell R. Sleep disordered breathing in African-American elderly. Am J Respir Crit Care Med. 1995;152:1946–9. doi: 10.1164/ajrccm.152.6.8520760. [DOI] [PubMed] [Google Scholar]
- 38.Block AJ, Wynne JW, Boysen PG. Sleep-disordered breathing and nocturnal oxygen desaturation in postmenopausal women. Am J Med. 1980;69:75–9. doi: 10.1016/0002-9343(80)90502-1. [DOI] [PubMed] [Google Scholar]
- 39.Sforza E, Lugaresi E. Daytime sleepiness and nasal continuous positive airway pressure therapy in obstructive sleep apnea syndrome patients: effects of chronic treatment and 1-night therapy withdrawal. Sleep. 1995;18:195. [PubMed] [Google Scholar]
- 40.Bearpark H, Elliott L, Grunstein R, Cullen S, Sullivan C. Symptoms of sleep disordered breathing (sdb) in a community population of Australian men: subjective reports and relationship to objective measures. Sleep Res. 1995;24A:283. (abstract) [Google Scholar]
- 41.Hla KM, Young TB, Bidwell T, Palta M, Skatrud JB, Dempsey J. Sleep apnea and hypertension: a population-based study. Ann Intern Med. 1994;120:382–8. doi: 10.7326/0003-4819-120-5-199403010-00005. [DOI] [PubMed] [Google Scholar]
- 42.Ancoli-Israel S, Coy TV. Are breathing disturbances in elderly equivalent to sleep apnea syndrome? Sleep. 1994;17:77–83. doi: 10.1093/sleep/17.1.77. [DOI] [PubMed] [Google Scholar]
- 43.Ancoli-Israel S, Kripke DF, Klauber MR, et al. Morbidity, mortality and sleep disordered breathing in community dwelling elderly. Sleep. 1996;19(4):277–82. doi: 10.1093/sleep/19.4.277. [DOI] [PubMed] [Google Scholar]
- 44.Ancoli-Israel S, Klauber MR, Fell RL, Parker L, Kenney LA, Willens R. Sleep disordered breathing: preliminary natural history and mortality results. In: Seifert RA, Carlson J, editors. International perspective on applied psychophysiology. New York: Plenum; 1994. pp. 103–11. [Google Scholar]
- 45.Bliwise DL, Bliwise NG, Partinen M, Pursley AM, Dement WC. Sleep apnea and mortality in an aged cohort. Am J Public Health. 1988;78:544–7. doi: 10.2105/ajph.78.5.544. [DOI] [PMC free article] [PubMed] [Google Scholar]
- 46.Mant A, King M, Saunders NA, Pond CD, Goode E, Hewitt H. Four-year follow-up of mortality and sleep-related respiratory disturbance in non-demented seniors. Sleep. 1995;18:433–8. doi: 10.1093/sleep/18.6.433. [DOI] [PubMed] [Google Scholar]
- 47.Lavie P, Herer P, Peled R, et al. Mortality in sleep apnea patients: a multivariate analysis of risk factors. Sleep. 1995;18:149–57. doi: 10.1093/sleep/18.3.149. [DOI] [PubMed] [Google Scholar]