Abstract
Pairwise sequence comparison methods have been assessed using proteins whose relationships are known reliably from their structures and functions, as described in the scop database [Murzin, A. G., Brenner, S. E., Hubbard, T. & Chothia C. (1995) J. Mol. Biol. 247, 536–540]. The evaluation tested the programs blast [Altschul, S. F., Gish, W., Miller, W., Myers, E. W. & Lipman, D. J. (1990). J. Mol. Biol. 215, 403–410], wu-blast2 [Altschul, S. F. & Gish, W. (1996) Methods Enzymol. 266, 460–480], fasta [Pearson, W. R. & Lipman, D. J. (1988) Proc. Natl. Acad. Sci. USA 85, 2444–2448], and ssearch [Smith, T. F. & Waterman, M. S. (1981) J. Mol. Biol. 147, 195–197] and their scoring schemes. The error rate of all algorithms is greatly reduced by using statistical scores to evaluate matches rather than percentage identity or raw scores. The E-value statistical scores of ssearch and fasta are reliable: the number of false positives found in our tests agrees well with the scores reported. However, the P-values reported by blast and wu-blast2 exaggerate significance by orders of magnitude. ssearch, fasta ktup = 1, and wu-blast2 perform best, and they are capable of detecting almost all relationships between proteins whose sequence identities are >30%. For more distantly related proteins, they do much less well; only one-half of the relationships between proteins with 20–30% identity are found. Because many homologs have low sequence similarity, most distant relationships cannot be detected by any pairwise comparison method; however, those which are identified may be used with confidence.
Sequence database searching plays a role in virtually every branch of molecular biology and is crucial for interpreting the sequences issuing forth from genome projects. Given the method’s central role, it is surprising that overall and relative capabilities of different procedures are largely unknown. It is difficult to verify algorithms on sample data because this requires large data sets of proteins whose evolutionary relationships are known unambiguously and independently of the methods being evaluated. However, nearly all known homologs have been identified by sequence analysis (the method to be tested). Also, it is generally very difficult to know, in the absence of structural data, whether two proteins that lack clear sequence similarity are unrelated. This has meant that although previous evaluations have helped improve sequence comparison, they have suffered from insufficient, imperfectly characterized, or artificial test data. Assessment also has been problematic because high quality database sequence searching attempts to have both sensitivity (detection of homologs) and specificity (rejection of unrelated proteins); however, these complementary goals are linked such that increasing one causes the other to be reduced.
Sequence comparison methodologies have evolved rapidly, so no previously published tests has evaluated modern versions of programs commonly used. For example, parameters in blast (1) have changed, and wu-blast2 (2)—which produces gapped alignments—has become available. The latest version of fasta (3) previously tested was 1.6, but the current release (version 3.0) provides fundamentally different results in the form of statistical scoring.
The previous reports also have left gaps in our knowledge. For example, there has been no published assessment of thresholds for scoring schemes more sophisticated than percentage identity. Thus, the widely discussed statistical scoring measures have never actually been evaluated on large databases of real proteins. Moreover, the different scoring schemes commonly in use have not been compared.
Beyond these issues, there is a more fundamental question: in an absolute sense, how well does pairwise sequence comparison work? That is, what fraction of homologous proteins can be detected using modern database searching methods?
In this work, we attempt to answer these questions and to overcome both of the fundamental difficulties that have hindered assessment of sequence comparison methodologies. First, we use the set of distant evolutionary relationships in the scop: Structural Classification of Proteins database (4), which is derived from structural and functional characteristics (5). The scop database provides a uniquely reliable set of homologs, which are known independently of sequence comparison. Second, we use an assessment method that jointly measures both sensitivity and specificity. This method allows straightforward comparison of different sequence searching procedures. Further, it can be used to aid interpretation of real database searches and thus provide optimal and reliable results.
Previous Assessments of Sequence Comparison.
Several previous studies have examined the relative performance of different sequence comparison methods. The most encompassing analyses have been by Pearson (6, 7), who compared the three most commonly used programs. Of these, the Smith–Waterman algorithm (8) implemented in ssearch (3) is the oldest and slowest but the most rigorous. Modern heuristics have provided blast (1) the speed and convenience to make it the most popular program. Intermediate between these two is fasta (3), which may be run in two modes offering either greater speed (ktup = 2) or greater effectiveness (ktup = 1). Pearson also considered different parameters for each of these programs.
To test the methods, Pearson selected two representative proteins from each of 67 protein superfamilies defined by the pir database (9). Each was used as a query to search the database, and the matched proteins were marked as being homologous or unrelated according to their membership of pir superfamilies. Pearson found that modern matrices and “ln-scaling” of raw scores improve results considerably. He also reported that the rigorous Smith–Waterman algorithm worked slightly better than fasta, which was in turn more effective than blast.
Very large scale analyses of matrices have been performed (10), and Henikoff and Henikoff (11) also evaluated the effectiveness of blast and fasta. Their test with blast considered the ability to detect homologs above a predetermined score but had no penalty for methods which also reported large numbers of spurious matches. The Henikoffs searched the swiss-prot database (12) and used prosite (13) to define homologous families. Their results showed that the blosum62 matrix (14) performed markedly better than the extrapolated pam-series matrices (15), which previously had been popular.
A crucial aspect of any assessment is the data that are used to test the ability of the program to find homologs. But in Pearson’s and the Henikoffs’ evaluations of sequence comparison, the correct results were effectively unknown. This is because the superfamilies in pir and prosite are principally created by using the same sequence comparison methods which are being evaluated. Interdependency of data and methods creates a “chicken and egg” problem, and means for example, that new methods would be penalized for correctly identifying homologs missed by older programs. For instance, immunoglobulin variable and constant domains are clearly homologous, but pir places them in different superfamilies. The problem is widespread: each superfamily in pir 48.00 with a structural homolog is itself homologous to an average of 1.6 other pir superfamilies (16).
To surmount these sorts of difficulties, Sander and Schneider (17) used protein structures to evaluate sequence comparison. Rather than comparing different sequence comparison algorithms, their work focused on determining a length-dependent threshold of percentage identity, above which all proteins would be of similar structure. A result of this analysis was the hssp equation; it states that proteins with 25% identity over 80 residues will have similar structures, whereas shorter alignments require higher identity. (Other studies also have used structures (18–20), but these focused on a small number of model proteins and were principally oriented toward evaluating alignment accuracy rather than homology detection.)
A general solution to the problem of scoring comes from statistical measures (i.e., E-values and P-values) based on the extreme value distribution (21). Extreme value scoring was implemented analytically in the blast program using the Karlin and Altschul statistics (22, 23) and empirical approaches have been recently added to fasta and ssearch. In addition to being heralded as a reliable means of recognizing significantly similar proteins (24, 25), the mathematical tractability of statistical scores “is a crucial feature of the blast algorithm” (1). The validity of this scoring procedure has been tested analytically and empirically (see ref. 2 and references in ref. 24). However, all large empirical tests used random sequences that may lack the subtle structure found within biological sequences (26, 27) and obviously do not contain any real homologs. Thus, although many researchers have suggested that statistical scores be used to rank matches (24, 25, 28), there have been no large rigorous experiments on biological data to determine the degree to which such rankings are superior.
A Database for Testing Homology Detection.
Since the discovery that the structures of hemoglobin and myoglobin are very similar though their sequences are not (29), it has been apparent that comparing structures is a more powerful (if less convenient) way to recognize distant evolutionary relationships than comparing sequences. If two proteins show a high degree of similarity in their structural details and function, it is very probable that they have an evolutionary relationship though their sequence similarity may be low.
The recent growth of protein structure information combined with the comprehensive evolutionary classification in the scop database (4, 5) have allowed us to overcome previous limitations. With these data, we can evaluate the performance of sequence comparison methods on real protein sequences whose relationships are known confidently. The scop database uses structural information to recognize distant homologs, the large majority of which can be determined unambiguously. These superfamilies, such as the globins or the immunoglobulins, would be recognized as related by the vast majority of the biological community despite the lack of high sequence similarity.
From scop, we extracted the sequences of domains of proteins in the Protein Data Bank (pdb) (30) and created two databases. One (pdb90d-b) has domains, which were all <90% identical to any other, whereas (pdb40d-b) had those <40% identical. The databases were created by first sorting all protein domains in scop by their quality and making a list. The highest quality domain was selected for inclusion in the database and removed from the list. Also removed from the list (and discarded) were all other domains above the threshold level of identity to the selected domain. This process was repeated until the list was empty. The pdb40d-b database contains 1,323 domains, which have 9,044 ordered pairs of distant relationships, or ≈0.5% of the total 1,749,006 ordered pairs. In pdb90d-b, the 2,079 domains have 53,988 relationships, representing 1.2% of all pairs. Low complexity regions of sequence can achieve spurious high scores, so these were masked in both databases by processing with the seg program (27) using recommended parameters: 12 1.8 2.0. The databases used in this paper are available from http://sss.stanford.edu/sss/, and databases derived from the current version of scop may be found at http://scop.mrc-lmb.cam.ac.uk/scop/.
Analyses from both databases were generally consistent, but pdb40d-b focuses on distantly related proteins and reduces the heavy overrepresentation in the pdb of a small number of families (31, 32), whereas pdb90d-b (with more sequences) improves evaluations of statistics. Except where noted otherwise, the distant homolog results here are from pdb40d-b. Although the precise numbers reported here are specific to the structural domain databases used, we expect the trends to be general.
Assessment Data and Procedure.
Our assessment of sequence comparison may be divided into four different major categories of tests. First, using just a single sequence comparison algorithm at a time, we evaluated the effectiveness of different scoring schemes. Second, we assessed the reliability of scoring procedures, including an evaluation of the validity of statistical scoring. Third, we compared sequence comparison algorithms (using the optimal scoring scheme) to determine their relative performance. Fourth, we examined the distribution of homologs and considered the power of pairwise sequence comparison to recognize them. All of the analyses used the databases of structurally identified homologs and a new assessment criterion.
The analyses tested blast (1), version 1.4.9MP, and wu-blast2 (2), version 2.0a13MP. Also assessed was the fasta package, version 3.0t76 (3), which provided fasta and the ssearch implementation of Smith–Waterman (8). For ssearch and fasta, we used blosum45 with gap penalties −12/−1 (7, 16). The default parameters and matrix (blosum62) were used for blast and wu-blast2.
The “Coverage Vs. Error” Plot.
To test a particular protocol (comprising a program and scoring scheme), each sequence from the database was used as a query to search the database. This yielded ordered pairs of query and target sequences with associated scores, which were sorted, on the basis of their scores, from best to worst. The ideal method would have perfect separation, with all of the homologs at the top of the list and unrelated proteins below. In practice, perfect separation is impossible to achieve so instead one is interested in drawing a threshold above which there are the largest number of related pairs of sequences consistent with an acceptable error rate.
Our procedure involved measuring the coverage and error for every threshold. Coverage was defined as the fraction of structurally determined homologs that have scores above the selected threshold; this reflects the sensitivity of a method. Errors per query (EPQ), an indicator of selectivity, is the number of nonhomologous pairs above the threshold divided by the number of queries. Graphs of these data, called coverage vs. error plots, were devised to understand how protocols compare at different levels of accuracy. These graphs share effectively all of the beneficial features of Reciever Operating Characteristic (ROC) plots (33, 34) but better represent the high degrees of accuracy required in sequence comparison and the huge background of nonhomologs.
This assessment procedure is directly relevant to practical sequence database searching, for it provides precisely the information necessary to perform a reliable sequence database search. The EPQ measure places a premium on score consistency; that is, it requires scores to be comparable for different queries. Consistency is an aspect which has been largely ignored in previous tests but is essential for the straightforward or automatic interpretation of sequence comparison results. Further, it provides a clear indication of the confidence that should be ascribed to each match. Indeed, the EPQ measure should approximate the expectation value reported by database searching programs, if the programs’ estimates are accurate.
The Performance of Scoring Schemes.
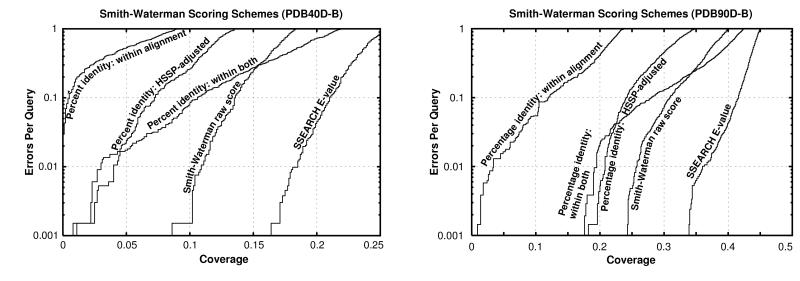
All of the programs tested could provide three fundamental types of scores. The first score is the percentage identity, which may be computed in several ways based on either the length of the alignment or the lengths of the sequences. The second is a “raw” or “Smith–Waterman” score, which is the measure optimized by the Smith–Waterman algorithm and is computed by summing the substitution matrix scores for each position in the alignment and subtracting gap penalties. In blast, a measure related to this score is scaled into bits. Third is a statistical score based on the extreme value distribution. These results are summarized in Fig. 1.
Figure 1.
Coverage vs. error plots of different scoring schemes for ssearch Smith–Waterman. (A) Analysis of pdb40d-b database. (B) Analysis of pdb90d-b database. All of the proteins in the database were compared with each other using the ssearch program. The results of this single set of comparisons were considered using five different scoring schemes and assessed. The graphs show the coverage and errors per query (EPQ) for statistical scores, raw scores, and three measures using percentage identity. In the coverage vs. error plot, the x axis indicates the fraction of all homologs in the database (known from structure) which have been detected. Precisely, it is the number of detected pairs of proteins with the same fold divided by the total number of pairs from a common superfamily. pdb40d-b contains a total of 9,044 homologs, so a score of 10% indicates identification of 904 relationships. The y axis reports the number of EPQ. Because there are 1,323 queries made in the pdb40d-b all-vs.-all comparison, 13 errors corresponds to 0.01, or 1% EPQ. The y axis is presented on a log scale to show results over the widely varying degrees of accuracy which may be desired. The scores that correspond to the levels of EPQ and coverage are shown in Fig. 4 and Table 1. The graph demonstrates the trade-off between sensitivity and selectivity. As more homologs are found (moving to the right), more errors are made (moving up). The ideal method would be in the lower right corner of the graph, which corresponds to identifying many evolutionary relationships without selecting unrelated proteins. Three measures of percentage identity are plotted. Percentage identity within alignment is the degree of identity within the aligned region of the proteins, without consideration of the alignment length. Percentage identity within both is the number of identical residues in the aligned region as a percentage of the average length of the query and target proteins. The hssp equation (17) is H = 290.15l−0.562 where l is length for 10 < l < 80; H > 100 for l < 10; H = 24.7 for l > 80. The percentage identity hssp-adjusted score is the percent identity within the alignment minus H. Smith–Waterman raw scores and E-values were taken directly from the sequence comparison program.
Sequence Identity.
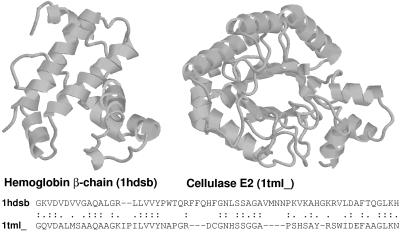
Though it has been long established that percentage identity is a poor measure (35), there is a common rule-of-thumb stating that 30% identity signifies homology. Moreover, publications have indicated that 25% identity can be used as a threshold (17, 36). We find that these thresholds, originally derived years ago, are not supported by present results. As databases have grown, so have the possibilities for chance alignments with high identity; thus, the reported cutoffs lead to frequent errors. Fig. 2 shows one of the many pairs of proteins with very different structures that nonetheless have high levels of identity over considerable aligned regions. Despite the high identity, the raw and the statistical scores for such incorrect matches are typically not significant. The principal reasons percentage identity does so poorly seem to be that it ignores information about gaps and about the conservative or radical nature of residue substitutions.
Figure 2.
Unrelated proteins with high percentage identity. Hemoglobin β-chain (pdb code 1hds chain b, ref. 38, Left) and cellulase E2 (pdb code 1tml, ref. 39, Right) have 39% identity over 64 residues, a level which is often believed to be indicative of homology. Despite this high degree of identity, their structures strongly suggest that these proteins are not related. Appropriately, neither the raw alignment score of 85 nor the E-value of 1.3 is significant. Proteins rendered by rasmol (40).
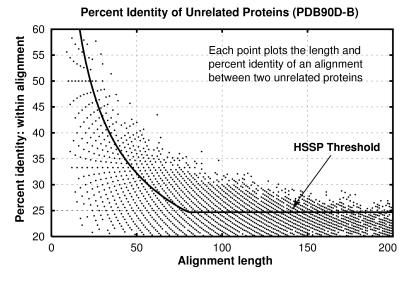
From the pdb90d-b analysis in Fig. 3, we learn that 30% identity is a reliable threshold for this database only for sequence alignments of at least 150 residues. Because one unrelated pair of proteins has 43.5% identity over 62 residues, it is probably necessary for alignments to be at least 70 residues in length before 40% is a reasonable threshold, for a database of this particular size and composition.
Figure 3.
Length and percentage identity of alignments of unrelated proteins in pdb90d-b: Each pair of nonhomologous proteins found with ssearch is plotted as a point whose position indicates the length and the percentage identity within the alignment. Because alignment length and percentage identity are quantized, many pairs of proteins may have exactly the same alignment length and percentage identity. The line shows the hssp threshold (though it is intended to be applied with a different matrix and parameters).
At a given reliability, scores based on percentage identity detect just a fraction of the distant homologs found by statistical scoring. If one measures the percentage identity in the aligned regions without consideration of alignment length, then a negligible number of distant homologs are detected. Use of the hssp equation improves the value of percentage identity, but even this measure can find only 4% of all known homologs at 1% EPQ. In short, percentage identity discards most of the information measured in a sequence comparison.
Raw Scores.
Smith–Waterman raw scores perform better than percentage identity (Fig. 1), but ln-scaling (7) provided no notable benefit in our analysis. It is necessary to be very precise when using either raw or bit scores because a 20% change in cutoff score could yield a tenfold difference in EPQ. However, it is difficult to choose appropriate thresholds because the reliability of a bit score depends on the lengths of the proteins matched and the size of the database. Raw score thresholds also are affected by matrix and gap parameters.
Statistical Scores.
Statistical scores were introduced partly to overcome the problems that arise from raw scores. This scoring scheme provides the best discrimination between homologous proteins and those which are unrelated. Most likely, its power can be attributed to its incorporation of more information than any other measure; it takes account of the full substitution and gap data (like raw scores) but also has details about the sequence lengths and composition and is scaled appropriately.
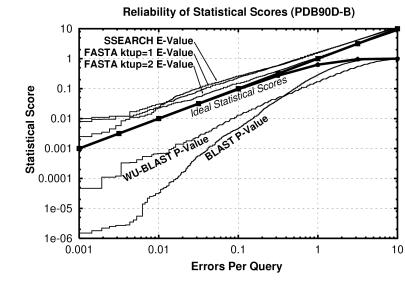
We find that statistical scores are not only powerful, but also easy to interpret. ssearch and fasta show close agreement between statistical scores and actual number of errors per query (Fig. 4). The expectation value score gives a good, slightly conservative estimate of the chances of the two sequences being found at random in a given query. Thus, an E-value of 0.01 indicates that roughly one pair of nonhomologs of this similarity should be found in every 100 different queries. Neither raw scores nor percentage identity can be interpreted in this way, and these results validate the suitability of the extreme value distribution for describing the scores from a database search.
Figure 4.
Reliability of statistical scores in pdb90d-b: Each line shows the relationship between reported statistical score and actual error rate for a different program. E-values are reported for ssearch and fasta, whereas P-values are shown for blast and wu-blast2. If the scoring were perfect, then the number of errors per query and the E-values would be the same, as indicated by the upper bold line. (P-values should be the same as EPQ for small numbers, and diverges at higher values, as indicated by the lower bold line.) E-values from ssearch and fasta are shown to have good agreement with EPQ but underestimate the significance slightly. blast and wu-blast2 are overconfident, with the degree of exaggeration dependent upon the score. The results for pdb40d-b were similar to those for pdb90d-b despite the difference in number of homologs detected. This graph could be used to roughly calibrate the reliability of a given statistical score.
The P-values from blast also should be directly interpretable but were found to overstate significance by more than two orders of magnitude for 1% EPQ for this database. Nonetheless, these results strongly suggest that the analytic theory is fundamentally appropriate. wu-blast2 scores were more reliable than those from blast, but also exaggerate expected confidence by more than an order of magnitude at 1% EPQ.
Overall Detection of Homologs and Comparison of Algorithms.
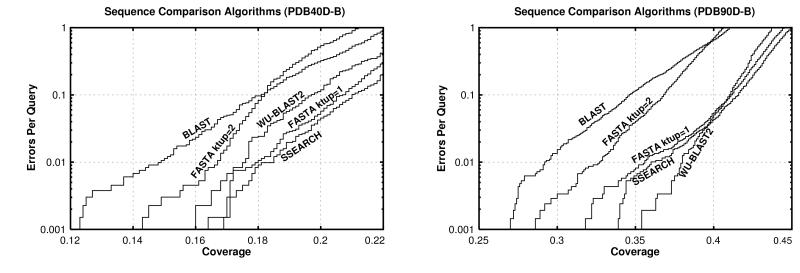
The results in Fig. 5A and Table 1 show that pairwise sequence comparison is capable of identifying only a small fraction of the homologous pairs of sequences in pdb40d-b. Even ssearch with E-values, the best protocol tested, could find only 18% of all relationships at a 1% EPQ. blast, which identifies 15%, was the worst performer, whereas fasta ktup = 1 is nearly as effective as ssearch. fasta ktup = 2 and wu-blast2 are intermediate in their ability to detect homologs. Comparison of different algorithms indicates that those capable of identifying more homologs are generally slower. ssearch is 25 times slower than blast and 6.5 times slower than fasta ktup = 1. wu-blast2 is slightly faster than fasta ktup = 2, but the latter has more interpretable scores.
Figure 5.
Coverage vs. error plots of different sequence comparison methods: Five different sequence comparison methods are evaluated, each using statistical scores (E- or P-values). (A) pdb40d-b database. In this analysis, the best method is the slow ssearch, which finds 18% of relationships at 1% EPQ. fasta ktup = 1 and wu-blast2 are almost as good. (B) pdb90d-b database. The quick wu-blast2 program provides the best coverage at 1% EPQ on this database, although at higher levels of error it becomes slightly worse than fasta ktup = 1 and ssearch.
Table 1.
Summary of sequence comparison methods with pdb40d-b
| Method | Relative Time* | 1% EPQ Cutoff | Coverage at 1% EPQ |
|---|---|---|---|
| ssearch % identity: within alignment | 25.5 | >70% | <0.1 |
| ssearch % identity: within both | 25.5 | 34% | 3.0 |
| ssearch % identity: hssp-scaled | 25.5 | 35% (hssp + 9.8) | 4.0 |
| ssearch Smith–Waterman raw scores | 25.5 | 142 | 10.5 |
| ssearch E-values | 25.5 | 0.03 | 18.4 |
| fasta ktup = 1 E-values | 3.9 | 0.03 | 17.9 |
| fasta ktup = 2 E-values | 1.4 | 0.03 | 16.7 |
| wu-blast2 P-values | 1.1 | 0.003 | 17.5 |
| blast P-values | 1.0 | 0.00016 | 14.8 |
Times are from large database searches with genome proteins.
In pdb90d-b, where there are many close relationships, the best method can identify only 38% of structurally known homologs (Fig. 5B). The method which finds that many relationships is wu-blast2. Consequently, we infer that the differences between fasta kup = 1, ssearch, and wu-blast2 programs are unlikely to be significant when compared with variation in database composition and scoring reliability.
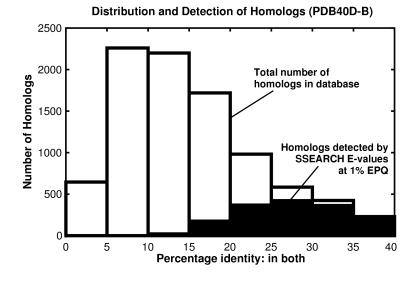
Fig. 6 helps to explain why most distant homologs cannot be found by sequence comparison: a great many such relationships have no more sequence identity than would be expected by chance. ssearch with E-values can recognize >90% of the homologous pairs with 30–40% identity. In this region, there are 30 pairs of homologous proteins that do not have significant E-values, but 26 of these involve sequences with <50 residues. Of sequences having 25–30% identity, 75% are identified by ssearch E-values. However, although the number of homologs grows at lower levels of identity, the detection falls off sharply: only 40% of homologs with 20–25% identity are detected and only 10% of those with 15–20% can be found. These results show that statistical scores can find related proteins whose identity is remarkably low; however, the power of the method is restricted by the great divergence of many protein sequences.
Figure 6.
Distribution and detection of homologs in pdb40d-b. Bars show the distribution of homologous pairs pdb40d-b according to their identity (using the measure of identity in both). Filled regions indicate the number of these pairs found by the best database searching method (ssearch with E-values) at 1% EPQ. The pdb40d-b database contains proteins with <40% identity, and as shown on this graph, most structurally identified homologs in the database have diverged extremely far in sequence and have <20% identity. Note that the alignments may be inaccurate, especially at low levels of identity. Filled regions show that ssearch can identify most relationships that have 25% or more identity, but its detection wanes sharply below 25%. Consequently, the great sequence divergence of most structurally identified evolutionary relationships effectively defeats the ability of pariwise sequence comparison to detect them.
After completion of this work, a new version of pairwise blast was released: blastgp (37). It supports gapped alignments, like wu-blast2, and dispenses with sum statistics. Our initial tests on blastgp using default parameters show that its E-values are reliable and that its overall detection of homologs was substantially better than that of ungapped blast, but not quite equal to that of wu-blast2.
CONCLUSION
The general consensus amongst experts (see refs. 7, 24, 25, 27 and references therein) suggests that the most effective sequence searches are made by (i) using a large current database in which the protein sequences have been complexity masked and (ii) using statistical scores to interpret the results. Our experiments fully support this view.
Our results also suggest two further points. First, the E-values reported by fasta and ssearch give fairly accurate estimates of the significance of each match, but the P-values provided by blast and wu-blast2 underestimate the true extent of errors. Second, ssearch, wu-blast2, and fasta ktup = 1 perform best, though blast and fasta ktup = 2 detect most of the relationships found by the best procedures and are appropriate for rapid initial searches.
The homologous proteins that are found by sequence comparison can be distinguished with high reliability from the huge number of unrelated pairs. However, even the best database searching procedures tested fail to find the large majority of distant evolutionary relationships at an acceptable error rate. Thus, if the procedures assessed here fail to find a reliable match, it does not imply that the sequence is unique; rather, it indicates that any relatives it might have are distant ones.**
Acknowledgments
The authors are grateful to Drs. A. G. Murzin, M. Levitt, S. R. Eddy, and G. Mitchison for valuable discussion. S.E.B. was principally supported by a St. John’s College (Cambridge, UK) Benefactors’ Scholarship and by the American Friends of Cambridge University. S.E.B. dedicates his contribution to the memory of Rabbi Albert T. and Clara S. Bilgray.
ABBREVIATION
- EPQ
errors per query
Footnotes
Additional and updated information about this work, including supplementary figures, may be found at http://sss.stanford.edu/sss/.
References
- 1.Altschul S F, Gish W, Miller W, Myers E W, Lipman D J. J Mol Biol. 1990;215:403–410. doi: 10.1016/S0022-2836(05)80360-2. [DOI] [PubMed] [Google Scholar]
- 2.Altschul S F, Gish W. Methods Enzymol. 1996;266:460–480. doi: 10.1016/s0076-6879(96)66029-7. [DOI] [PubMed] [Google Scholar]
- 3.Pearson W R, Lipman D J. Proc Natl Acad Sci USA. 1988;85:2444–2448. doi: 10.1073/pnas.85.8.2444. [DOI] [PMC free article] [PubMed] [Google Scholar]
- 4.Murzin A G, Brenner S E, Hubbard T, Chothia C. J Mol Biol. 1995;247:536–540. doi: 10.1006/jmbi.1995.0159. [DOI] [PubMed] [Google Scholar]
- 5.Brenner S E, Chothia C, Hubbard T J P, Murzin A G. Methods Enzymol. 1996;266:635–643. doi: 10.1016/s0076-6879(96)66039-x. [DOI] [PubMed] [Google Scholar]
- 6.Pearson W R. Genomics. 1991;11:635–650. doi: 10.1016/0888-7543(91)90071-l. [DOI] [PubMed] [Google Scholar]
- 7.Pearson W R. Protein Sci. 1995;4:1145–1160. doi: 10.1002/pro.5560040613. [DOI] [PMC free article] [PubMed] [Google Scholar]
- 8.Smith T F, Waterman M S. J Mol Biol. 1981;147:195–197. doi: 10.1016/0022-2836(81)90087-5. [DOI] [PubMed] [Google Scholar]
- 9.George D G, Hunt L T, Barker W C. Methods Enzymol. 1996;266:41–59. doi: 10.1016/s0076-6879(96)66005-4. [DOI] [PubMed] [Google Scholar]
- 10.Vogt G, Etzold T, Argos P. J Mol Biol. 1995;249:816–831. doi: 10.1006/jmbi.1995.0340. [DOI] [PubMed] [Google Scholar]
- 11.Henikoff S, Henikoff J G. Proteins. 1993;17:49–61. doi: 10.1002/prot.340170108. [DOI] [PubMed] [Google Scholar]
- 12.Bairoch A, Apweiler R. Nucleic Acids Res. 1996;24:21–25. doi: 10.1093/nar/24.1.21. [DOI] [PMC free article] [PubMed] [Google Scholar]
- 13.Bairoch A, Bucher P, Hofmann K. Nucleic Acids Res. 1996;24:189–196. doi: 10.1093/nar/24.1.189. [DOI] [PMC free article] [PubMed] [Google Scholar]
- 14.Henikoff S, Henikoff J G. Proc Natl Acad Sci USA. 1992;89:10915–10919. doi: 10.1073/pnas.89.22.10915. [DOI] [PMC free article] [PubMed] [Google Scholar]
- 15.Dayhoff M, Schwartz R M, Orcutt B C. In: Atlas of Protein Sequence and Structure. Dayhoff M, editor. Vol. 5. Silver Spring, MD: National Biomedical Research Foundation; 1978. , Suppl. 3, pp. 345–352. [Google Scholar]
- 16.Brenner S E. Ph.D. thesis. UK: University of Cambridge; 1996. [Google Scholar]
- 17.Sander C, Schneider R. Proteins. 1991;9:56–68. doi: 10.1002/prot.340090107. [DOI] [PubMed] [Google Scholar]
- 18.Johnson M S, Overington J P. J Mol Biol. 1993;233:716–738. doi: 10.1006/jmbi.1993.1548. [DOI] [PubMed] [Google Scholar]
- 19.Barton G J, Sternberg M J E. Protein Eng. 1987;1:89–94. doi: 10.1093/protein/1.2.89. [DOI] [PubMed] [Google Scholar]
- 20.Lesk A M, Levitt M, Chothia C. Protein Eng. 1986;1:77–78. doi: 10.1093/protein/1.1.77. [DOI] [PubMed] [Google Scholar]
- 21.Arratia R, Gordon L, M W. Ann Stat. 1986;14:971–993. [Google Scholar]
- 22.Karlin S, Altschul S F. Proc Natl Acad Sci USA. 1990;87:2264–2268. doi: 10.1073/pnas.87.6.2264. [DOI] [PMC free article] [PubMed] [Google Scholar]
- 23.Karlin S, Altschul S F. Proc Natl Acad Sci USA. 1993;90:5873–5877. doi: 10.1073/pnas.90.12.5873. [DOI] [PMC free article] [PubMed] [Google Scholar]
- 24.Altschul S F, Boguski M S, Gish W, Wootton J C. Nat Genet. 1994;6:119–129. doi: 10.1038/ng0294-119. [DOI] [PubMed] [Google Scholar]
- 25.Pearson W R. Methods Enzymol. 1996;266:227–258. doi: 10.1016/s0076-6879(96)66017-0. [DOI] [PubMed] [Google Scholar]
- 26.Lipman D J, Wilbur W J, Smith T F, Waterman M S. Nucleic Acids Res. 1984;12:215–226. doi: 10.1093/nar/12.1part1.215. [DOI] [PMC free article] [PubMed] [Google Scholar]
- 27.Wootton J C, Federhen S. Methods Enzymol. 1996;266:554–571. doi: 10.1016/s0076-6879(96)66035-2. [DOI] [PubMed] [Google Scholar]
- 28.Waterman M S, Vingron M. Stat Science. 1994;9:367–381. [Google Scholar]
- 29.Perutz M F, Kendrew J C, Watson H C. J Mol Biol. 1965;13:669–678. [Google Scholar]
- 30.Abola E E, Bernstein F C, Bryant S H, Koetzle T F, Weng J. In: Crystallographic Databases: Information Content, Software Systems, Scientific Applications. Allen F H, Bergerhoff G, Sievers R, editors. Cambridge, UK: Data Comm. Intl. Union Crystallogr.; 1987. pp. 107–132. [Google Scholar]
- 31.Brenner S E, Chothia C, Hubbard T J P. Curr Opin Struct Biol. 1997;7:369–376. doi: 10.1016/s0959-440x(97)80054-1. [DOI] [PubMed] [Google Scholar]
- 32.Orengo C, Michie A, Jones S, Jones D T, Swindells M B, Thornton J. Structure (London) 1997;5:1093–1108. doi: 10.1016/s0969-2126(97)00260-8. [DOI] [PubMed] [Google Scholar]
- 33.Zweig M H, Campbell G. Clin Chem. 1993;39:561–577. [PubMed] [Google Scholar]
- 34.Gribskov M, Robinson N L. Comput Chem. 1996;20:25–33. doi: 10.1016/s0097-8485(96)80004-0. [DOI] [PubMed] [Google Scholar]
- 35.Fitch W M. J Mol Biol. 1966;16:9–16. doi: 10.1016/s0022-2836(66)80258-9. [DOI] [PubMed] [Google Scholar]
- 36.Chung S Y, Subbiah S. Structure (London) 1996;4:1123–1127. doi: 10.1016/s0969-2126(96)00119-0. [DOI] [PubMed] [Google Scholar]
- 37.Altschul S F, Madden T L, Schaffer A A, Zhang J, Zhang Z, Miller W, Lipman D J. Nucleic Acids Res. 1997;25:3389–3402. doi: 10.1093/nar/25.17.3389. [DOI] [PMC free article] [PubMed] [Google Scholar]
- 38.Girling R, Schmidt W, Jr, Houston T, Amma E, Huisman T. J Mol Biol. 1979;131:417–433. doi: 10.1016/0022-2836(79)90001-9. [DOI] [PubMed] [Google Scholar]
- 39.Spezio M, Wilson D, Karplus P. Biochemistry. 1993;32:9906–9916. doi: 10.1021/bi00089a006. [DOI] [PubMed] [Google Scholar]
- 40.Sayle R A, Milner-White E J. Trends Biochem Sci. 1995;20:374–376. doi: 10.1016/s0968-0004(00)89080-5. [DOI] [PubMed] [Google Scholar]


