

Abstract
Meta-analyses combining gene expression microarray experiments offer new insights into the molecular pathophysiology of disease not evident from individual experiments. Although the established technical reproducibility of microarrays serves as a basis for meta-analysis, pathophysiological reproducibility across experiments is not well established. In this study, we carried out a large-scale analysis of disease-associated experiments obtained from NCBI GEO, and evaluated their concordance across a broad range of diseases and tissue types. On evaluating 429 experiments, representing 238 diseases and 122 tissues from 8435 microarrays, we find evidence for a general, pathophysiological concordance between experiments measuring the same disease condition. Furthermore, we find that the molecular signature of disease across tissues is overall more prominent than the signature of tissue expression across diseases. The results offer new insight into the quality of public microarray data using pathophysiological metrics, and support new directions in meta-analysis that include characterization of the commonalities of disease irrespective of tissue, as well as the creation of multi-tissue systems models of disease pathology using public data.
Keywords: computational biology, meta-analysis, microarrays
Introduction
Aggregate analysis of gene expression microarrays (Lipshutz et al, 1995; Schena et al, 1995) across multiple studies is lending an unprecedented molecular view of the broad spectrum of human disease (Alizadeh et al, 2000; Golub et al, 1999). Ramaswamy et al (2003) were among the first to show how a taxonomy of cancers could be created after building a reference collection of gene expression profiles for multiple types of cancers. This approach was extended to find common changes in gene expression across publicly available cancer microarray experiments (Rhodes et al, 2004). Segal et al (2004) integrated 1975 microarrays, representing 22 tumor types, to uncover a ‘module map' of gene modules with conditional expression patterns across tumor types. Despite these successes, the considerable variation inherent to microarray data greatly confounds efforts to integrate data across multiple experiments.
There have been a number of efforts to characterize and mitigate potentially confounding, non-biological sources of variance in microarray data. In 2006, the Microarray Quality Control Consortium (MAQC) showed that measurements are technically reproducible across test sites and manufacturer (Shi et al, 2006). It was shown that lab-to-lab variation imparts a significant effect on microarray measurements (Irizarry et al, 2005), however, a number of robust methods to handle such variation have been developed (Breitling et al, 2004; Choi et al, 2007; Huttenhower et al, 2006; Pihur et al, 2008; Zilliox and Irizarry, 2007). Although these efforts lend credence to the technical equivalence of microarray data across experiments, the biological equivalence of microarray data across experiments is not well characterized.
A recent study suggests that gene expression measurements can be combined to gain new biological insights that are relevant beyond their original experimental context. Bild et al (2006) built a collection of genome-wide changes in breast cancer cell lines in response to the overexpression of several oncogenes, then used these to probe public microarray measurements of other types of cancers. Similarly, Lamb et al (2006) built a larger collection of responses in human breast cancer cell lines toward 164 different small molecules, then used these to probe previously unexplainable gene expression changes in completely different tissues and diseases, finding agonists with responses equivalent to a diet-induced obesity model in rat fat cells. These studies suggest that the signature of a disease is robust irrespective of the tissue in which it was studied, however, the generalization of this phenomenon across all of human disease has not been established. To fully evaluate such a hypothesis requires a sufficiently large and diverse collection of microarray data for human diseases.
Public microarray data repositories have emerged as enabling resources for the integrative genomic study of human disease (Rhodes and Chinnaiyan, 2005). Coincident with their successful use, and because many journals require the public availability of such data (Anonymous, 2002), the amount of microarray data in international repositories is now growing exponentially (Parkinson et al, 2009). The largest among these is the National Center for Biotechnology Information (NCBI) Gene Expression Omnibus (GEO) (Wheeler et al, 2006). As of this writing, GEO holds information on >300 000 samples (i.e. microarrays) from >12 000 experiments, and doubles in size each year. Enabled by the vast repertoire of GEO experiments studying numerous human diseases (e.g. diabetes) across a broad diversity of tissues types (e.g. muscle and fat), we can pose an important question in integrative biology: is there a general disease concordance across public microarray experiments irrespective of platform and tissue? In this study, we carried out a systematic evaluation of disease-associated experiments in GEO to evaluate the robustness of the disease signal across tissues and experiments.
To ensure our findings were robust and unbiased towards any specific choice of analytic methodology, we designed a computational ‘pipeline' using 84 combinations of normalization, probe-level integration, and significance testing methods (Box 1). We find that there is a general concordance between disease states across tissues, irrespective of other confounding sources of biological or technical variation inherent in the data. Furthermore, we find that this disease concordance is more prominent than other potentially concordant biological factors, such as tissue type. Our results raise several important implications for the downstream translational research value of public microarray data in building systematic models of disease pathogenesis, prognosis, and treatment.
Results and discussion
Discovery and annotation of disease-associated microarray experiments
To evaluate the hypothesis of disease concordance across microarray experiments, we first assembled a large data set of disease-associated microarray experiments from NCBI GEO and systematically annotated each experiment to codify the disease and tissue conditions that were measured. This process identified 429 disease-associated experiments that measured both a disease and normal control state, representing 238 unique diseases measured in 122 distinct tissues. In total, these experiments yielded 429 diseases versus control comparisons that were associated with 8435 microarray samples comprised of more than 161 distinct microarray platforms. Interestingly, 95 diseases were found to have two or more representative experiments in public data, even given our constraint that each experiment was required to have samples for both the disease and normal control conditions. Although diseases important to public health, such as type 2 diabetes, are among the diseases with the most experiments, it was possible to find replicate experiments for rare disorders, such as essential thrombocythemia, in public data.
Quantifying and comparing disease conditions
For each of the 429 disease-associated experiments, we computed a disease state vector, which represented the change in expression in the disease condition relative to the normal control condition for all measured genes. To evaluate the effects of various data normalization and disease state quantification methods, we created parallel sets of disease state vectors using many different combinations of commonly used normalization and quantification methods (see Materials and methods for details), which we will refer to as pipeline routings. For each of the 84 possible pipeline routings, we computed all possible within-species, pair-wise correlations between disease state vectors, which resulted in 36 417 distinct correlation measures per pipeline routing (3 059 028 total correlations). As a control, we also calculated these pair-wise correlations after randomly shuffling tissue and disease annotation labels.
We find the ability to establish a statistical concordance between microarray experiments depends on the normalization and disease state quantification methods chosen. In our analysis, the subtractive approach to disease state quantification, in which the gene expression values from the normal state are simply subtracted from those in the respective disease state, outperforms fold-change and t-test methods in capturing disease concordance within and across tissues (Supplementary Table S1). It is surprising that t-test methods performed poorly in capturing disease concordance, as t-test-based methods are among the most commonly used in microarray data analysis. However, t-test based methods are strongly influenced by estimates of gene-specific variance (Breitling et al, 2004), therefore, it is likely that the t-test approach suffered from the small sample sizes, characteristic of a number of disease experiments in the public data. The prominence of the subtractive methods may be explained by the use of correlation as our concordance measure, and the possibility that the magnitudes of critical differential gene expression changes in the disease state are somehow dampened by fold-change and t-test-based approaches. As an alternative measure of disease signature robustness, we computed ROC AUC distributions for each disease/tissue category using the best performing method under correlation, and we found that concordant experiments are also significantly predictive of each other (Supplementary Figure S1).
Disease concordance versus tissue concordance
To gain a comprehensive picture of disease concordance across microarray experiments, we evaluated whether correlations between disease-associated experiments were driven by tissue-specific gene expression. For each pipeline routing, the resulting 36 417 pair-wise correlation coefficients were assigned to one of the four categories according to their disease and tissue annotations. Under this scheme, we could evaluate the distributions of correlations between experiments in which both vectors measured the same disease from the same tissue (D+/T+), the same disease from different tissues (D+/T−), different diseases from the same tissue (D−/T+), or different diseases from different tissues (D−/T−). Analysis of the Fisher's z transformed correlation coefficient distributions between these categories revealed a significant degree of variance among pipeline routings with regards to the strength of the disease signal over the tissue signal. Figure 1 contrasts the results between two pipeline routings. Figure 1a shows a pipeline routing in which correlation coefficients between disease state vectors measuring the same disease from the same tissue (D+/T+) were significantly greater than correlations between different diseases in the same tissue (D−/T+) (Tukey's HSD P-value=1.15 × 10⁻¹⁴). In contrast, the pipeline routing in Figure 1b shows correlation coefficients with no differences between D+/T+ and D−/T+.
Figure 1.

Boxplots comparing the distributions of the Fisher's z transformed correlation coefficients across the four disease/tissue categories. Boxplot in (A) shows a pipeline routing using parameters (NoNorm/NoCollapse/NoAggregate/SubtractiveDiff), which resulted in a significant separation of the same disease, different tissue category (D+/T−) from the different disease, same tissue category (D−/T+). Boxplot in (B) shows a pipeline routing using parameters (NoNorm/NoCollapse/NoAggregate/TtestDiff), which resulted in a distribution similar to that produced by the randomized data using the same pipeline routing parameters.
For many pipeline routings, we found that the distribution of correlations between disease state vectors, measuring the same disease in a different tissue (D+/T−), was often higher than the distributions of correlations between disease state vectors measuring a different disease in the same tissue (D−/T+). Such a case is illustrated by the pipeline routing in Figure 1a. These cases seem to imply that the signal of disease concordance across microarray experiments is stronger than the signal of tissue concordance.
To determine whether this observation could be generalized across all pipeline routings, we plotted the median disease/tissue category correlation coefficients for each of the 84 pipeline routings, along with the medians computed by randomly shuffling annotation labels for each pipeline routing (Figure 2). We find support for a general trend indicating that the disease concordance signal was generally distinguished above the level of the tissue concordance signal irrespective of the data processing techniques applied.
Figure 2.

An aggregate view of the median correlation across the four disease/tissue categories for all 84 possible pipeline routings. Vertical black bars represent the s.e.m. correlation. The colored lines connect disease/tissue category medians computed using the same pipeline-routing. Although certain pipeline routings perform better than others at establishing disease concordance, we observe a general trend indicating that the disease signal is stronger than the tissue signal regardless of the analytical methods used.
The relative strength of the disease concordance signal over the tissue concordance signal is a compelling finding with substantial implications for the general practice of microarray meta-analysis. One might have expected a relatively strong degree of concordance between diseases experiments sampled from the same tissue, given the number of genes likely to be involved in tissue-specific biology (Kilpinen et al, 2008; Shyamsundar et al, 2005). However, we have shown here that disease conditions seem to have synchronized gene expression changes across different tissues. Figure 3 illustrates the symmetry in gene expression that can be observed for the same disease across tissues. In Figure 3, we observe a significant concordance between two experiments measuring Huntington's disease from different tissues, whereas there is relatively minimal concordance observed between two experiments measuring distinct diseases from the same tissue. This could occur as the result of the systemic nature of the disease pathogenesis. For example, a localized gene expression signature involving INF-γ, TNF-α, IL-2, IL-12, and IL-18 genes might signify the formation of noncaseating granulomatous lesions across multiple tissue types in systemic sarcoidosis (Kettritz et al, 2006; Nunes et al, 2007). It is also possible that there are limited channels through which disparate tissues communicate, and perhaps disease conditions essentially maximize the amplitude of communication in one type of channel to the effect of synchronizing the genes mediating the communication. For example, hyperglycemia in diabetes might maximize the amplitude of signaling and pathways involved in the regulation of insulin, glucagon, and other hormones across muscle, hepatic, and pancreatic tissues (Bansal and Wang, 2008; Yano et al, 2008). Recently, Dobrin et al (2009) discovered that tissue-to-tissue co-expression sub-networks in mouse models for obesity were more highly connected than within-tissue networks, lending credence to this assertion. Perhaps another explanation for the observed lack of tissue concordance is greater variation in tissue-specific gene expression than previously acknowledged between and among populations represented in public data (Whitehead and Crawford, 2005).
Figure 3.

Symmetry of disease-state gene expression for the same disease in different tissues (D+/T−) versus different diseases in the same tissue (D−/T+). The colors indicate the direction of change in the expression of a gene in the disease state relative to the normal control state, in which green indicates upregulation of disease, and red indicates downregulation of disease. Here we observe that the differential expression concordance between Huntington's disease in the brain (GDS2169) and blood (GDS1331) is much more extensive than that observed between type 2 diabetes (GDS162) and Duchenne's muscular dystrophy (GDS214) in skeletal muscle.
We acknowledge several limitations to the approach taken by this study. Foremost, we acknowledge that experimental investigators will generally draw samples from tissues that are relevant to the disease condition under study. Therefore, we cannot assert that disease concordance would be maintained in samples drawn from tissues that would not commonly be chosen in the study of a disease. Nonetheless, the primary purpose of this investigation was to make observations from the data currently available in public repositories. We also recognize that the results are dependent on the quality and accuracy of the vocabulary annotations attributed to the experiments, though here, we manually validated our annotations. We also acknowledge that these vocabularies are dynamic, in which a term describing a single tissue might be split into two different concepts in the future, and that the vocabulary structure may have a bearing on the interpretation of the results. However, we determined that there was no significant relationship between vocabulary structure and observed correlation values (Supplementary Figure S2).
The findings of this study raise several important implications for the study of human disease and the role of public data in translational research. With the understanding of a general, trans-tissue disease concordance across the public microarray data, it is now reasonable to undertake efforts to incorporate these data in new systems models for disease pathology across multiple tissues and organ systems. One possible utility would be in biomarker discovery, in which the traditional practice begins with a disease condition of interest and applies molecular quantification techniques to discover putative molecular markers that signify some aspect of the molecular pathology. Instead, a broader systems view of disease derived from public data would serve as a filter to restrict costly efforts in biomarker discovery and validation of the space of molecular components and phenomena that are unique to the disease condition under study (Dudley and Butte, 2009). Furthermore, the trans-tissue nature of disease concordance suggests that it is reasonable to leverage public data to search for biomarkers in more peripheral cells and fluids, such as those found in blood and urine. This potential is illustrated in Supplementary Figure S3, in which a microarray experiment measuring type 2 diabetes (T2D) in the blood is clustered with a core set of experiments measuring various diseases from skeletal muscle. Not only do the diseases cluster consistently within tissue, but also the experiment measuring T2D in peripheral blood is clearly matched with the experiment measuring T2D in muscle. Future study should seek to model relationships between primary affected tissues and peripheral fluids within the public data to determine whether the potential demonstrated in Supplementary Figure S3 can be generalized across a broad range of human diseases.
These findings also suggest support for experimental designs that are inclusive of both newly generated data and relevant data available from public data repositories. We previously showed that the integration of 49 obesity-related, genome-wide experiments significantly improved the predictive capability for discovering obesity-associated genes (English and Butte, 2007), and the results from the study detailed here validates a similar inclusive approach for every disease represented in public data. Furthermore, major research is presently underway by others to characterize sub-types of clinically heterogeneous diseases such as breast cancers, which are observed to show a great deal of variance with regards to response to therapeutics and patient outcomes (Weigelt et al, 2008; Wirapati et al, 2008). We argue that when investigating the drivers of molecular concordance between diseases, public experiments should be seen as opportunities to allow for new directions in research into the shared molecular pathophysiology of disease, which might offer a more concise molecular characterization of the heterogeneity observed within diseases or disease categories.
With the growing set of publicly available molecular measurement data, biological and clinical investigators are now enabled to ask new questions about the global properties of human disease, and to build multi-tissue systems models for disease pathophysiology. Future studies in this area are likely to impact our fundamental understanding of the molecular bases of human disease, the repurposing of therapeutics across disease conditions, or even lead to a completely new system of human disease classification founded on molecular characteristics, rather than symptoms and anatomy.
Materials and methods
Discovery and annotation of disease experiments
Gene expression microarray experiments in the NCBI GEO characterizing human disease conditions were automatically identified using a previously published method (Butte and Chen, 2006). Briefly, Medical Subject Heading (MeSH) terms attributed to publications associated with GEO experiments (accessed 26 November 2007) were evaluated for disease concepts using the Unified Medical Language System (UMLS) (release 2007AC) (Bodenreider, 2004). Each of these experimental data sets determined to be relevant to a human disease, based on associated MeSH disease concepts, was subject to an automated annotation of the disease condition, the tissue or biological substance from which the samples were derived, and whether or not the experiment measured a normal control state complimentary to the annotated disease state. The automated annotation step was carried out using a previously published method that analyzes particular annotations in a GEO DataSet (GDS), which is a higher-order representation of an experiment (GSE) in GEO that groups experimental samples into logical subsets (e.g. ‘control' and ‘treatment') using a free-text vocabulary (Dudley and Butte, 2008). Disease and tissue annotations were manually reviewed in a post-processing step to ensure accuracy.
Our resulting data set incorporated 238 diseases studied across 385 GEO DataSets comprising 8435 individual microarrays, studied in 122 tissues.
To evaluate the hypothesis of a general disease concordance independent of tissue type, we constructed an extensive computational analytic pipeline (Box 1). The analytic pipeline comprised several processing step, with a final step that calculates statistics from the aggregate microarray experiments after they have been processed be previous steps in the pipeline. For each run of the pipeline, called a pipeline routing, our entire annotated set of 8435 microarrays is offered as input data, and a number of available option parameters is fixed before execution.
Pipeline step 1: normalize values
For each microarray platform represented in the set of disease-associated experiments, we updated the mappings between platform-specific probe identifiers and Entrez Gene identifiers in an automated manner using the AILUN system (Chen et al, 2007). Then, for each experiment, we derived two new sets (i.e. disease and control) of normalized microarrays using three normalization methods. In the first method, we rank-normalized the probes per array by assigning a rank value to each probe on the basis of the rank of the measured intensity relative to all other probes on the array (RankNorm). To account for the fact that the number of probes differs among array platforms, we divided the rank values by the total number of probes to scale them between zero and one. In the second normalization method, we median centered the arrays by shifting the probe intensity values in each array such that the median value across all probes was set to zero if the data were in log scale, or set to one if the data were untransformed (CenterNorm). This normalization approach makes the assumption that the expression levels of the majority of genes is not expected to change significantly between conditions. A third option was to simply use the unprocessed expression values obtained directly from GEO (NoNorm). It is important to note that in many cases, the raw expression values obtained from GEO may already be normalized using one of many possible methods. Therefore, in the context of this study, the concept of normalization is more representative of experiment-wise normalization rather than normalization of truly raw microarray data usually found in CEL data files.
Pipeline step 2: collapse probes
In many cases, a microarray platform was found to have multiple probes reporting for a single Entrez GeneID (e.g. probes 216066_at and 215869_at on the Affymetrix Hu133v2.0 both map to Entrez GeneID 19). We designed the pipeline to offer two different options for handling such cases. The first option was to simply retain the multiple mappings (NoCollapse), which impacts downstream pipeline step 3 (Aggregate Arrays) and step 4 (Disease State Quantification) by increasing the number of expression values per gene when calculating summary statistics across samples, or between disease and normal conditions. The second option was to calculate the mean expression value for all probes associated with a GeneID on a per chip basis, such that each GeneID with multiple probes was assigned the mean expression value of its associated probes (MeanCollapse).
Pipeline step 3: aggregate arrays
This analysis only incorporated GEO experiments that offered replicate samples (i.e. n>1) for both control and disease conditions. Therefore, we designed the pipeline to offer several different options for handling sample replicates. In all cases options are applied within a condition only (i.e. normal control samples could only be merged with other normal control samples), and the merging refers to the merging of expression values across samples on a per-gene basis. The first option is to take the mean value for a gene across samples (MeanAggregate). The second option is to take the median value for a gene across samples (MedianAggregate). The third option is to take the maximum expression value for a gene across samples (MaxAggregate). The fourth option is to take the minimum expression value for a gene across samples (MinAggregate). Finally, there is the option to leave the replicate samples unmerged (NoAggregate). The sample merging step is not available when the t-test option is used in pipeline step 4 (Disease State Quantification) because the t-test requires n>1 samples in each condition.
Pipeline step 4: disease state quantification
We define a disease state vector as a quantification of the change in expression in the disease condition relative to the control condition, for all genes measured on the microarray platform. In this way, a disease state vector represents a quantity of change from control to disease for all measured genes. The pipeline was designed to offer three different options for quantifying the disease state represented in an experiment. The first option is to compute the subtractive difference in expression between the disease and control condition by simply subtracting the expression values for the control from the respective disease values (SubtractiveDiff). The second option is to compute the fold change in expression between the disease and control condition by computing the log of the ratio of the disease expression value over the control expression value (FoldDiff). The third option computes a t-test statistic between the expression values in the control condition and the expression values in the disease condition (TtestDiff). The P-value of the t-tests were retained as the quantification of the change in expression between control and disease if the expression values for a particular microarray platform were log-transformed, the subtractive difference was calculated as a ratio, and the fold change was calculated using the simple difference. If the experiment arrives at this step without the samples merged, and if either the subtractive or fold change option is selected, the pipeline computes all pair-wise differences between samples for all measured genes using the chosen method to build a distribution of quantified differences. The pipeline then offers the option to take either the mean or the median value for this distribution as the quantified difference in expression. If the experiment arrives at this step with the samples merged, then the t-test quantification option is disabled.
Pipeline step 5: computing disease concordance
This step proceeds once all the experiments have passed through pipeline steps 1–4; at that point the resulting disease state vectors are aggregated for disease concordance analysis. In this step, all possible pair-wise correlations between the 429 disease state vectors are computed. These 36 417 pair-wise correlations are then grouped into four categories defined by the disease condition and by the source biological tissue:
Within-disease/within-tissue (D+/T+)
Pair-wise correlations were assigned to this category if both disease state vectors were annotated as measuring the same disease from the same source tissue (n=233).
Within-disease/between-tissue (D+/T−)
Pair-wise correlations were assigned to this category if both disease state vectors were annotated as measuring the same disease, but the samples were acquired from different source tissues (n=172).
Between-disease/within-tissue (D−/T+)
Pair-wise correlations were assigned to this category if both disease-state vectors were annotated as being acquired from the same source tissue, but measured different diseases (n=882).
Between-disease/between-tissue (D−/T−)
Pair-wise correlations were assigned to this category if both disease-state vectors were annotated as measuring different diseases, and the samples were acquired from different tissues (n=35 130).
All correlations were computed using Spearman's rank-based correlation to mitigate potentially confounding effects of between-platform and between-lab measurement variation, and also due to the fact that the normality of expression changes in disease state vectors could not be assumed across all platforms and conditions.
The pipeline then tests for a significant difference in the distribution of correlations between comparison categories by converting the correlation values in each category to Fisher's z-scores and carrying out a one-way ANOVA. Given that a significant rejection of the null hypothesis in a one-way ANOVA will support the alternative hypothesis that, at least, one mean is different, a pair-wise evaluation of differences in distributions was also carried out by applying Tukey's Honest Significant Difference (HSD) test to the Fisher's z-score distributions in each category.
As an additional control, the pipeline derives a random distribution of correlations for each disease/tissue category by carrying out ten rounds of randomization, in which the disease and tissue labels for all experiments were shuffled before computing correlations and statistical tests.
Schematic diagram for the pipeline used to evaluate disease concordance across public microarray experiments.
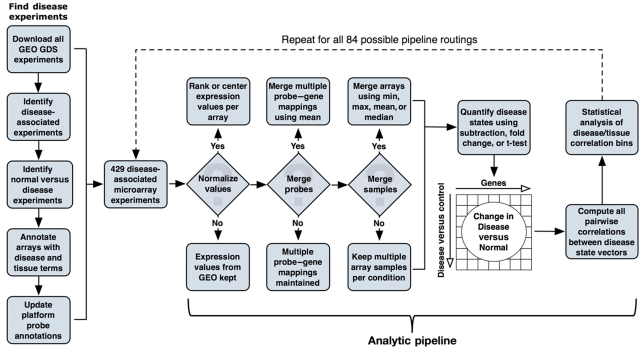
The full complement of 429 disease-associated microarray experiments was repeatedly evaluated by the pipeline under all 84 possible combinations of pipeline parameters to comprehensively evaluate the robustness of disease signatures.
Supplementary Material
Supplementary Materials and Methods, Supplementary table S1, Supplementary figures S1–3
Acknowledgments
Author contributions: AJB conceived of the study. AJB and JTD designed the experiment and JTD carried out the analysis. RT and TD offered critical guidance in the statistical analyses and biological evaluation, respectively. Funding: This study was supported by the Lucile Packard Foundation for Children's Health, National Institute of General Medical Science (R01 GM079719), National Library of Medicine (K22 LM008261), Howard Hughes Medical Institute, and Pharmaceutical Research and Manufacturers of America Foundation.
Footnotes
AJB is or has served as a scientific advisor and/or consultant to NuMedii, Genstruct, Prevendia, Tercica, Eli Lilly and Company, and Johnson and Johnson.
References
- Anonymous (2002) Microarray standards at last. Nature 419: 323. [DOI] [PubMed] [Google Scholar]
- Alizadeh AA, Eisen MB, Davis RE, Ma C, Lossos IS, Rosenwald A, Boldrick JC, Sabet H, Tran T, Yu X, Powell JI, Yang L, Marti GE, Moore T, Hudson J Jr, Lu L, Lewis DB, Tibshirani R, Sherlock G, Chan WC et al. (2000) Distinct types of diffuse large B-cell lymphoma identified by gene expression profiling. Nature 403: 503–511 [DOI] [PubMed] [Google Scholar]
- Bansal P, Wang Q (2008) Insulin as a physiological modulator of glucagon secretion. Am J Physiol 295: E751–E761 [DOI] [PubMed] [Google Scholar]
- Bild AH, Yao G, Chang JT, Wang Q, Potti A, Chasse D, Joshi MB, Harpole D, Lancaster JM, Berchuck A, Olson JA Jr, Marks JR, Dressman HK, West M, Nevins JR (2006) Oncogenic pathway signatures in human cancers as a guide to targeted therapies. Nature 439: 353–357 [DOI] [PubMed] [Google Scholar]
- Bodenreider O (2004) The Unified Medical Language System (UMLS): integrating biomedical terminology. Nucleic Acids Res 32: D267–D270 [DOI] [PMC free article] [PubMed] [Google Scholar]
- Breitling R, Armengaud P, Amtmann A, Herzyk P (2004) Rank products: a simple, yet powerful, new method to detect differentially regulated genes in replicated microarray experiments. FEBS Lett 573: 83–92 [DOI] [PubMed] [Google Scholar]
- Butte AJ, Chen R (2006) Finding disease-related genomic experiments within an international repository: first steps in translational bioinformatics. AMIA Annu Symp Proc 106–110 [PMC free article] [PubMed] [Google Scholar]
- Chen R, Li L, Butte AJ (2007) AILUN: reannotating gene expression data automatically. Nat Methods 4: 879. [DOI] [PMC free article] [PubMed] [Google Scholar]
- Choi H, Shen R, Chinnaiyan AM, Ghosh D (2007) A latent variable approach for meta-analysis of gene expression data from multiple microarray experiments. BMC Bioinformatics 8: 364. [DOI] [PMC free article] [PubMed] [Google Scholar]
- Dobrin R, Zhu J, Molony C, Argman C, Parrish ME, Carlson S, Allan MF, Pomp D, Schadt EE (2009) Multi-tissue coexpression networks reveal unexpected subnetworks associated with disease. Genome Biol 10: R55. [DOI] [PMC free article] [PubMed] [Google Scholar]
- Dudley J, Butte AJ (2008) Enabling integrative genomic analysis of high-impact human diseases through text mining. Pac Symp Biocomput 580–591 [PMC free article] [PubMed] [Google Scholar]
- Dudley JT, Butte AJ (2009) Identification of discriminating biomarkers for human disease using integrative network biology. Pac Symp Biocomput 27–38 [PMC free article] [PubMed] [Google Scholar]
- English SB, Butte AJ (2007) Evaluation and integration of 49 genome-wide experiments and the prediction of previously unknown obesity-related genes. Bioinformatics 23: 2910–2917 [DOI] [PMC free article] [PubMed] [Google Scholar]
- Golub TR, Slonim DK, Tamayo P, Huard C, Gaasenbeek M, Mesirov JP, Coller H, Loh ML, Downing JR, Caligiuri MA, Bloomfield CD, Lander ES (1999) Molecular classification of cancer: class discovery and class prediction by gene expression monitoring. Science 286: 531–537 [DOI] [PubMed] [Google Scholar]
- Huttenhower C, Hibbs M, Myers C, Troyanskaya OG (2006) A scalable method for integration and functional analysis of multiple microarray datasets. Bioinformatics 22: 2890–2897 [DOI] [PubMed] [Google Scholar]
- Irizarry RA, Warren D, Spencer F, Kim IF, Biswal S, Frank BC, Gabrielson E, Garcia JG, Geoghegan J, Germino G, Griffin C, Hilmer SC, Hoffman E, Jedlicka AE, Kawasaki E, Martínez-Murillo F, Morsberger L, Lee H, Petersen D, Quackenbush J et al. (2005) Multiple-laboratory comparison of microarray platforms. Nat Methods 2: 345–350 [DOI] [PubMed] [Google Scholar]
- Kettritz R, Goebel U, Fiebeler A, Schneider W, Luft F (2006) The protean face of sarcoidosis revisited. Nephrol Dial Transplant 21: 2690–2694 [DOI] [PubMed] [Google Scholar]
- Kilpinen S, Autio R, Ojala K, Iljin K, Bucher E, Sara H, Pisto T, Saarela M, Skotheim RI, Bjorkman M, Mpindi JP, Haapa-Paananen S, Vainio P, Edgren H, Wolf M, Astola J, Nees M, Hautaniemi S, Kallioniemi O (2008) Systematic bioinformatic analysis of expression levels of 17,330 human genes across 9,783 samples from 175 types of healthy and pathological tissues. Genome Biol 9: R139. [DOI] [PMC free article] [PubMed] [Google Scholar]
- Lamb J, Crawford ED, Peck D, Modell JW, Blat IC, Wrobel MJ, Lerner J, Brunet JP, Subramanian A, Ross KN, Reich M, Hieronymus H, Wei G, Armstrong SA, Haggarty SJ, Clemons PA, Wei R, Carr SA, Lander ES, Golub TR (2006) The Connectivity Map: using gene-expression signatures to connect small molecules, genes, and disease. Science 313: 1929–1935 [DOI] [PubMed] [Google Scholar]
- Lipshutz RJ, Morris D, Chee M, Hubbell E, Kozal MJ, Shah N, Shen N, Yang R, Fodor SP (1995) Using oligonucleotide probe arrays to access genetic diversity. Biotechniques 19: 442–447 [PubMed] [Google Scholar]
- Nunes H, Bouvry D, Soler P, Valeyre D (2007) Sarcoidosis. Orphanet J Rare Dis 2: 46. [DOI] [PMC free article] [PubMed] [Google Scholar]
- Parkinson H, Kapushesky M, Kolesnikov N, Rustici G, Shojatalab M, Abeygunawardena N, Berube H, Dylag M, Emam I, Farne A, Holloway E, Lukk M, Malone J, Mani R, Pilicheva E, Rayner TF, Rezwan F, Sharma A, Williams E, Bradley XZ et al. (2009) ArrayExpress update—from an archive of functional genomics experiments to the atlas of gene expression. Nucleic Acids Res 37: D868–D872 [DOI] [PMC free article] [PubMed] [Google Scholar]
- Pihur V, Datta S, Datta S (2008) Finding common genes in multiple cancer types through meta-analysis of microarray experiments: a rank aggregation approach. Genomics 92: 400–403 [DOI] [PubMed] [Google Scholar]
- Ramaswamy S, Ross KN, Lander ES, Golub TR (2003) A molecular signature of metastasis in primary solid tumors. Nat Genet 33: 49–54 [DOI] [PubMed] [Google Scholar]
- Rhodes DR, Chinnaiyan AM (2005) Integrative analysis of the cancer transcriptome. Nat Genet 37: S31–S37 [DOI] [PubMed] [Google Scholar]
- Rhodes DR, Yu J, Shanker K, Deshpande N, Varambally R, Ghosh D, Barrette T, Pandey A, Chinnaiyan AM (2004) Large-scale meta-analysis of cancer microarray data identifies common transcriptional profiles of neoplastic transformation and progression. Proc Natl Acad Sci USA 101: 9309–9314 [DOI] [PMC free article] [PubMed] [Google Scholar]
- Schena M, Shalon D, Davis RW, Brown PO (1995) Quantitative monitoring of gene expression patterns with a complementary DNA microarray. Science 270: 467–470 [DOI] [PubMed] [Google Scholar]
- Segal E, Friedman N, Koller D, Regev A (2004) A module map showing conditional activity of expression modules in cancer. Nat Genet 36: 1090–1098 [DOI] [PubMed] [Google Scholar]
- Shi L, Reid LH, Jones WD, Shippy R, Warrington JA, Baker SC, Collins PJ, de Longueville F, Kawasaki ES, Lee KY, Luo Y, Sun YA, Willey JM, Setterquist RA, Fischer GM, Tong W, Dragan YP, Dix DJ, Frueh FW, Goodsaid FM et al. (2006) The MicroArray Quality Control (MAQC) project shows inter- and intraplatform reproducibility of gene expression measurements. Nat Biotechnol 24: 1151–1161 [DOI] [PMC free article] [PubMed] [Google Scholar]
- Shyamsundar R, Kim YH, Higgins JP, Montgomery K, Jorden M, Sethuraman A, van de Rijn M, Botstein D, Brown PO, Pollack JR (2005) A DNA microarray survey of gene expression in normal human tissues. Genome Biol 6: R22. [DOI] [PMC free article] [PubMed] [Google Scholar]
- Weigelt B, Horlings HM, Kreike B, Hayes MM, Hauptmann M, Wessels LF, de Jong D, Van de Vijver MJ, Van't Veer LJ, Peterse JL (2008) Refinement of breast cancer classification by molecular characterization of histological special types. J Pathol 216: 141–150 [DOI] [PubMed] [Google Scholar]
- Wheeler DL, Barrett T, Benson DA, Bryant SH, Canese K, Chetvernin V, Church DM, DiCuccio M, Edgar R, Federhen S, Geer LY, Helmberg W, Kapustin Y, Kenton DL, Khovayko O, Lipman DJ, Madden TL, Maglott DR, Ostell J, Pruitt KD et al. (2006) Database resources of the National Center for Biotechnology Information. Nucleic Acids Res 34: D173–D180 [DOI] [PMC free article] [PubMed] [Google Scholar]
- Whitehead A, Crawford DL (2005) Variation in tissue-specific gene expression among natural populations. Genome Biol 6: R13. [DOI] [PMC free article] [PubMed] [Google Scholar]
- Wirapati P, Sotiriou C, Kunkel S, Farmer P, Pradervand S, Haibe-Kains B, Desmedt C, Ignatiadis M, Sengstag T, Schutz F, Goldstein DR, Piccart M, Delorenzi M (2008) Meta-analysis of gene expression profiles in breast cancer: toward a unified understanding of breast cancer subtyping and prognosis signatures. Breast Cancer Res 10: R65. [DOI] [PMC free article] [PubMed] [Google Scholar]
- Yano W, Kubota N, Itoh S, Kubota T, Awazawa M, Moroi M, Sugi K, Takamoto I, Ogata H, Tokuyama K, Noda T, Terauchi Y, Ueki K, Kadowaki T (2008) Molecular mechanism of moderate insulin resistance in adiponectin-knockout mice. Endocr J 55: 515–522 [DOI] [PubMed] [Google Scholar]
- Zilliox MJ, Irizarry RA (2007) A gene expression bar code for microarray data. Nat Methods 4: 911–913 [DOI] [PMC free article] [PubMed] [Google Scholar]
Associated Data
This section collects any data citations, data availability statements, or supplementary materials included in this article.
Supplementary Materials
Supplementary Materials and Methods, Supplementary table S1, Supplementary figures S1–3