Abstract
Objective
To examine the relationship between the ratio of injected current to electrode area (I/A) and the current density at a fixed target point in the brain under the electrode during transcranial direct current stimulation (tDCS).
Methods
Numerical methods were used to calculate the current density distribution in a standard spherical head model as well as in a homogeneous cylindrical conductor.
Results
The calculations using the cylindrical model showed that, for the same I/A ratio, the current density at a fixed depth under the electrode was lower for the smaller of the two electrodes. Using the spherical model, the current density at a fixed target point in the brain under the electrode was found to be a non-linear function of the I/A ratio. For smaller electrodes, more current than predicted by the I/A ratio was required to achieve a predetermined current density in the brain.
Conclusions
A non-linear relationship exists between the injected current, the electrode area and the current density at a fixed target point in the brain, which can be described in terms of a montage-specific I–A curve.
Significance
I-A curves calculated using realistic head models or obtained experimentally should be used when adjusting the current for different electrode sizes or when comparing the effect of different current - electrode area combinations.
Keywords: Stimulation, electric, current density, direct current, polarization, transcranial, tDCS
Introduction
The application of a weak DC current through electrodes on the scalp, commonly referred to as transcranial direct current stimulation or tDCS, has been shown to be able to modulate cortical excitability in an effective and reproducible manner (Priori et al., 1998; Nitsche and Paulus, 2000; Nitsche et al., 2005). All safety studies carried out so far indicate that the application of a current with an intensity of 1 mA for periods up to 20 min using electrodes whose area is about 25–35 cm2 has no significant adverse effects (Nitsche et al., 2003; Iyer et al., 2005; Poreisz et al., 2007). Because it is considered safe and it is well tolerated, easy to apply and inexpensive, tDCS has already been used in a large number of studies. An overview of recent tDCS experiments and methodological issues is presented in (Nitsche et al., 2008).
An assumption that is often made in tDCS studies is that the ratio of the injected current to the electrode area (I/A) determines the magnitude of the stimulation effect. This assumption is implicitly made when the I/A ratio is used to specify and compare stimulation intensities, as it is currently done. In a recent study, Nitsche et al. (Nitsche et al., 2007) clearly demonstrated that a reduction in electrode area can increase the focality of tDCS whereas an increase in electrode area can render that electrode functionally ineffective. In this case too, the underlying assumption was that by keeping the I/A ratio constant while varying current intensity and electrode area, the effect in the brain was the same.
Given the widespread use of this assumption and its implications in terms of protocol design, interpretation of experimental results and safety, we sought to determine its validity on physical grounds. We assumed that the current density at the target location in the brain is a fundamental factor in determining stimulation efficacy. Other factors such as neuron orientation relative to the applied electric field, neuronal electrophysiological properties, neural network properties, etc. also play a critical role in determining the outcome of stimulation. Thus, knowing the current density distribution in the brain is a necessary, but not sufficient, condition to predict tDCS efficacy. In this paper, we address only aspects related to the current density distribution.
Methods
The current density is a vector function, , defined at every point in a conductive medium, whose direction is that of the current flow at the point under consideration and whose magnitude is given by the current divided by the area perpendicular to the flow, as this area tends to zero. The current density is obtained from the electric field, , by means of the relation , where σ is the electric conductivity of the tissue. In turn, the electric field is determined by the spatial rate of change (gradient) of the electric potential, ϕ, i.e. . Finally, the potential inside the conductive medium is obtained by solving the continuity equation, ∇·(σ∇ϕ) = 0, subject to the appropriate boundary conditions.
Following the approach outlined above, we calculated the current density distribution in two different volume conductors for various electrode configurations, using a finite element package (Comsol 3.3 with AC/DC module, http://www.comsol.com) to solve the continuity equation numerically. Electrodes were modeled as square sponges, 1 cm thick and with an electrical conductivity taken to be equal to that of the scalp, σ = 0.332 S/m. The only exception was the 100 cm2 electrode, whose dimensions were 16.9×5.9 cm2. The upper surfaces of the two electrodes were set to uniform electric potentials, and the potential difference was chosen so that the total injected current was equal to the desired value, e.g., 1 mA. The method is described in more detail in (Miranda et al., 2006).
In both models the target point was located 12 mm below the electrode – conductor interface, under the electrode’s center. This distance corresponds to the scalp-brain distance in the spherical model.
In the first model, one square electrode was placed centrally on the upper base of a homogeneous cylindrical conductor (σ = 0.332 S/m) and an identical electrode was placed symmetrically on the lower base. The current density distribution is shown in a plane that passes through the center of the electrode and contains the axis of the cylinder. Only the upper half of the distribution is shown, as the lower half is the reflection of the upper half. The purpose of these calculations was to investigate the effect of electrode size on the current density distribution, without the confounding effects of tissue geometry and heterogeneity.
In the second model, two electrodes were placed on a standard 3-layer spherical head model with rscalp = 9.2 cm, rskull = 8.5 cm, rbrain = 8.0 cm (Rush and Driscoll, 1969) and slightly different conductivities, σscalp = σbrain = 0.332 S/m, σbrain /σskull = 40 (Goncalves et al., 2003). One electrode was placed over the motor cortex and the other over the contralateral eyebrow. For convenience, the first electrode will be referred to as the “stimulation” electrode and the second one as the “reference” electrode, even though such terms do not necessarily reflect their effective roles (Nitsche et al., 2007). Either electrode can be the anode or the cathode; this choice affects only the direction of the current in the head, not its magnitude. Three different sets of calculations were performed to investigate the effect of electrode size on the current density distribution in the brain, taking into account tissue heterogeneity.
In the first set of calculations, the area of the reference electrode was fixed at 35 cm2 while the area of the stimulation electrode and the injected current were varied in such a way as to keep I/A constant at 1/35 mA/cm2. The magnitude of the current density at the target point below the stimulation electrode is reported.
In the second set of calculations, the area of the stimulation electrode and the injected current were kept constant at 35 cm2 and 1 mA, respectively, as the area of the reference electrode was varied. The magnitude of the current density at the target point below the reference electrode is reported.
In the third set, the area of the reference electrode was fixed at 35 cm2 while the area of the stimulation electrode was varied. The injected current was adjusted so as to fix the density at the target point at a constant value, 0.0087 mA/cm2, which is equal to its value when the area of both electrodes is equal to 35 cm2 and the injected current is 1 mA. The intensity of the current injected into the electrode is reported.
Results
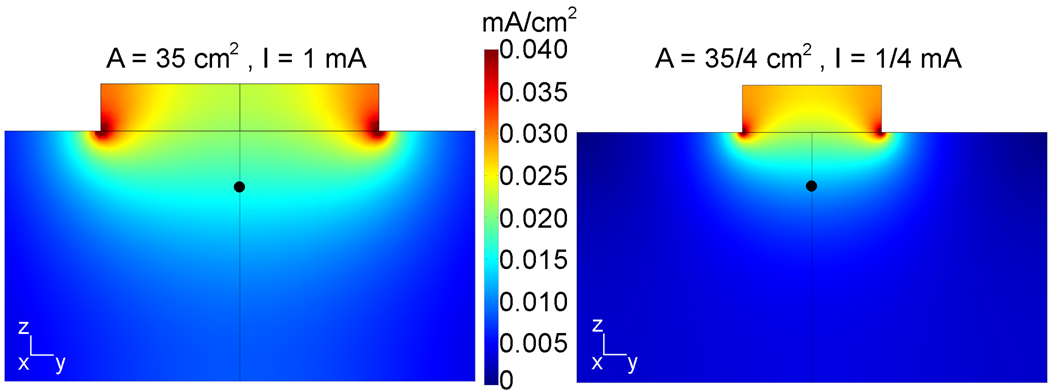
For the cylindrical conductor, the current density distribution was calculated for a pair of square electrodes with an area of 35 cm2 each and an injected current of 1 mA (fig.1, left) and for a pair of electrodes with an area of 35/4 cm2 each and an injected current of 1/4 mA (fig. 1, right). In both cases I/A = 1/35 mA/cm2. The magnitude of the current density at the target point is 0.016 mA/cm2 under the larger electrode and 0.011 mA/cm2 under the smaller electrode. The color scale is common to both plots and is maximal at 0.040 mA/cm2 to facilitate the visual comparison of the current density near the target point. The current density near the electrode edges in contact with the cylinder reached values higher than this, up to 0.086 mA/cm2, and they are all shown as dark red. When the current injected into an electrode was doubled, then the current density distribution remained the same but its magnitude is doubled everywhere in the conducting volume, independently of electrode size (not shown). Similar plots for the current density distribution in a spherical model of tDCS of the motor cortex can be found in (Miranda et al., 2006).
Fig. 1.
Effect of decreasing the electrode area on the current density distribution whilst maintaining a constant I/A ratio. At a target point at fixed depth of 12 mm (black dot), the current density is lower for the smaller electrode.
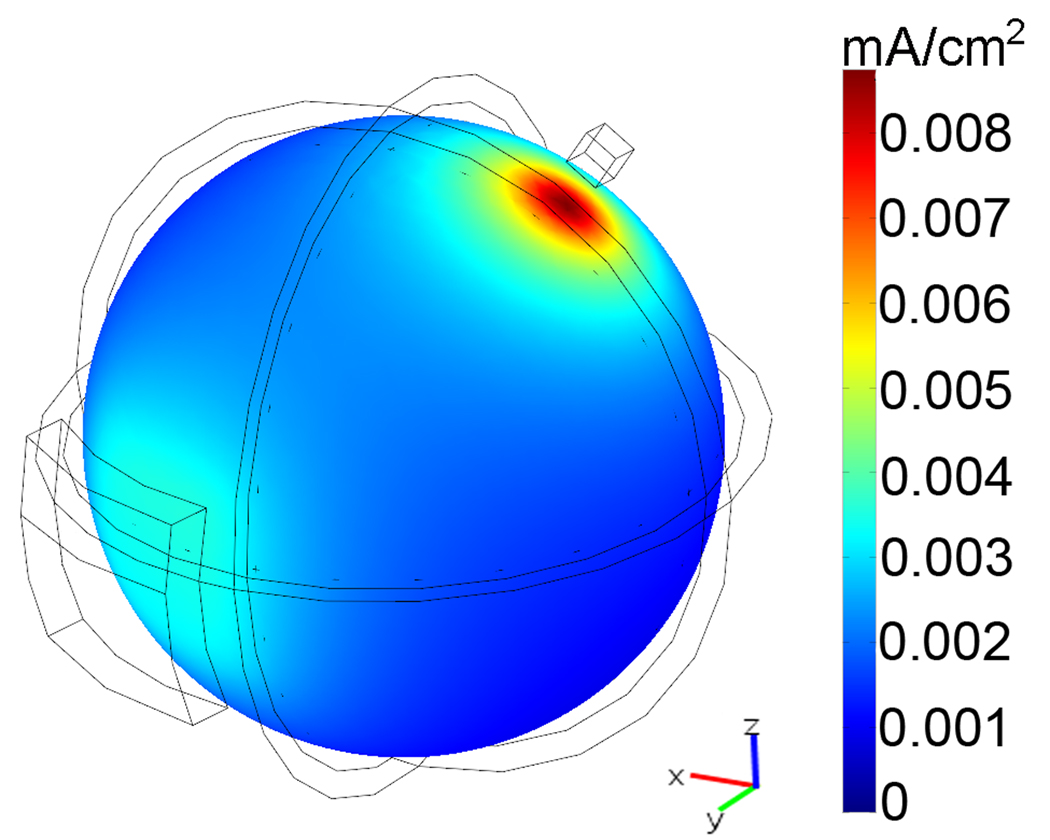
The spherical head model used in this study is shown in fig. 2, with a 1 cm2 electrode over the motor cortex and a 35cm2 electrode over the right eyebrow. The color plot shows the magnitude of the current density on the brain surface. The current was set to 0.39 mA, resulting in a current density of 0.0087 mA/cm2 under the center of the small electrode and 0.0034 mA/cm2 under the center of the large one.
Fig. 2.
Current density magnitude on the brain surface of a spherical head model. A current of 0.39 mA was injected into a 1 cm2 electrode placed over the motor cortex, resulting in a current density of 0.0087 mA/cm2 at the target point.
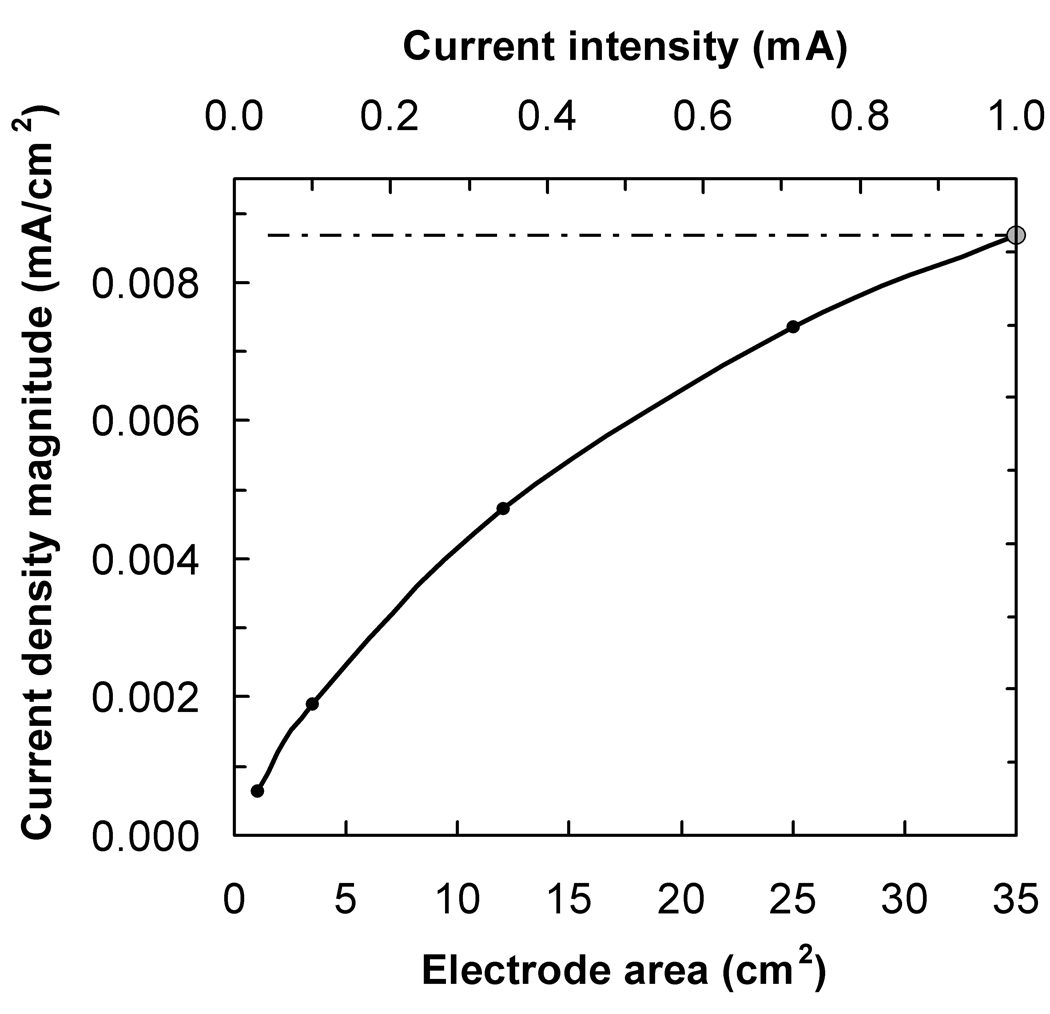
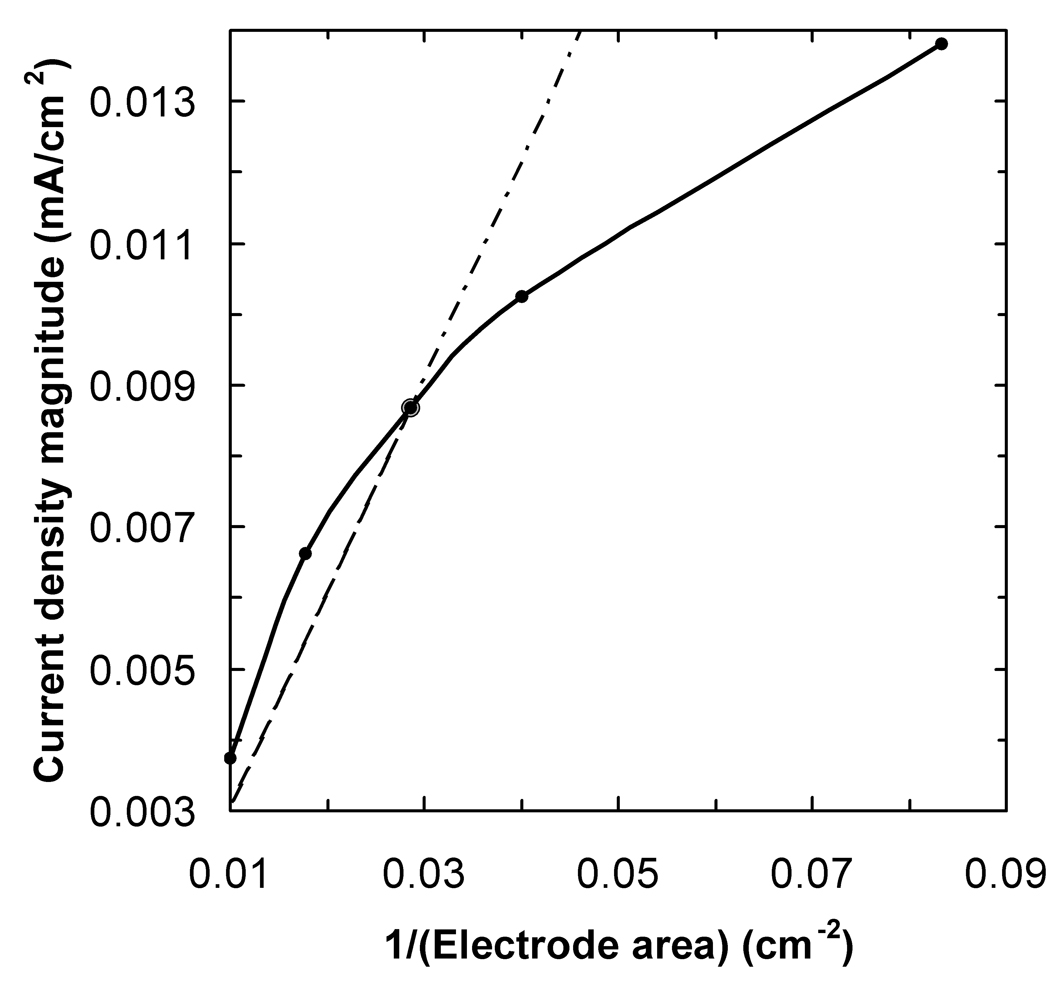
The results for the spherical head model are shown in fig. 3 and fig. 4. The plot in fig. 3a shows how the current density at the target point, on the brain surface under the center of the stimulation electrode, varied as the electrode area was decreased and the injected current adjusted so as to keep I/A constant and equal to 1/35 mA/cm2 (solid line). The expectation, according to the constant I/A rule, was that the current density at the target point would remain constant and equal to its value for I = 1 mA and A = 35 cm2, which in this model was 0.0087 mA/cm2 (dotted line). In fact, the current density dropped to 85% and 22 % of this reference value as the electrode area was decreased from 35 cm2 to 25 cm2 and 3.5 cm2, respectively. The plot in fig. 3b shows the variation of the current density at the target point under the reference electrode as the electrode area was increased, and the injected current was kept fixed at 1 mA (solid line). Since the current intensity was kept constant, the expectation was that the current density at the target point would decrease linearly with 1/A (dotted line). The decrease was slower than predicted: when the electrode area was increased from 35 cm2 (1/A = 0.029 cm−2) to 100 cm2, (1/A = 0.010 cm−2) the current density was calculated to decrease by a factor of 0.43 only, instead of 0.35. In both plots, the data-point represented by a larger circle corresponds to the standard configuration: a current intensity of 1 mA and two 35 cm2 electrodes.
Fig. 3.
The magnitude of the current density, in mA/cm2, at the target point located 12 mm below the electrode center as a function of a) stimulation electrode area, keeping I/A constant; b) the inverse of the reference electrode area, keeping the current constant at 1 mA. The dotted lines show the behavior expected if a constant I/A ratio implied a constant current density at the target point
Fig 4.
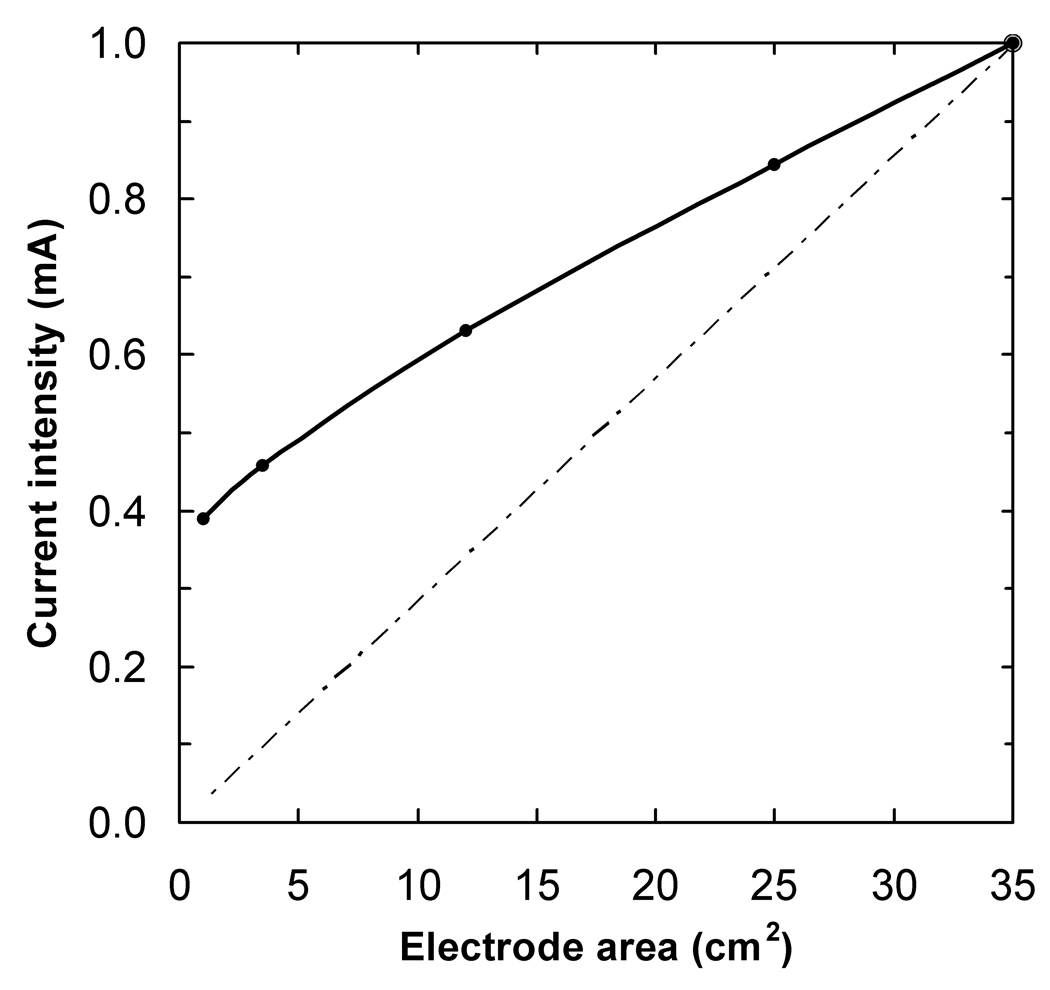
The current, in mA, that must be injected into the stimulation electrode in order to achieve a constant current density at the target point 12 mm below its center, as a function of electrode area. The calculations were based on a spherical head model. The dotted line has the same meaning as in fig. 3.
Figure 4 shows how the current injected into the stimulation electrode had to be adjusted as a function of electrode area in order to achieve a constant current density at the target point (solid line). The expected behavior was that the required current would decrease linearly with electrode area (dotted line). According to these calculations, more current than that predicted by the I/A ratio has to be injected into electrodes smaller than 35 cm2 in order to guarantee a constant current density in the brain. To a good approximation, points on the solid curve can be calculated using the equation I = 6.00×10⁻⁶ A3 −4.61×10⁻⁴ A2 + 2.69×10⁻² A + 0.366, where I is the current in mA and A is the electrode area in cm2 and the 4 constants have units of mA /cm6, mA /cm4, mA /cm2, and mA respectively.
Discussion
The calculations performed using the cylindrical model confirmed that, for a fixed electrode montage with fixed electrode sizes, a change in the injected current results in a proportional change in the current density at every point in the volume conductor. This is consistent with the observations reported by Nitsche and Paulus (Nitsche and Paulus, 2000). However, when considering a target point at a fixed depth below the electrode, the current density at that point was not constant as the electrode area was varied and the injected current adjusted so as to keep the I/A ratio constant. In general, the current density at a fixed depth below the centre of the electrode will always be less for a smaller electrode when the I/A ratio is kept constant. The localized increase in current density that is visible in fig. 1 near the edges of the electrode in contact with the cylinder is due to edge effects; such effects occur whenever the cross-section for current flow changes.
The variation of the current density with electrode area and current intensity can be described in simple terms only when either very close to or very far from the electrode. Very near the electrode, and in the absence of significant edge effects, the current density is given by I/A. Very far from the electrode, the electrode is effectively a point electrode and the current density is proportional to I and independent of A. For intermediate distances, there is no simple relationship between these three quantities. The existence of significant edge effects, and of tissue heterogeneity in more complex models, further complicates this relationship. Given the highly symmetric geometry shown in fig. 1, the current density plot on the right is very similar to the plot on the left scaled down by a factor of ½. This is because the linear dimension of the electrode was reduced by ½ and the injected current has been reduced by a factor of ¼. Thus the current density values are very similar on both plots but their spatial distribution is very different. The point on the right plot where the current density is the same as the reference point on the left plot is located at about half the reference depth. This explains why keeping I/A constant results in a reduced current density at a fixed depth.
The calculations performed using the spherical head model also showed that the current density at a fixed target point below the stimulation electrode and for a fixed value of the I/A ratio was not constant: it decreased non-linearly as the stimulation electrode area decreased (fig. 3a). This is consistent with the conclusions drawn in the previous paragraph. Also, the current density at a fixed target point below the reference electrode and for a fixed value of the injected current did not decrease as the inverse of the reference electrode area: it decreased more slowly, i.e.doubling the area of the reference electrode reduced the current density at the target point by less than a factor of 2 (fig. 3b).
The I/A ratio will systematically overestimate the current density in the brain when used to compute current values for smaller electrodes and underestimate it when applied to larger electrodes. In other words, for a constant current density at a target point in the brain more current should be injected into smaller electrodes and less current into larger electrodes than predicted by the I/A ratio. This difference is less pronounced for larger electrodes than for smaller ones, which suggests that increasing electrode size may indeed be a practical way to render the reference electrode functionally ineffective (cf. fig. 2).
The data presented in fig. 4 provides an alternative way of determining the current that should be used for a range of electrode areas, in order to achieve the same current density in the motor cortex under a smaller electrode as under the standard arrangement (1 mA into 35 cm2). The accuracy of these data is limited by several assumptions that were built into the model, such as the layered spherical geometry and the conductivity values used. However, since we are only calculating ratios (e.g., by what factor should the current be reduced when the electrode area is halved) as opposed to absolute values (e.g., what is the current density value at the target point), the results should not depend too strongly on those assumptions. We will refer to this type of data as the I–A curve.
The I–A curve in fig. 4 was obtained for a specific electrode montage. It may hold to a good approximation for other electrode montages where the distance between electrodes centers is similar to the one used in this model, 18.8 cm measured on the scalp. Also, the current intensities reported in fig. 4 will scale linearly with the current injected into the 35 cm2 electrode. For example, if the aim were to achieve the same current density in the brain as would be achieved by injecting 2 mA into a 35 cm2 electrode, then the currents in fig. 4 should be doubled.
The use of more realistic head models based on MR images will provide more accurate I–A curves, which may even be subject-specific. An additional advantage of having realistic head models where the inner and outer cortical surfaces are faithfully represented is that the effect of the orientation of neural cells relative to the applied electric field can be taken into account, since the orientation of these cells is known be predominantly either perpendicular or parallel to the cortical surfaces (Silva et al., 2008).
It may be possible to obtain the I–A curves experimentally. The effect of the application of 1 mA into a 35 cm2 electrode placed over the motor cortex for a fixed duration can be quantified in the usual way, as a shift in cortical excitability measured as a change in the amplitude of the EMG response to a TMS stimulus of fixed intensity relative to the motor threshold. Then, for a range of smaller electrodes centered over exactly the same point on the scalp, the current should be adjusted until the same shift in cortical excitability is attained1. As the electrode area increases, the point where the magnitude of the current density is largest on the brain surface moves away from the center of the electrode in the direction of the other electrode. For a 35 cm2 stimulation electrode and the montage used here, this shift may reach about 15 mm but the current density at the new maximum is only about 2% higher than under the center of the electrode. Thus, a clear departure from the linear behavior predicted by the I/A ratio should be easily observed. Experimental validation of I–A curves, such as the one shown in fig.4, should be attempted before they are used clinically. Experimental data will also provide an indication of the inter-individual variability of the I–A curves.
We have shown that a non-linear relationship exists between the injected current and the electrode area when keeping the current density constant at a fixed target point in the brain, and that this relationship can be described in terms of a montage-specific I–A curve. I–A curves calculated using realistic head models or obtained experimentally should be used when adjusting the current for electrodes of different sizes or when comparing the effect of different current - electrode area combinations. These curves may be particularly useful when adjusting the current intensity correctly for smaller electrodes, as their use is likely to increase in the future, either to improve focality or as part of more versatile multi-electrode systems.
Acknowledgements
This work was supported in part by the NIH Intramural Program, USA, and by the Foundation for Science and Technology (FCT), Portugal. Paula Faria gratefully acknowledges the support of FCT under Grant SFRH/BD/29020/2006.
Footnotes
Publisher's Disclaimer: This is a PDF file of an unedited manuscript that has been accepted for publication. As a service to our customers we are providing this early version of the manuscript. The manuscript will undergo copyediting, typesetting, and review of the resulting proof before it is published in its final citable form. Please note that during the production process errors may be discovered which could affect the content, and all legal disclaimers that apply to the journal pertain.
A similar procedure may also be used to normalize tDCS intensity across subjects if standard stimulation conditions are defined in terms of electrode placement, shape and area, and of stimulus duration. Then, the stimulation current is adjusted so as to produce a standard percent increase in the amplitude of the EMG response to TMS at a standard value above motor threshold. This procedure would probably have the same advantages and limitations as the definition of a motor threshold in TMS.
References
- Goncalves SI, de Munck JC, Verbunt JP, Bijma F, Heethaar RM, Lopes da Silva FH. In vivo measurement of the brain and skull resistivities using an EIT-based method and realistic models for the head. IEEE Trans Biomed Eng. 2003;50:754–767. doi: 10.1109/tbme.2003.812164. [DOI] [PubMed] [Google Scholar]
- Iyer MB, Mattu U, Grafman J, Lomarev M, Sato S, Wassermann EM. Safety and cognitive effect of frontal DC brain polarization in healthy individuals. Neurology. 2005;64:872–875. doi: 10.1212/01.WNL.0000152986.07469.E9. [DOI] [PubMed] [Google Scholar]
- Miranda PC, Lomarev M, Hallett M. Modeling the current distribution during transcranial direct current stimulation. Clin Neurophysiol. 2006;117:1623–1629. doi: 10.1016/j.clinph.2006.04.009. [DOI] [PubMed] [Google Scholar]
- Nitsche MA, Paulus W. Excitability changes induced in the human motor cortex by weak transcranial direct current stimulation. J Physiol. 2000;527(Pt 3):633–639. doi: 10.1111/j.1469-7793.2000.t01-1-00633.x. [DOI] [PMC free article] [PubMed] [Google Scholar]
- Nitsche MA, Fricke K, Henschke U, Schlitterlau A, Liebetanz D, Lang N, Henning S, Tergau F, Paulus W. Pharmacological modulation of cortical excitability shifts induced by transcranial direct current stimulation in humans. J Physiol. 2003;553:293–301. doi: 10.1113/jphysiol.2003.049916. [DOI] [PMC free article] [PubMed] [Google Scholar]
- Nitsche MA, Seeber A, Frommann K, Klein CC, Rochford C, Nitsche MS, Fricke K, Liebetanz D, Lang N, Antal A, Paulus W, Tergau F. Modulating parameters of excitability during and after transcranial direct current stimulation of the human motor cortex. J Physiol. 2005;568:291–303. doi: 10.1113/jphysiol.2005.092429. [DOI] [PMC free article] [PubMed] [Google Scholar]
- Nitsche MA, Doemkes S, Karakose T, Antal A, Liebetanz D, Lang N, Tergau F, Paulus W. Shaping the effects of transcranial direct current stimulation of the human motor cortex. J Neurophysiol. 2007;97:3109–3117. doi: 10.1152/jn.01312.2006. [DOI] [PubMed] [Google Scholar]
- Nitsche MA, Cohen LG, Wassermann EM, Priori A, Lang N, Antal A, Paulus W, Hummel F, Boggio PS, Fregni F, Pascual-Leone A. Transcranial direct current stimulation: State of the art 2008. Brain Stim. 2008;1:206–223. doi: 10.1016/j.brs.2008.06.004. [DOI] [PubMed] [Google Scholar]
- Poreisz C, Boros K, Antal A, Paulus W. Safety aspects of transcranial direct current stimulation concerning healthy subjects and patients. Brain Res Bull. 2007;72:208–214. doi: 10.1016/j.brainresbull.2007.01.004. [DOI] [PubMed] [Google Scholar]
- Priori A, Berardelli A, Rona S, Accornero N, Manfredi M. Polarization of the human motor cortex through the scalp. Neuroreport. 1998;9:2257–2260. doi: 10.1097/00001756-199807130-00020. [DOI] [PubMed] [Google Scholar]
- Rush S, Driscoll DA. EEG electrode sensitivity - an application of reciprocity. IEEE Trans Biomed Eng. 1969;16:15–22. doi: 10.1109/tbme.1969.4502598. [DOI] [PubMed] [Google Scholar]
- Silva S, Basser PJ, Miranda PC. Elucidating the mechanisms and loci of neuronal excitation by transcranial magnetic stimulation using a finite element model of a cortical sulcus. Clin Neurophysiol. 2008;119:2405–2413. doi: 10.1016/j.clinph.2008.07.248. [DOI] [PMC free article] [PubMed] [Google Scholar]


