

Abstract
Ptf1a, along with an E protein and Rbpj, forms the transcription factor complex PTF1-J that is essential for proper specification of inhibitory neurons in the spinal cord, retina, and cerebellum. Here we show that two highly conserved noncoding genomic regions, a distal 2.3 kb sequence located 13.4 kb 5′ and a 12.4 kb sequence located immediately 3′ of the Ptf1a coding region, have distinct activity in controlling Ptf1a expression in all of these domains. The 5′ 2.3 kb sequence functions as an autoregulatory element and directs reporter gene expression to all Ptf1a domains in the developing nervous system. The autoregulatory activity of this element was demonstrated by binding of the PTF1-J complex in vitro, Ptf1a localization to this genomic region in vivo, and the in vivo requirement of Ptf1a for the activity of the regulatory element in transgenic mice. In contrast, the 12.4 kb 3′ regulatory region does not contain any conserved PTF1 sites, and its expression in transgenic mice is independent of Ptf1a. Thus, regulatory information for initiation of Ptf1a expression in the developing nervous system is located within the 12.4 kb sequence 3′ of the Ptf1a gene. Together, these results identify multiple transcriptional mechanisms that control Ptf1a levels, one modulating levels by autoregulation through the PTF1-J complex, and the other a Ptf1a-independent mechanism for initial activation.
Introduction
A delicate equilibrium between excitatory and inhibitory neurons is critical for proper nervous system function, and disruption of this balance has been implicated as a cause of pain disorders, epilepsy, and even psychiatric disorders such as schizophrenia (Fields et al., 1991; McCormick and Contreras, 2001; Berry et al., 2003). Ptf1a plays a critical role in establishing this balance by promoting GABAergic (inhibitory) cell fates in several regions of the developing nervous system (Glasgow et al., 2005; Hoshino et al., 2005; Fujitani et al., 2006). Furthermore, disruption of Ptf1a leads to cerebellar and pancreatic agenesis, respiratory dysfunction, and neonatal lethality in both mice and humans (Krapp et al., 1998; Hoveyda et al., 1999; Kawaguchi et al., 2002; Sellick et al., 2004).
Between embryonic day 10 (E10) and E11.5, six dorsal interneuron progenitor domains (dP1-6) are established in the neural tube, and each expresses a specific basic helix–loop–helix (bHLH) transcription factor [for review, see Caspary and Anderson (2003) and Helms and Johnson (2003)]. Ptf1a marks the dP4 population as these cells transition into a postmitotic state and begin to differentiate into mature dI4 interneurons (Glasgow et al., 2005; Mizuguchi et al., 2006). Two additional dorsal interneuron populations, dILA and dILB, are born between E11.5 and E13 (Gross et al., 2002; Müller et al., 2002; Cheng et al., 2004), with Ptf1a marking progenitors to the dILA domain (dPLA) (Glasgow et al., 2005; Mizuguchi et al., 2006; Wildner et al., 2006). Ptf1a expression is transient, however, and disappears as progenitors migrate laterally out of the ventricular zone. In the absence of Ptf1a, both dI4 and dILA populations are lost, resulting in a complete loss of GABAergic neurons in the dorsal horn of the spinal cord (Glasgow et al., 2005). The progenitors to these domains do not undergo apoptosis, but instead switch to a glutamatergic (excitatory) identity, revealing a secondary function for Ptf1a as repressing the glutamatergic specification program. Ptf1a is also expressed in neuronal progenitors in several other regions of the developing CNS. In the cerebellum, Ptf1a is expressed from E12 until shortly after birth in progenitors to Purkinje cells and inhibitory interneurons (Glasgow et al., 2005; Hoshino et al., 2005; Nakhai et al., 2007; Pascual et al., 2007). Ptf1a in the retina is expressed during the same period of time, specifying both amacrine and horizontal cells (Fujitani et al., 2006; Nakhai et al., 2007). As with the neural tube domains, both cerebellar and retinal Ptf1a populations experience a fate switch to excitatory neurons when Ptf1a is lost (Fujitani et al., 2006; Pascual et al., 2007).
Ptf1a is a class II bHLH transcription factor that forms a transcriptional complex (PTF1-J) with an E protein and Rbpj (or Rbpjl to form PTF1-L in the adult pancreas) (Cockell et al., 1989; Krapp et al., 1996; Obata et al., 2001; Beres et al., 2006; Masui et al., 2007). The consensus DNA binding site for the PTF1 complex includes both an E-box (CANNTG) and an Rbpj site (TC-box), and both are required to activate transcription (Cockell et al., 1989; Rose and MacDonald, 1997; Beres et al., 2006). Importantly, it is the PTF1-J trimer, not the Ptf1a/E protein heterodimer, that is essential for function in the developing nervous system and pancreas (Masui et al., 2007; Hori et al., 2008).
Although Ptf1a plays a crucial role in specifying inhibitory neurons in a wide variety of neural structures, the mechanisms controlling its expression remain poorly understood. In this study, we identify two distinct mechanisms regulating Ptf1a expression in the developing nervous system. A 5′ 2.3 kb element directs reporter gene expression to all Ptf1a domains, is Ptf1a-dependent, and is a direct target of the PTF1-J complex. Another element encompassing the 12.4 kb just 3′ of Ptf1a also directs reporter expression to most neural Ptf1a domains; however, this sequence lacks repressive information restricting its activity both temporally and spatially. Unlike the autoregulatory element, the activity of this 3′ enhancer is independent of Ptf1a. Thus, two separable genomic regions code for initiation and positive feedback of Ptf1a expression in the developing nervous system.
Materials and Methods
Description of transgenic constructs.
The 5′ 2.3 kb enhancer region (chr2:19351717-19354014) was cloned into the BgEGFP reporter vector (Lumpkin et al., 2003) to generate 2.3Ptf1a-GFP or a nuclear lacZ reporter gene with the minimal promoter of the rat Ela1 gene to generate 2.3Ptf1a-lacZ (Masui et al., 2008). A PCR-based site-directed mutagenesis strategy was used to generate mutants in each construct. The precise mutations for each E-box and each TC-box are as shown below in the electrophoretic mobility shift assay (EMSA) probes. All constructs were sequenced to establish their integrity. The 13.4Ptf1a5′-lacZ construct contains chr2:19353922-19367481, and the 15.6Ptf1a5′-lacZ construct contains chr2:19351717-19367481 placed 5′ to a lacZ reporter gene (Masui et al., 2008). They contain the natural promoter and transcriptional start from the Ptf1a gene. The 3′ 12.4 kb enhancer region (chr2:19369662-19382088) was cloned into a nuclear mCherry reporter vector (with mCherry replacing EGFP in BgEGFP) to generate 12.4Ptf1a-mCherry or a lacZ reporter gene with the minimal promoter of the rat Ela1 gene to generate 12.4Ptf1a-lacZ (Masui et al., 2008). All transgenes contain the bovine growth hormone 3′ UTR. Chromosome locations were obtained from the mm9 assembly. PTF1 sites within the 2.3 kb and 12.4 kb regions were identified by scanning conserved regions (obtained from BLAT analysis using http://genome.ucsc.edu/cgi-bin/hgBlat) for E-boxes and TC-boxes in close proximity.
Transgenic mice.
Transgenic mice were generated by standard procedures (Brinster et al., 1985) using fertilized eggs from B6SJLF1 (C57BL/6JxSJL) crosses. Each transgene was isolated from the recombinant plasmid on a standard agarose gel and microinjected at 1–3 ng/μl into pronuclei of fertilized eggs by the Transgenic Core Facility of University of Texas Southwestern, Dallas. Transgenic embryos and mice were identified by PCR analysis for lacZ, GFP, or mCherry using yolk sac and tail DNA, respectively. For transient transgenic analysis, embryos were assayed at E10.5 for lacZ expression in whole mount (Verma-Kurvari et al., 1996), and subsequently cryosectioned and counterstained with nuclear fast red. 2.3Ptf1a-GFP and 12.4Ptf1a-mCherry transgenic mouse strains are stable lines. Ptf1aCre (p48Cre) and Ptf1aW298A mutant mouse strains have been previously described (Kawaguchi et al., 2002; Hori et al., 2008). Embryos were staged based on assumed copulation at E0, halfway through the dark cycle.
In ovo chick electroporation. Fertilized White Leghorn eggs were obtained from the Texas A&M Poultry Department and incubated for 3 d at 38°C. Solutions of supercoiled plasmid DNA (1–4 μg/μl) in H2O/1× loading dye were injected into the lumen of the closed neural tube at stages HH15-16, and embryos were electroporated as described previously (Nakada et al., 2004). Myc-tagged Ptf1a, Ascl1, or the inactive mutant of Ascl1 as control (Ascl1AQ) were overexpressed using a pMiWIII expression vector (Nakada et al., 2004; Hori et al., 2008). Embryos were harvested 48 h later at stages HH22-23, fixed with 4% paraformaldehyde for 1 h, and processed as below for cryosectioning and immunofluorescence.
Tissue processing and immunofluorescence.
Mouse embryos at E10.5 and E12.5 were dissected in ice-cold PBS, fixed in 4% paraformaldehyde for 2 h at 4°C, and washed three times in PBS. E14.5 embryos were fixed in 4% paraformaldehyde overnight at 4°C and washed with PBS overnight. Embryos were then sunk in 30% sucrose, embedded in OCT, and cryosectioned at 30 μm. Immunofluorescence was performed with the primary antibodies guinea pig anti-Ptf1a (1:5000; Hori et al., 2008), mouse anti-c-myc (1:1000; Santa Cruz Biotechnology), rabbit anti-Pax2 (1:500; Invitrogen), and guinea pig anti-Tlx3 (1:20,000) (Müller et al., 2005).
EMSAs.
Mouse E12, mouse Ptf1a, and human Rbpj proteins were synthesized in vitro using SP6 and T7 TNT Quick Coupled lysate systems (Promega). TNT lysates were incubated in binding buffer (10 mm HEPES, pH 7.9, 4 mm Tris-HCl, pH 8.0, 80 mm NaCl, 1 mm EDTA, 5% glycerol, 5 mm DTT, 6 μg of BSA, and 2 μg of Poly dI/dC) along with a (γ-32P) end-labeled oligo probe (50,000 cpm) in a total volume of 20 μl for 30°C for 30 min. Reactions were transferred to ice for 15 min before loading. Complexes were separated on a 4.5% polyacrylamide matrix gel at 4°C in 1× TGE. The following oligonucleotides were used as labeled probes in EMSA: proximal (P) PTF1 site: 5′-CCCAGCACATGTGTTATGATTCCCACGGACTG-3′ (top strand); distal (D) PTF1 site: 5′-AGCGGCACAAGTGGCGACATTCCCATGGAGCG-3′ (top strand); E-box mutant of P site: 5′-CCCAGtACtataGTTATGATTCCCACGGACTG-3′ (top strand); E-box mutant of D site: 5′-AGCGGtACtAtaGGCGACATTCCCATGGAGCG-3′ (top strand); TC-box mutant of the P site: 5′-CCCAGCACATGTGTTATGATTCaatCGGACTG-3′ (top strand); and TC-box mutant of the D site: 5′-AGCGGCACAAGTGGCGACATTCtatTGGAGCG-3′ (top strand).
Chromatin immunoprecipitation.
Neural tubes were collected from E11.5 mouse embryos and dissociated in PBS at low speed using an IKA model T8.01 probe blender. Formaldehyde was added to a final concentration of 1%, and dissociated tissue was incubated for 10 min at room temperature. The fixation reaction was stopped by adding glycine to a final concentration of 0.125 m followed by washing twice with PBS. Nuclei were obtained using a CelLytic NuCLEAR Extraction Kit (Sigma). Chromatin was enzymatically sheared to an average length of 800–1000 bp using Active Motif's ChIP-IT Express Kit. ChIP was performed as described previously (Masui et al., 2007) using protein-A agarose beads (Millipore). DNA was purified from each reaction using QIAQuick purification columns (Qiagen) and quantified by qPCR with Fast SYBRGreen mix (ABI). Percentage ChIP efficiency equals 2(Threshold Cycle Input − Threshold Cycle ChIP) × 1/dilution factor × 100. Fold enrichment is shown relative to a control gene Mrps15. The following primers were used for qPCR: distal PTF1 site: forward (F), 5′-CTGACACTAATAGCTCGCGGCTCAGGTACG-3′; reverse (R), 5′-AGGCTGTTTCAAAAGGCGACACCTGCAAGC-3′; proximal PTF1 site: F, 5′-AGCCAGGTGTCCCCAATGTACCTTTGAGGA-3′; R, 5′-GGTGTTCAGACGCTCGGGGAAATCAGGCA-3′; Mrps15: F, 5′-CTGGGACATAGTGGGTGCTT-3′; R, 5′-GAGCCTAGAGATGGGCTGTG-3′; control region C1: F, 5′-TCTTCACCCAGCACTCAGGCTC-3′; R, 5′-ATCCTGATGGTTCCCATGGCCACTTTCG-3′; control region C2: F, 5′-TCATAAGCCCATGCCAACCCTG-3′; R, 5′-GCCATATGTGTTTGCTCATTTTGCGCTCC-3′.
Results
Two regulatory sequences direct Ptf1a-specific expression in the neural tube
To begin to understand how Ptf1a is regulated, we searched the 30 kb genomic region surrounding the mouse Ptf1a gene for evolutionary conserved regions that might function as cis-regulatory elements using BLAT analysis for 28 vertebrate species (http://genome.ucsc.edu/cgi-bin/hgBlat). Several sequences within this region were identified that display extensive conservation throughout vertebrates including a 15.6 kb sequence lying immediately 5′ of Ptf1a coding region and a 12.4 kb sequence immediately 3′ (Fig. 1F). These sequences were assayed for activity in directing Ptf1a-specific expression using a heterologous lacZ reporter gene in transgenic mouse embryos at embryonic day 10.5 (E10.5). Both sequences were sufficient in transgenic embryos to direct lacZ expression to the dorsal neural tube from hindbrain regions to the tail (Fig. 1A,E). β-Galactosidase (β-gal) staining was restricted within the dorsal neural tube in a domain consistent with known Ptf1a expression in progenitors to dI4 interneurons (dP4) (Fig. 1A′,E′). Although both the 5′ and 3′ regulatory sequences direct expression to the dP4 domain, there is a subtle difference in the pattern in the medial lateral axis. β-gal staining from the 5′ sequence is enriched in the lateral edge of the ventricular zone, whereas expression from the 3′ sequence is somewhat uniform throughout the ventricular zone (Fig. 1A′,E′, arrowheads). The distinct pattern of reporter expression suggests that these elements are not redundant but rather that they play different roles in Ptf1a regulation.
Figure 1.

Identification of sequences regulating Ptf1a expression. A–E, Representative transgenic E10.5 mouse embryos β-gal stained as whole mounts. A′–E′, Cross sections of the β-gal-stained embryos showing the neural tube taken at the forelimb level. The bracketed area indicates the region where endogenous Ptf1a is expressed (dP4). A–C, The 2.3 kb region appears to be both necessary within the 15.6 kb enhancer, and sufficient when tested on a heterologous promoter (Ela1) to direct dorsal expression. D, D′, Mutating the TC-box in both PTF1 sites in the 2.3 kb enhancer destroys expression. E, The 3′ 12.4 kb region also directs dorsal-specific expression. Expression in the midbrain does not reflect normal Ptf1a expression. Arrowheads in A′, C′, and E′ indicate the enriched β-gal signal at the lateral edge of the ventricular zone seen with the 5′ but not the 3′ regulatory sequences. F, Top, Graphical representation of the sequence conservation (−16.5 kb to +15.5 kb) surrounding Ptf1a across 28 vertebrate species using BLAT (http://genome.ucsc.edu/cgi-bin/hgBlat). Bottom, Diagram of transgenes used with respect to the Ptf1a locus and the corresponding number of embryos expressing LacZ in the dorsal neural tube (DNT) out of those positive for the transgene (TgM). *Expression in neural tube is ventral and does not reflect the Ptf1a pattern (B, B′, arrow). The yellow filled area represents the Ela1 basal promoter that does not function on its own to activate reporter expression (Beres et al., 2006).
A conserved distal 5′ 2.3 kb enhancer is a direct PTF1-J targeted autoregulatory element
Activity of the 2.3 kb Ptf1a 5′ enhancer
The most distal 2.3 kb of the 15.6 kb sequence contains the highest conservation (Fig. 1). When tested in isolation, the distal 2.3 kb 5′ region exhibited the same restricted dorsal neural tube expression seen with the full 15.6 kb region (Fig. 1C). In contrast, the intervening proximal 13.4 kb region had no activity in directing expression to the dorsal neural tube (Fig. 1B). It did, however, consistently direct expression to a ventral neural tube pattern ectopic to the normal Ptf1a pattern (Fig. 1B′, arrow). Thus, the 2.3 kb sequence possesses the activity for directing reporter gene expression to the dP4 region in the dorsal neural tube and information for repressing ventral neural tube activity of the proximal 13.4 kb sequence.
Because Ptf1a is expressed in several regions in the developing nervous system at multiple embryonic stages, we generated independent transgenic mouse lines with the 2.3 kb regulatory element driving nuclear GFP (2.3Ptf1a-GFP) and characterized reporter gene expression at multiple stages. Two separate 2.3Ptf1a-GFP mouse strains were identified that directed expression of GFP to all Ptf1a domains in a similar manner. All images shown are from one of these lines (Fig. 2). 2.3Ptf1a-GFP expresses strongly in the dorsal neural tube and hindbrain at E10.5 (Fig. 2A,B,I), consistent with the 2.3Ptf1a-lacZ transgenic embryos (Fig. 1C). This expression persisted through E12.5, but by E14.5 levels were significantly diminished (Fig. 2J,K; supplemental Fig. 1A, available at www.jneurosci.org as supplemental material). A comparison of GFP with endogenous Ptf1a demonstrated extensive overlap in the dP4 and dPLA progenitor domains in the developing spinal cord at E10.5 and E12.5, respectively (Fig. 2A,C). This overlap extends rostrally through hindbrain regions as well (Fig. 2B,D). Although the expression domains align precisely in the dorsal/ventral and rostral/caudal axes, GFP expression appears to be slightly delayed relative to Ptf1a, as the overlap is restricted to the lateral edge of the Ptf1a domain (Fig. 2H). Furthermore, GFP is enriched lateral to the ventricular zone where Ptf1a lineage cells migrate as they lose Pft1a and differentiate (Fig. 2A–D, arrows vs arrowheads). This pattern most likely reflects differences in stability of GFP versus Ptf1a.
Figure 2.

Activity of the 2.3 kb regulatory element in transgenic mice. A–D, At E10.5 and E12.5, GFP fluorescence (green) strongly colabels with Ptf1a immunofluorescence (red) in the spinal cord (sc) and hindbrain (hb) (arrows) in the 2.3Ptf1a-GFP transgenic mouse strain. The GFP persists in cells that have begun to migrate away from the ventricular zone and have downregulated Ptf1a (arrowheads). E–G, Sagittal sections of Ptf1a-expressing domains at E14.5. E, At E14.5, when it is most strongly expressed in the retina, Ptf1a is confined to the neuroblastic layer (nbl). GFP from 2.3Ptf1a-GFP is similarly restricted, but colabeling with Ptf1a is most prominent at the inner portion of this layer (arrow), where more mature cells have migrated. *Ectopic expression in the pigmented epithelium (pe). F, 2.3Ptf1a-GFP expression closely mimics Ptf1a in both the cerebellum (arrow) and rostral hindbrain. G, Ptf1a can be detected in two regions within the developing hypothalamus (arrows), and GFP signal can be detected in both areas (insets), though it is more abundant in the anterior domain. H, High magnification of region indicated by dashed box in C. GFP colabels with Ptf1a (between the dashed lines) at the lateral edge of the ventricular zone (VZ) and is maintained as Ptf1a-expressing cells mature and migrate into the mantle zone (MZ). No GFP is detected in the medial ventricular zone. H′, H″, Tlx3 immunofluorescence (red) (H′) does not colabel with GFP, whereas Pax2 immunofluorescence (red) (H″) colabels strongly with GFP. I–K, Representative embryos from a 2.3Ptf1a-GFP transgenic line at E10.5, E12.5, and E14.5 in both wild-type and Ptf1a mutant backgrounds. The dotted lines indicate the section plane for A–D. Transgene expression reflects the pattern of endogenous Ptf1a in the dorsal neural tube from the hindbrain caudally to the tail. The expression in the retinal pigmented epithelium and the midbrain marked by asterisks in I and J represent ectopic activity of the 2.3 kb regulatory element as Ptf1a is not expressed in these tissues. Transgene expression in the neural tube is absent in the Ptf1a null (I′–K′, arrow) and markedly diminished in the Ptf1aW298A/W298A mutant (I″–K″, arrow), while the ectopic expression in the retina and midbrain is unaffected (asterisks). gcl, Ganglion cell layer; ret, retina; rp, Rathke's pouch. Scale bars: A–G, 100 μm; H, 50 μm.
This property allowed us to conduct short term lineage tracing to verify that the 2.3 kb regulatory element is exclusively active in Ptf1a-expressing precursors. Tlx3, which specifically marks glutamatergic neurons from the dI3, dI5, and dILB domains (Cheng et al., 2004, 2005), does not overlap with GFP in the neural tube at either E10.5 (data not shown) or E12.5 (Fig. 2H′). However, Pax2, which specifically marks GABAergic neurons from dI4 and dILA in the dorsal neural tube, colabels strongly with GFP at E10.5 (data not shown) and almost completely at E12.5, with only immature GFP-positive cells in the ventricular zone not yet expressing Pax2 (Fig. 2H″).
By E14.5, pronounced Ptf1a expression can be seen in the developing retina, cerebellum, and diencephalon (Fujitani et al., 2006; Pascual et al., 2007). GFP from the transgene mimics Ptf1a expression in the neural retina, as it can be first detected at E12.5 (data not shown) and is readily seen in the neuroblastic layer by E14.5 (Fig. 2E). Similarly, strong overlap between Ptf1a and GFP is detected in the cerebellum and hindbrain (Fig. 2F). In the diencephalon, Ptf1a is in two domains that will give rise to the preoptic and ventral medial regions of the hypothalamus (Glasgow et al., 2005) (Fig. 2G). The GFP reporter is detected in the preoptic Ptf1a domain and weakly in the posterior domain. Weak GFP signal is also present in the dorsal spinal cord at this stage; however, this is most likely due to GFP persistence, as Ptf1a levels and overall GFP are greatly reduced (supplemental Fig. 1A, available at www.jneurosci.org as supplemental material). Thus, the distal 2.3 kb 5′ enhancer is active in all Ptf1a-expressing regions of the developing nervous system.
Two PTF1 binding sites are present in the 2.3 kb Ptf1a regulatory sequence
Sequence analysis of the two highly conserved peaks in the 2.3 kb enhancer revealed the presence of two PTF1 binding sites, referred to here as the proximal (P) and the distal (D) PTF1 sites (Masui et al., 2008). Each PTF1 site contains an E-box, a 5 nt spacer, and a TC-box, thus adhering to the consensus sequence (Beres et al., 2006). Using EMSAs, we demonstrated that the PTF1-J trimer complex efficiently binds both these sites (Fig. 3A,B, lane 8). The two sites have somewhat different properties in that the P site E-box can be bound by a Ptf1a:E12 dimer and by Rbpj monomer (Fig. 3B, lanes 4, 7), whereas binding of these components to the D site is minor (Fig. 3A, lanes 4, 7). A mutant of Ptf1a, Ptf1aW298A, that does not efficiently interact with Rbpj (Beres et al., 2006; Hori et al., 2008), does not efficiently form a trimer complex with either PTF1 site (Fig. 3A,B, lane 12). Furthermore, mutating the E-box in either of these sites destroys binding of the PTF1-J trimer as well as the Ptf1a:E12 dimer but does not disturb the Rbpj monomer (Fig. 3A,B, lane 13). Similarly, the TC-box mutations also disrupt trimer binding, in addition to preventing Rbpj monomer from binding (Fig. 3B, lane 14).
Figure 3.

PTF1-J binds to the proximal and distal PTF1 sites within the 2.3 kb regulatory region. EMSA with each PTF1 site from the 2.3 kb 5′ regulatory region. A, The distal site is bound by the PTF1-J trimer that includes Ptf1a, E12, and Rpbj (lane 8). Neither the Ptf1a:E12 heterodimer nor Rbpj alone bind strongly to this site (lanes 4, 7). Substitution of the Ptf1aW298A mutant (WA) for Ptf1a strongly disrupts the interaction with Rbpj (compare lanes 6 and 8 with 10 and 12). Both E-box and TC-box mutations prevent trimer binding (lanes 13, 14). B, The proximal site is bound not only by PTF1-J (lane 8), but also by Rbpj (lane 4), Ptf1a:Rbpj (lane 6), and Ptf1a:E12 (lane 7). As with the distal site, Ptf1aW298A disrupts binding of PTF1-J and Ptf1a:Rbpj (lanes 10, 12). Disruption of either the E-box or TC-box prevents PTF1-J trimer binding (lanes 13, 14). The E-box mutation does not, however, affect Rbpj binding.
EMSAs demonstrate the two PTF1 sites within the 2.3 kb 5′ enhancer can be bound by the PTF1-J transcription complex in vitro. To verify that Ptf1a binds to this genomic region in vivo, we performed chromatin immunoprecipitation (ChIP) with E11.5 neural tubes using antibodies against Ptf1a (Beres et al., 2006). Genomic regions containing the P or D PTF1 sites were enriched ∼10-fold relative to a control genomic region in the Mrps15 gene (encodes a 28S subunit protein) (Fig. 4). Neither of two control Ptf1a genomic regions >1 kb away from the PTF1 sites showed significant enrichment (Fig. 4). Together these results provide evidence for direct autoregulation of the 2.3 kb 5′ enhancer by Ptf1a itself as a component of the PTF1-J transcription complex.
Figure 4.

Ptf1a occupies the 2.3 kb 5′ regulatory region in vivo. ChIP was performed with antibodies against Ptf1a using chromatin from E11.5 mouse neural tube. Both proximal and distal PTF1 sites (P, D) are enriched relative to a control gene Mrps15, while control regions flanking these sites are not enriched (C1, C2). Top, Location of qPCR products within the Ptf1a locus. Error bars represent SDs. *p < 0.01.
Activity of the 2.3 kb 5′ enhancer requires the PTF1 sites
We next examined the requirement for the PTF1 sites within the 2.3 kb 5′ Ptf1a enhancer for enhancer activity. The TC-box in each site was mutated, and the resulting mutant enhancer was tested in a lacZ reporter in transgenic mouse embryos. The TC-box mutations completely destroyed activity of the enhancer, and no lacZ reporter was detected in 16/16 transgenic embryos (Fig. 1D,D′).
To further investigate the PTF1 site sequence requirements for activity of the enhancer, we moved to the in ovo chick electroporation assay. When electroporated into chick neural tubes at HH15-16 and assayed 48 h later, the 2.3 kb 5′ enhancer gave restricted GFP expression in the dorsal neural tube, similar to that seen in transgenic mouse embryos with the same transgene (compare Fig. 5A with Fig. 2A). Coelectroporation of a Ptf1a expression vector with the 2.3 kb 5′ enhancer induced GFP reporter expression throughout the neural tube in cells expressing the ectopic Ptf1a (Fig. 5B), indicating that Ptf1a is sufficient to activate expression through this enhancer in a cell-autonomous manner. This is not a general response to expression of bHLH factors since coelectroporation with Ascl1 does not activate enhancer activity (supplemental Fig. 2, available at www.jneurosci.org as supplemental material). E-box and TC-box mutant 2.3 kb enhancer reporters disrupted the ability of the enhancer to direct expression to the dorsal neural tube (Fig. 5, compare C and E with A). Furthermore, both the E-box and TC-box mutant enhancers were unresponsive to ectopic Ptf1a (Fig. 5, compare D and F with B). These two sets of mutations highlight the importance of both halves of the PTF1 sites to the 2.3 kb enhancer function, showing that it is the activity of PTF1-J complex, and not any of its subcomponents (Ptf1a:E12 dimer or Rbpj monomer), that is necessary for activity of the 2.3 kb 5′ Ptf1a enhancer.
Figure 5.

Ptf1a induces activity of the 2.3 kb Ptf1a regulatory region in the chick neural tube. A, The mouse 2.3Ptf1a-GFP construct was electroporated into chick neural tubes at HH15-16 and assayed 48 h later. GFP was restricted dorsally to what appears to be the dP4/dI4 region. B, Coelectroporation of a Ptf1a expression vector with the 2.3Ptf1a-GFP results in ectopic reporter expression (green). This response is cell autonomous as detected by colabeling of GFP fluorescence with Ptf1a immunofluorescence (red) (antibody recognizes electroporated mouse Ptf1a only). C, E, Mutating the TC-boxes (C) or the E-boxes (E) in both PTF1 sites in the 2.3 kb regulatory region destroys the ability of the region to drive dorsal expression. D, F, Misexpression of Ptf1a does not induce ectopic reporter expression through either of these mutant enhancers. G, H, The mouse 12.4Ptf1a-mCherry construct similarly expresses in the dP4/dI4 region. Ectopic expression of Ptf1a does not alter expression from this transgene.
Activity of the 2.3 kb enhancer in vivo requires Ptf1a and its interaction with Rbpj
Our results strongly support direct positive autoregulation through the PTF1 sites as the mechanism of action for the 2.3 kb 5′ Ptf1a enhancer. To lend further in vivo support, we examined enhancer activity of the 2.3Ptf1a-GFP transgene in mice null for Ptf1a or mice with the mutant Ptf1aW298A allele. In Ptf1a-null embryos, GFP expression was completely absent in all Ptf1a domains at E10.5, E12.5, and E14.5 (Fig. 2I′–K′). The only expression that remained was ectopic expression from the transgene seen in the retina pigmented epithelium and the midbrain (Fig. 2I′–K′, asterisks). In the Ptf1aW298A mutants, where the single amino acid mutant in Ptf1a disrupts its ability to form a complex with Rbpj (Beres et al., 2006; Hori et al., 2008), GFP expression was also dramatically reduced from wild-type levels (Fig. 2I″–K″). In contrast to expression of the transgene in the Ptf1a null, there were a few cells in each Ptf1a domain that retained GFP expression. This was most apparent in the spinal cord at E12.5 (Fig. 2J″). This incomplete loss of enhancer activity with the Ptff1aW298A mutant may reflect low levels of functional PTF1-J complex that may form (Fig. 3A,B, lane 12) (Beres et al., 2006). Nonetheless, these findings demonstrate the necessity for Ptf1a and its interaction with Rbpj for autoregulation through the 2.3 kb enhancer.
The conserved 3′ 12.4 kb sequence contains cis-regulatory information for activation of Ptf1a expression
Transgenic analysis demonstrated that the 12.4 kb sequence just 3′ of the Ptf1a coding region can function to direct specific expression of Ptf1a in the dorsal neural tube in the dP4 domain (Fig. 1E). As we did for the 5′ enhancer, we generated independent transgenic mouse lines with the 12.4 kb regulatory element driving a nuclear-localized mCherry reporter (12.4Ptf1a-mCherry) and characterized reporter gene expression at multiple stages. Three separate 12.4Ptf1a-mCherry lines were identified that expressed mCherry similarly in Ptf1a domains (Fig. 6). As with the 12.4Ptf1a-lacZ transgenic embryos (Fig. 1E), the 12.4Ptf1a-mCherry transgene expresses strongly in the dP4 domain of the dorsal neural tube and hindbrain at E10.5 (Fig. 6A,B). mCherry was compared with endogenous Ptf1a using immunofluorescence, revealing extensive overlap in these regions (Fig. 6A,B). However, the mCherry signal is more uniformly intense and labels more cells than does Ptf1a. Analysis at E12.5 showed similar results; mCherry continues to overlap Ptf1a in the dPLA progenitor domain in the developing spinal cord, as well as in the hindbrain (Fig. 6C,D). In contrast to 2.3Ptf1a-GFP, mCherry densely labels the dorsal ventricular zone, including many cells that have yet to activate Ptf1a (Fig. 6C′); however, the dorsoventral extent of expression is more restricted (compare Fig. 2C with Fig. 6C). Interestingly, those cells that express Ptf1a seem to have lower levels of mCherry (Fig. 6C′, arrows). By this point however, mCherry persists well beyond Ptf1a, labeling mature neurons that have migrated laterally away from the ventricular zone. As with 2.3Ptf1a-GFP, this permitted us to determine the identities of mature mCherry-positive neurons. In contrast with the 2.3 kb enhancer, the 12.4 kb enhancer is active in both dILA and dILB progenitors, as mCherry colabels equally with Tlx3 and Pax2 in the E12.5 neural tube (Fig. 6C″,C‴). Although the expression domains align precisely in the dorsal/ventral and rostral/caudal axes, there are distinct and important differences in the mCherry and Ptf1a expression patterns at the cellular level.
Figure 6.
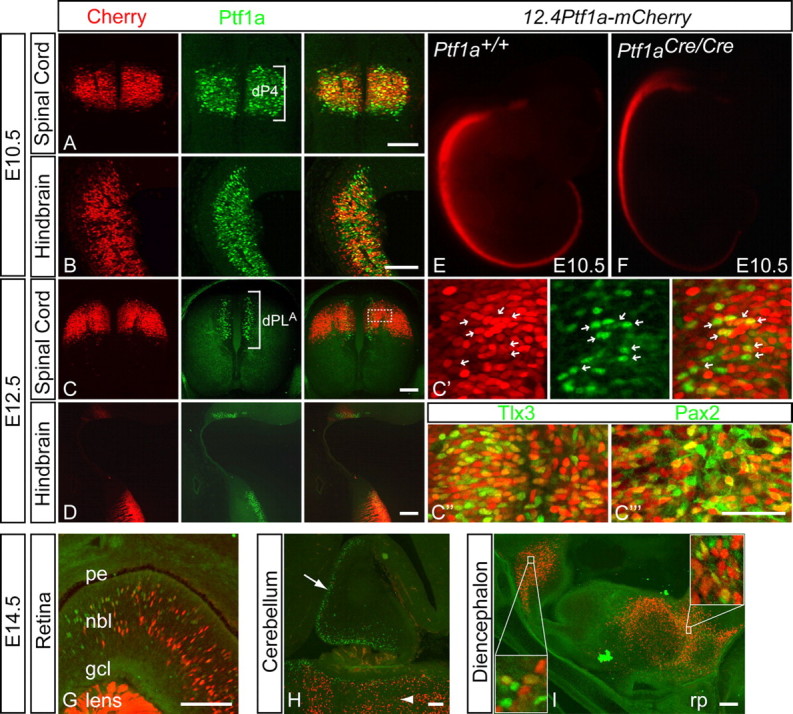
Activity of the 3′ 12.4 kb regulatory region in transgenic mice. A, B, At E10.5, fluorescence from the mCherry reporter (red) strongly colabels with Ptf1a immunofluorescence (green) in the spinal cord and hindbrain in the 12.4Ptf1a-mCherry transgenic mouse strain. C, D, By E12.5, mCherry expression continues to overlap Ptf1a in the hindbrain and in dPLA progenitors in the spinal cord; however, it has now expanded laterally beyond the ventricular zone in both regions. C′, C″, C‴, Higher magnification of region indicated by dashed box in C. C′, mCherry labels many more cells than does Ptf1a in the ventricular zone. Also, cells that express Ptf1a appear to have less mCherry signal (arrows). mCherry colabels with both Tlx3 (C″) and Pax2 (C‴) immunofluorescence. G–I, Sagittal sections of Ptf1a-expressing domains at E14.5. G, 12.4Ptf1a-mCherry expression overlaps Ptf1a in the neuroblastic layer of the retina (nbl), and it ectopically expresses in the lens. H, Reporter signal is absent from the cerebellum (arrow), while hindbrain expression continues to persist beyond the Ptf1a-positive region (arrowhead). I, mCherry signal overlaps Ptf1a in both hypothalamic regions (insets), although the reporter expression is not limited to Ptf1a-expressing cells. E, Representative E10.5 embryo from a 12.4Ptf1a-mCherry transgenic line. Transgene expression reflects the pattern of endogenous Ptf1a in the dorsal neural tube from the hindbrain caudally to the tail. F, E10.5 embryo from the 12.4Ptf1a-mCherry line shown in E crossed onto Ptf1a-null background. Unlike 2.3Ptf1a-GFP, 12.4Ptf1a-mCherry expression is unaffected in the Ptf1a mutant. gcl, Ganglion cell layer; pe, pigmented epithelium; rp, Rathke's pouch. Scale bars: A–D, G–I, 100 μm; C′, C″,C‴, 50 μm.
Along with Ptf1a, the 3′ 12.4 kb enhancer expresses weakly in the neural retina beginning at E12.5 (data not shown), with prominent mCherry signal detectable at E14.5 (Fig. 6G). Ectopic signal in the lens is also detected (Fig. 6G). The 3′ 12.4 kb sequence also directs expression to both Ptf1a-expressing domains in the hypothalamus at E14.5 (Fig. 6I), although its expression is much more robust in this region than the 2.3 kb 5′ enhancer. Furthermore, 12.4Ptf1a-mCherry expresses more broadly than Ptf1a at E14.5, and mCherry expression persists in the dorsal spinal cord and hindbrain after Ptf1a is no longer detectable (supplemental Figs. 1B, 6H, available at www.jneurosci.org as supplemental material). In the cerebellum, however, mCherry signal is remarkably absent (Fig. 6H). Thus, the 12.4 kb 3′ enhancer contains sufficient information to properly activate Ptf1a throughout the developing nervous system, excepting the cerebellum. Nonetheless, it lacks information for two important aspects of Ptf1a regulation: exclusive spatial expression in cells destined to activate Ptf1a, and a shutoff mechanism restricting its expression temporally to immature neuronal progenitors.
The 3′ 12.4 kb enhancer activates expression independent of Ptf1a
No conserved PTF1 sites were identified within the 3′ 12.4 kb enhancer, implying that it functions in a Ptf1a-independent manner. This finding is consistent with expression analysis of mCherry and Ptf1a described above. To confirm that this element functions independently of Ptf1a, we used both gain and loss of function experiments in chick and mouse. We examined whether Ptf1a could induce expression through this enhancer in chick as was seen for the 2.3Ptf1a-GFP construct. 12.4Ptf1a-mCherry directs dI4-restricted expression when electroporated into chick neural tube at HH15-16 and examined 48 h later (Fig. 5G). Coelectroporation of a Ptf1a expression vector with the enhancer construct did not induce reporter expression outside of the dP4/dI4 region (Fig. 5H). We also examined the activity of the 12.4Ptf1a-mCherry transgene in mice null for Ptf1a. At E10.5, reporter expression is not diminished in either the neural tube or hindbrain of mutant embryos (Fig. 6, compare E with F). These results verify that the 3′ 12.4 kb enhancer contains no autoregulatory activity and does not require Ptf1a for its function.
The 3′ 12.4 kb enhancer activates expression independent of ASC/1
Because Ptf1a expression is lost at E12.5 in Ascl1-null mice (Mizuguchi et al., 2006), we investigated whether Ascl1 regulates Ptf1a expression through either the 3′ 12.4 kb or the 5′ 2.3 kb enhancers. A search for Ascl1 consensus sites (GCAGSTGK) (Gohlke et al., 2008) revealed the presence of two sites in each enhancer within sequence conserved across multiple vertebrate species (http://genome.ucsc.edu/cgi-bin/hgBlat). To test whether Ascl1 could regulate the activity of these enhancers, we used in ovo electroporation to overexpress Ascl1 or an inactive mutant, Ascl1AQ, in the presence of either the 2.3 kb or 12.4 kb enhancer (supplemental Fig. 2, available at www.jneurosci.org as supplemental material). As was previously reported, Ascl1 but not Ascl1AQ promotes differentiation (Nakada et al., 2004), increasing the lateral migration of electroporated cells. However, even though Ascl1 was active in this assay, it neither repressed nor activated expression of the Ptf1a enhancers. Thus, Ascl1 regulation of Ptf1a is not through sequences in the 2.3 kb 5′ or 12.4 kb 3′ regulatory regions.
Discussion
Ptf1a plays a critical role in establishing a balance of excitatory and inhibitory neurons, and understanding how it is regulated will provide valuable insight not only into nervous system development but also into pathologies in which this balance is disturbed. Here we describe two regulatory elements that control Ptf1a expression in the developing nervous system. One of these, the 5′ 2.3 kb enhancer, functions via positive autoregulation, as Ptf1a is necessary for its activity in vivo. Furthermore, we demonstrate that Ptf1a is localized to this regulatory region in vivo, indicating that this activation is direct. Another region, encompassing 12.4 kb 3′ of Ptf1a, directs proper spatial expression in most neural Ptf1a domains. The activity of this enhancer is independent of Ptf1a and likely reflects a mechanism responsible for initiating Ptf1a expression.
Comparison of Ptf1a regulation in the CNS and pancreas
These findings parallel those recently reported in the pancreas, where the 2.3 kb 5′ element is also active (Masui et al., 2008). There, it also directs expression specifically in Ptf1a-expressing cells during development. The expression of 2.3Ptf1a-GFP in the pancreas closely follows Ptf1a levels; GFP signal is weak during early epithelial growth and intensifies as Ptf1a levels accumulate during acinar differentiation (Masui et al., 2008). Collectively, these two studies demonstrate that the highly conserved 2.3 kb 5′ Ptf1a enhancer functions as a positive autoregulatory enhancer in all Ptf1a-expressing regions. They also begin to uncover subtle differences in how Ptf1a is regulated in such disparate tissues. For instance, the relatively unconserved 13.4 kb region between the 2.3 kb 5′ enhancer and Ptf1a coding region contains sufficient information to direct expression specifically to Ptf1a-positive cells in the pancreas, and this expression is synergistic with the 2.3 kb element (Masui et al., 2008). However, this same region does not express in Ptf1a domains in the neural tube, and no synergistic activity is detected with the 2.3 kb enhancer (see Fig. 1). Furthermore, considering that the 12.4 kb 3′ enhancer expresses so uniformly in nearly all Ptf1a-expressing regions in the nervous system, it is surprising that this element expresses very sparsely in the pancreas, and even then it is not active until much later in development (Masui et al., 2008). Clearly distinct mechanisms are responsible for initial activation of Ptf1a in the pancreas and neural tissue, while maintenance of Ptf1a levels via autoregulation is a highly conserved function.
Role of positive autoregulation of transcription factors
Positive autoregulation is a common theme in development and is an important regulatory mechanism for many classes of transcription factors. The ability of a factor to self-sustain its levels allows it to become independent from external control, thus committing a cell to a specific identity; for Ptf1a, this results in GABAergic neuronal specification in the CNS. Intuitively, feedforward loops should maintain levels ad infinitum, and this is indeed the case for Pit-1 in the pituitary, Barhl1 in the inner ear and CNS, and Ptf1a in the pancreas (Chen et al., 1990; Chellappa et al., 2008; Masui et al., 2008). Yet for many other factors involved in cell fate determination, including MyoD, Atoh1, achaete, scute, and Ptf1a in the nervous system, self-activation is transient, and expression ceases once cells achieve terminal differentiation (Thayer et al., 1989; Van Doren et al., 1992; Helms et al., 2000). It is possible that for these factors, positive autoregulation functions to achieve a necessary threshold for program initiation rather than to maintain cellular function. In such a scenario, persistence of factors like Ptf1a may actually be deleterious by trapping cells in an intermediately differentiated state, a common characteristic of neoplasia. In fact, MyoD, Atoh1, and Ascl1 (the mammalian achaete-scute homolog) are all known to be upregulated in tumors derived from lineages normally expressing these factors (Dias et al., 1990; Ball et al., 1993; Zhao et al., 2008). Therefore, an important component of the Ptf1a-induced program in maturing neurons must be its own attenuation, where a secondary function in cell maintenance, such as it has in mature acinar cells, does not exist. It seems likely, therefore, that one or more downstream targets of Ptf1a in the CNS inhibit its transcriptional activity, thereby breaking its feedforward loop. For other bHLH factors, this is commonly achieved by sequestering E proteins (e.g., with Id and Hes family members) (Sasai et al., 1992; Hirata et al., 2000; Tzeng, 2003), although it remains to be seen whether a similar mechanism exists for Ptf1a.
What initiates Ptf1a expression
Autoregulation does not, however, address the question as to how Ptf1a transcription is initially activated. The loss of Ptf1a expression in the neural tube at E12.5 in Ascl1-null mice suggests that Ascl1 may be involved in this process; however, Ptf1a is activated normally before this stage (Mizuguchi et al., 2006; Wildner et al., 2006). It is therefore likely that Ptf1a is regulated by distinct mechanisms in dP4 and dPLA progenitors. Furthermore, the role of Ascl1 in regulating Ptf1a is not straightforward, as overexpression of Ascl1 during late-stage neurogenesis in the neural tube does not increase Ptf1a levels or dILA cell number (Wildner et al., 2006). If Ascl1 directly regulates Ptf1a, it is not acting through the two enhancers studied here (supplemental Fig. 2, available at www.jneurosci.org as supplemental material). Foxn4 has also been shown to regulate Ptf1a, as Foxn4 mutant mice fail to express Ptf1a in the retina (Fujitani et al., 2006). However, Foxn4 is not present in the dorsal neural tube or any other Ptf1a domain (Li et al., 2005). Thus, it is conceivable that Ptf1a expression is controlled in different tissues by factors unique to those tissues.
The 3′ 12.4 kb enhancer is a likely candidate to contain the regulatory information for initiation. It expresses strongly in progenitors to Ptf1a-expressing domains, most evident at E12.5, when reporter expression densely labels the ventricular zone (see Fig. 6C′). Still, this element alone cannot account for Ptf1a initiation in every domain. In the pancreas, this regulatory element expresses sparsely, and it is completely inactive before acinar formation (Masui et al., 2008). Furthermore, it does not express at any point in the developing cerebellum. What mechanisms initially activate Ptf1a in the pancreas remain unknown; however, a recent study supplies a possible clue into activation of Ptf1a expression in the cerebellum. In this study, the deletion mutant Cbll causes cerebellar agenesis, because of loss of Ptf1a only within the cerebellum (Hoshino et al., 2005). The region deleted in this mutant is located ∼60–373 kb downstream of Ptf1a and may very well contain cis-regulatory information controlling cerebellum-specific Ptf1a expression (Hoshino et al., 2005).
Concluding remarks
Proper assembly of an organ with such immense complexity as the nervous system requires exquisitely fine control at the molecular level. Not unexpectedly, the genetic circuits responsible for neural development are appropriately intricate. The function of Ptf1a in this process seems relatively straightforward, promoting inhibitory neuronal cell fates while suppressing excitatory programs. Nonetheless, even this simple switch requires no fewer than three degrees of temporal control: activation, autoamplification, and termination. Further study of the two regulatory regions presented here will undoubtedly reveal important mechanistic insight into how multiple regions in the nervous system generate the balance of inhibitory and excitatory neurons.
Footnotes
This work was supported by Public Health Service Grants R01-HD37032 (J.E.J.) and T32-MH076690 (D.M.M.) and Beta-Cell Biology Consortium funding via U19DK42502 (R.J.M.). We thank Dr. Robert Hammer and the outstanding service of the University of Texas Southwestern Transgenic Core Facility for generating the transgenic mice for this study. The Tlx3 antibodies were a generous gift from Drs. T. Müller and C. Birchmeier. We acknowledge Dr. H. Lai, Dr. K. Zimmerman, and Midhat Farooqi for critical comments on the manuscript.
References
- Ball DW, Azzoli CG, Baylin SB, Chi D, Dou S, Donis-Keller H, Cumaraswamy A, Borges M, Nelkin BD. Identification of a human achaete-scute homolog highly expressed in neuroendocrine tumors. Proc Natl Acad Sci U S A. 1993;90:5648–5652. doi: 10.1073/pnas.90.12.5648. [DOI] [PMC free article] [PubMed] [Google Scholar]
- Beres TM, Masui T, Swift GH, Shi L, Henke RM, MacDonald RJ. PTF1 is an organ-specific and Notch-independent basic helix-loop-helix complex containing the mammalian Suppressor of Hairless (RBP-J) or its paralogue, RBP-L. Mol Cell Biol. 2006;26:117–130. doi: 10.1128/MCB.26.1.117-130.2006. [DOI] [PMC free article] [PubMed] [Google Scholar]
- Berry N, Jobanputra V, Pal H. Molecular genetics of schizophrenia: a critical review. J Psychiatry Neurosci. 2003;28:415–429. [PMC free article] [PubMed] [Google Scholar]
- Brinster RL, Chen HY, Trumbauer ME, Yagle MK, Palmiter RD. Factors affecting the efficiency of introducing foreign DNA into mice by microinjecting eggs. Proc Natl Acad Sci U S A. 1985;82:4438–4442. doi: 10.1073/pnas.82.13.4438. [DOI] [PMC free article] [PubMed] [Google Scholar]
- Caspary T, Anderson KV. Patterning cell types in the dorsal spinal cord: what the mouse mutants say. Nat Rev Neurosci. 2003;4:289–297. doi: 10.1038/nrn1073. [DOI] [PubMed] [Google Scholar]
- Chellappa R, Li S, Pauley S, Jahan I, Jin K, Xiang M. Barhl1 regulatory sequences required for cell-specific gene expression and autoregulation in the inner ear and central nervous system. Mol Cell Biol. 2008;28:1905–1914. doi: 10.1128/MCB.01454-07. [DOI] [PMC free article] [PubMed] [Google Scholar]
- Chen RP, Ingraham HA, Treacy MN, Albert VR, Wilson L, Rosenfeld MG. Autoregulation of pit-1 gene expression mediated by two cis-active promoter elements. Nature. 1990;346:583–586. doi: 10.1038/346583a0. [DOI] [PubMed] [Google Scholar]
- Cheng L, Arata A, Mizuguchi R, Qian Y, Karunaratne A, Gray PA, Arata S, Shirasawa S, Bouchard M, Luo P, Chen CL, Busslinger M, Goulding M, Onimaru H, Ma Q. Tlx3 and Tlx1 are post-mitotic selector genes determining glutamatergic over GABAergic cell fates. Nat Neurosci. 2004;7:510–517. doi: 10.1038/nn1221. [DOI] [PubMed] [Google Scholar]
- Cheng L, Samad OA, Xu Y, Mizuguchi R, Luo P, Shirasawa S, Goulding M, Ma Q. Lbx1 and Tlx3 are opposing switches in determining GABAergic versus glutamatergic transmitter phenotypes. Nat Neurosci. 2005;8:1510–1515. doi: 10.1038/nn1569. [DOI] [PubMed] [Google Scholar]
- Cockell M, Stevenson BJ, Strubin M, Hagenbüchle O, Wellauer PK. Identification of a cell-specific DNA-binding activity that interacts with a transcriptional activator of genes expressed in the acinar pancreas. Mol Cell Biol. 1989;9:2464–2476. doi: 10.1128/mcb.9.6.2464. [DOI] [PMC free article] [PubMed] [Google Scholar]
- Dias P, Parham DM, Shapiro DN, Webber BL, Houghton PJ. Myogenic regulatory protein (MyoD1) expression in childhood solid tumors: diagnostic utility in rhabdomyosarcoma. Am J Pathol. 1990;137:1283–1291. [PMC free article] [PubMed] [Google Scholar]
- Fields HL, Heinricher MM, Mason P. Neurotransmitters in nociceptive modulatory circuits. Annu Rev Neurosci. 1991;14:219–245. doi: 10.1146/annurev.ne.14.030191.001251. [DOI] [PubMed] [Google Scholar]
- Fujitani Y, Fujitani S, Luo H, Qiu F, Burlison J, Long Q, Kawaguchi Y, Edlund H, MacDonald RJ, Furukawa T, Fujikado T, Magnuson MA, Xiang M, Wright CV. Ptf1a determines horizontal and amacrine cell fates during mouse retinal development. Development. 2006;133:4439–4450. doi: 10.1242/dev.02598. [DOI] [PubMed] [Google Scholar]
- Glasgow SM, Henke RM, Macdonald RJ, Wright CV, Johnson JE. Ptf1a determines GABAergic over glutamatergic neuronal cell fate in the spinal cord dorsal horn. Development. 2005;132:5461–5469. doi: 10.1242/dev.02167. [DOI] [PubMed] [Google Scholar]
- Gohlke JM, Armant O, Parham FM, Smith MV, Zimmer C, Castro DS, Nguyen L, Parker JS, Gradwohl G, Portier CJ, Guillemot F. Characterization of the proneural gene regulatory network during mouse telencephalon development. BMC Biol. 2008;6:15. doi: 10.1186/1741-7007-6-15. [DOI] [PMC free article] [PubMed] [Google Scholar]
- Gross MK, Dottori M, Goulding M. Lbx1 specifies somatosensory association interneurons in the dorsal spinal cord. Neuron. 2002;34:535–549. doi: 10.1016/s0896-6273(02)00690-6. [DOI] [PubMed] [Google Scholar]
- Helms AW, Johnson JE. Specification of dorsal spinal cord interneurons. Curr Opin Neurobiol. 2003;13:42–49. doi: 10.1016/s0959-4388(03)00010-2. [DOI] [PubMed] [Google Scholar]
- Helms AW, Abney AL, Ben-Arie N, Zoghbi HY, Johnson JE. Autoregulation and multiple enhancers control Math1 expression in the developing nervous system. Development. 2000;127:1185–1196. doi: 10.1242/dev.127.6.1185. [DOI] [PubMed] [Google Scholar]
- Hirata H, Ohtsuka T, Bessho Y, Kageyama R. Generation of structurally and functionally distinct factors from the basic helix-loop-helix gene Hes3 by alternative first exons. J Biol Chem. 2000;275:19083–19089. doi: 10.1074/jbc.M001075200. [DOI] [PubMed] [Google Scholar]
- Hori K, Cholewa-Waclaw J, Nakada Y, Glasgow SM, Masui T, Henke RM, Wildner H, Martarelli B, Beres TM, Epstein JA, Magnuson MA, Macdonald RJ, Birchmeier C, Johnson JE. A nonclassical bHLH Rbpj transcription factor complex is required for specification of GABAergic neurons independent of Notch signaling. Genes Dev. 2008;22:166–178. doi: 10.1101/gad.1628008. [DOI] [PMC free article] [PubMed] [Google Scholar]
- Hoshino M, Nakamura S, Mori K, Kawauchi T, Terao M, Nishimura YV, Fukuda A, Fuse T, Matsuo N, Sone M, Watanabe M, Bito H, Terashima T, Wright CV, Kawaguchi Y, Nakao K, Nabeshima Y. Ptf1a, a bHLH transcriptional gene, defines GABAergic neuronal fates in cerebellum. Neuron. 2005;47:201–213. doi: 10.1016/j.neuron.2005.06.007. [DOI] [PubMed] [Google Scholar]
- Hoveyda N, Shield JP, Garrett C, Chong WK, Beardsall K, Bentsi-Enchill E, Mallya H, Thompson MH. Neonatal diabetes mellitus and cerebellar hypoplasia/agenesis: report of a new recessive syndrome. J Med Genet. 1999;36:700–704. [PMC free article] [PubMed] [Google Scholar]
- Kawaguchi Y, Cooper B, Gannon M, Ray M, MacDonald RJ, Wright CV. The role of the transcriptional regulator Ptf1a in converting intestinal to pancreatic progenitors. Nat Genet. 2002;32:128–134. doi: 10.1038/ng959. [DOI] [PubMed] [Google Scholar]
- Krapp A, Knöfler M, Frutiger S, Hughes GJ, Hagenbüchle O, Wellauer PK. The p48 DNA-binding subunit of transcription factor PTF1 is a new exocrine pancreas-specific basic helix-loop-helix protein. EMBO J. 1996;15:4317–4329. [PMC free article] [PubMed] [Google Scholar]
- Krapp A, Knöfler M, Ledermann B, Bürki K, Berney C, Zoerkler N, Hagenbüchle O, Wellauer PK. The bHLH protein PTF1-p48 is essential for the formation of the exocrine and the correct spatial organization of the endocrine pancreas. Genes Dev. 1998;12:3752–3763. doi: 10.1101/gad.12.23.3752. [DOI] [PMC free article] [PubMed] [Google Scholar]
- Li S, Misra K, Matise MP, Xiang M. Foxn4 acts synergistically with Mash1 to specify subtype identity of V2 interneurons in the spinal cord. Proc Natl Acad Sci U S A. 2005;102:10688–10693. doi: 10.1073/pnas.0504799102. [DOI] [PMC free article] [PubMed] [Google Scholar]
- Lumpkin EA, Collisson T, Parab P, Omer-Abdalla A, Haeberle H, Chen P, Doetzlhofer A, White P, Groves A, Segil N, Johnson JE. Math1-driven GFP expression in the developing nervous system of transgenic mice. Gene Expr Patterns. 2003;3:389–395. doi: 10.1016/s1567-133x(03)00089-9. [DOI] [PubMed] [Google Scholar]
- Masui T, Long Q, Beres TM, Magnuson MA, MacDonald RJ. Early pancreatic development requires the vertebrate Suppressor of Hairless (RBPJ) in the PTF1 bHLH complex. Genes Dev. 2007;21:2629–2643. doi: 10.1101/gad.1575207. [DOI] [PMC free article] [PubMed] [Google Scholar]
- Masui T, Swift GH, Hale MA, Meredith DM, Johnson JE, Macdonald RJ. Transcriptional autoregulation controls pancreatic Ptf1a expression during development and adulthood. Mol Cell Biol. 2008;28:5458–5468. doi: 10.1128/MCB.00549-08. [DOI] [PMC free article] [PubMed] [Google Scholar]
- McCormick DA, Contreras D. On the cellular and network bases of epileptic seizures. Annu Rev Physiol. 2001;63:815–846. doi: 10.1146/annurev.physiol.63.1.815. [DOI] [PubMed] [Google Scholar]
- Mizuguchi R, Kriks S, Cordes R, Gossler A, Ma Q, Goulding M. Ascl1 and Gsh1/2 control inhibitory and excitatory cell fate in spinal sensory interneurons. Nat Neurosci. 2006;9:770–778. doi: 10.1038/nn1706. [DOI] [PubMed] [Google Scholar]
- Müller T, Brohmann H, Pierani A, Heppenstall PA, Lewin GR, Jessell TM, Birchmeier C. The homeodomain factor Lbx1 distinguishes two major programs of neuronal differentiation in the dorsal spinal cord. Neuron. 2002;34:551–562. doi: 10.1016/s0896-6273(02)00689-x. [DOI] [PubMed] [Google Scholar]
- Müller T, Anlag K, Wildner H, Britsch S, Treier M, Birchmeier C. The bHLH factor Olig3 coordinates the specification of dorsal neurons in the spinal cord. Genes Dev. 2005;19:733–743. doi: 10.1101/gad.326105. [DOI] [PMC free article] [PubMed] [Google Scholar]
- Nakada Y, Hunsaker TL, Henke RM, Johnson JE. Distinct domains within Mash1 and Math1 are required for function in neuronal differentiation versus neuronal cell-type specification. Development. 2004;131:1319–1330. doi: 10.1242/dev.01008. [DOI] [PubMed] [Google Scholar]
- Nakhai H, Sel S, Favor J, Mendoza-Torres L, Paulsen F, Duncker GI, Schmid RM. Ptf1a is essential for the differentiation of GABAergic and glycinergic amacrine cells and horizontal cells in the mouse retina. Development. 2007;134:1151–1160. doi: 10.1242/dev.02781. [DOI] [PubMed] [Google Scholar]
- Obata J, Yano M, Mimura H, Goto T, Nakayama R, Mibu Y, Oka C, Kawaichi M. p48 subunit of mouse PTF1 binds to RBP-Jkappa/CBF-1, the intracellular mediator of Notch signalling, and is expressed in the neural tube of early stage embryos. Genes Cells. 2001;6:345–360. doi: 10.1046/j.1365-2443.2001.00422.x. [DOI] [PubMed] [Google Scholar]
- Pascual M, Abasolo I, Mingorance-Le Meur A, Martínez A, Del Rio JA, Wright CV, Real FX, Soriano E. Cerebellar GABAergic progenitors adopt an external granule cell-like phenotype in the absence of Ptf1a transcription factor expression. Proc Natl Acad Sci U S A. 2007;104:5193–5198. doi: 10.1073/pnas.0605699104. [DOI] [PMC free article] [PubMed] [Google Scholar]
- Rose SD, MacDonald RJ. Evolutionary silencing of the human elastase I gene (ELA1) Hum Mol Genet. 1997;6:897–903. doi: 10.1093/hmg/6.6.897. [DOI] [PubMed] [Google Scholar]
- Sasai Y, Kageyama R, Tagawa Y, Shigemoto R, Nakanishi S. Two mammalian helix-loop-helix factors structurally related to Drosophila hairy and Enhancer of split. Genes Dev. 1992;6:2620–2634. doi: 10.1101/gad.6.12b.2620. [DOI] [PubMed] [Google Scholar]
- Sellick GS, Barker KT, Stolte-Dijkstra I, Fleischmann C, Coleman RJ, Garrett C, Gloyn AL, Edghill EL, Hattersley AT, Wellauer PK, Goodwin G, Houlston RS. Mutations in PTF1A cause pancreatic and cerebellar agenesis. Nat Genet. 2004;36:1301–1305. doi: 10.1038/ng1475. [DOI] [PubMed] [Google Scholar]
- Thayer MJ, Tapscott SJ, Davis RL, Wright WE, Lassar AB, Weintraub H. Positive autoregulation of the myogenic determination gene MyoD1. Cell. 1989;58:241–248. doi: 10.1016/0092-8674(89)90838-6. [DOI] [PubMed] [Google Scholar]
- Tzeng SF. Inhibitors of DNA binding in neural cell proliferation and differentiation. Neurochem Res. 2003;28:45–52. doi: 10.1023/a:1021691911011. [DOI] [PubMed] [Google Scholar]
- Van Doren M, Powell PA, Pasternak D, Singson A, Posakony JW. Spatial regulation of proneural gene activity: auto- and cross-activation of achaete is antagonized by extramacrochaetae. Genes Dev. 1992;6:2592–2605. doi: 10.1101/gad.6.12b.2592. [DOI] [PubMed] [Google Scholar]
- Verma-Kurvari S, Savage T, Gowan K, Johnson JE. Lineage-specific regulation of the neural differentiation gene MASH1. Dev Biol. 1996;180:605–617. doi: 10.1006/dbio.1996.0332. [DOI] [PubMed] [Google Scholar]
- Wildner H, Müller T, Cho SH, Bröhl D, Cepko CL, Guillemot F, Birchmeier C. dILA neurons in the dorsal spinal cord are the product of terminal and non-terminal asymmetric progenitor cell divisions, and require Mash1 for their development. Development. 2006;133:2105–2113. doi: 10.1242/dev.02345. [DOI] [PubMed] [Google Scholar]
- Zhao H, Ayrault O, Zindy F, Kim JH, Roussel MF. Post-transcriptional down-regulation of Atoh1/Math1 by bone morphogenic proteins suppresses medulloblastoma development. Genes Dev. 2008;22:722–727. doi: 10.1101/gad.1636408. [DOI] [PMC free article] [PubMed] [Google Scholar]