

Abstract
Functional alterations in striatal projection neurons play a critical role in the development of motor symptoms in Parkinson's disease (PD), but their molecular adaptation to dopamine depletion remains poorly understood. In particular, type and extent of regulation in postsynaptic signal transduction pathways that determine the responsiveness of striatal projection neurons to incoming stimuli, are currently unknown. Using cell-type-specific transcriptome analyses in a rodent model of chronic dopamine depletion, we identified large-scale gene expression changes, including neurotransmitter receptors, signal transduction cascades, and target proteins of dopamine signaling in striatonigral and striatopallidal neurons. Within the dopamine- and cAMP-regulated phosphoprotein of 32 kDa (DARPP-32) cascade of enzymes that plays a central role in signal integration of dopaminoceptive neurons multiple catalytic and regulatory subunits change their mRNA expression levels. In addition to the number of genes the fact that the alterations occur at multiple levels stresses the biological relevance of transcriptional regulation for adaptations of postsynaptic signaling pathways. The overall pattern of changes in both striatonigral and striatopallidal neurons is compatible with homeostatic mechanisms. In accordance with the distinct biological effects of dopamine D1 and D2 receptor stimulation, the alterations of the transcriptional profiles most likely result in prodopaminergic phosphorylation patterns. Our data provide insight into the disease-related plasticity of functional genomic networks in vivo that might contribute to the protracted preclinical phase of PD. In addition, the data have potential implications for the symptomatic treatment of the disease.
Introduction
The basal ganglia constitute a group of interconnected deep brain nuclei that control multiple aspects of motor behavior such as programming and execution of movements, or motor learning and motor memory (Albin et al., 1989; Graybiel, 2000). Dopamine (DA), a slow-acting neurotransmitter, provides critical input into the system as is evident from the loss of dopaminergic midbrain neurons in Parkinson's disease (PD) (Hirsch et al., 1988). In striatal projection neurons, which receive the bulk of DA innervation within the basal ganglia, postsynaptic effects of DA are conferred to a 32 kDa dopamine- and cAMP-regulated phosphoprotein (DARPP-32). Through interactions with multiple kinases and phosphatases DARPP-32 regulates the phosphorylation levels and thereby the activity of a broad range of target proteins (Greengard et al., 1999). In addition to DA, numerous neurotransmitters, peptides, and neuromodulators have been shown to provide input into DARPP-32-associated signal transduction cascades (Greengard et al., 1999). These data highlight the importance of DARPP-32 as a critical component of signal integration in striatal projection neurons.
Based on their axonal target areas, projection neurons in the striatum have been divided into a striatonigral and a striatopallidal pathway. The two populations express different subclasses of DA receptors, with different effects on DARPP-32-related signaling. D1 receptors in striatonigral neurons induce increased phosphorylation levels whereas the opposite is the case in D2-expressing striatopallidal neurons (Svenningsson et al., 2004; Bateup et al., 2008). As a result, DA target proteins are regulated in distinct ways, which has been demonstrated, among others, for voltage- and ligand-gated ion channels (Nicola et al., 2000), transcription factors (Valjent et al., 2000), and chromatin remodeling proteins (Bertran-Gonzalez et al., 2008). At the cellular level, differences in DA effects amount to differences in the regulation of resting membrane potential (Nicola et al., 2000), synaptic plasticity (Kreitzer and Malenka, 2007; Shen et al., 2008), or the morphology of the dendritic tree (Gertler et al., 2008).
The loss of DA innervation in the striatum, which is one of the pathophysiological hallmarks of PD causes anatomical (Ingham et al., 1998; Day et al., 2006) and functional alterations (Mallet et al., 2006; Shen et al., 2008) in projection neurons that are thought to have a profound impact on downstream target areas (Albin et al., 1989). The resulting abnormalities in firing patterns of neurons in the globus pallidus and the reticular part of the substantia nigra have been shown to be intricately linked to motor symptoms of the disease (Bergman et al., 1998; Brown, 2003).
Despite their clinical relevance the molecular mechanisms underlying the multitude of changes in striatal projection neurons are only partially understood. In an attempt to obtain a more complete picture of the molecular adaptations to DA depletion, we conducted microarray based transcriptome analyses in striatonigral and striatopallidal neurons in the rat 6-hydroxydopamine (6-OHDA) model of PD. The results revealed large numbers of differentially regulated genes that affected numerous neurotransmitter and signal transduction systems.
Materials and Methods
Generation of nigrostriatal lesions in rats.
Adult male Sprague Dawley rats weighing ∼275 g at the time of surgery were used in all experiments. Animal care followed National Institutes of Health (NIH) guidelines and all protocols were approved by the committee on animal studies of the Veterans Affairs San Diego Healthcare System, San Diego, CA and the University of California, Los Angeles animal care committee. Nigrostriatal lesions were induced by injection of 6-OHDA into the right median forebrain bundle as described previously (Dziewczapolski et al., 2003). In vivo, the degree of the lesion was evaluated by using a behavioral test for limb use asymmetry (Olsson et al., 1995). The test quantifies the number of adjusting steps during passive sliding movements of each forelimb over a distance of one meter. The difference between the control and lesion sides (as a percentage) is taken as the akinesia score. All animals included in the study had a contralateral forelimb akinesia >90%. Five to six weeks after the induction of the lesion animals were deeply anesthetized and killed as described below. The degree of the nigrostriatal lesion was verified histologically by quantitative analyses of immunohistochemical staining intensities for tyrosine hydroxylase in the striatum. For this purpose fresh frozen 10 μm sections from the area just rostral to the anterior commissure were mounted on plain glass slides and stored at −80°C until further usage. Before immunostaining sections were fixed for 10′ in 100% ethanol and rehydrated by 1′ incubations in decreasing ethanol concentrations (95%, 70%, 50%), followed by a final rinse in 1× PBS. The primary anti-tyrosine hydroxylase antibody was incubated overnight (4°C) at a dilution of 1:500 of the original concentration. Following 3 rinses in 1× PBS the secondary Cy3-labeled antibody was incubated at room temperature for 1 h. Sections were then rinsed 3 times in 1× PBS, dehydrated in increasing concentrations of ethanol (50%, 70%, 95%, and 100%), and air dried under light protection. Primary and secondary antibodies were purchased from Millipore Bioscience Research Reagents. Quantification of tyrosine hydroxylase immunoreactivity was performed in a ScanArray 4000 (Perkin-Elmer) or an Agilent DNA Microarray Scanner (Agilent). This procedure results in a reproducible quantification of fluorescent signal over three orders of magnitude. ImageJ software (NIH, Bethesda, MD) was used for quantitative image analyses of the dorsolateral striatum.
l-Dopa treatment of 6-OHDA-lesioned rats.
Five weeks after the induction of the nigrostriatal lesion, animals fulfilling the behavioral requirements of a sufficient lesion received two daily intraperitoneal injections of 25 mg/kg l-dopa methyl ester and 12.5 mg/kg benserazide at 12 h intervals for 3 weeks. The drugs were purchased from Sigma and dissolved in saline before the injection. Unlesioned and lesioned controls received vehicle injections. Animals were monitored for behavioral effects of l-dopa treatment at 1 and 2 weeks after the initiation of the drug application. Due to contralateral turning at peak l-dopa effects, orofacial dyskinesias were monitored during a brief restraining period. Tracer injections into the SNR were performed as described below. Animals were killed 2 h after the last drug/vehicle injection.
Retrograde tracing of striatonigral neurons.
Striatonigral neurons were positively identified by a retrograde tracer method using wheat-germ agglutinin coupled to horseradish peroxidase (WGA-HRP) (Vector Laboratories) in combination with a 3,3′,5,5′-tetramethylbenzidine (TMB) (Sigma) staining method (see next chapter). The nonfluorescent retrograde tracer was used for technical reasons. It allows the collection of labeled and unlabeled neurons from the same sections, which is important for distinguishing between the two types of projection neurons. With a fluorescent tracer technique the unlabeled neurons are difficult to identify and capture, as commonly used staining procedures such as Nissl result in a substantial reduction of the fluorescent signal. In addition, the WGA-HRP technique has no time window for the capturing procedure, which improves the precision of the capturing and therefore the purity of the samples. The sensitivity of the WGA-HRP method in combination with the TMB staining is similar to that of fluorescent tracers. Two days before termination of the experiment, WGA-HRP was injected into the right substantia nigra (SN) of control and lesioned animals at 5.8 mm caudal, 0.25 mm lateral, and 8.1 mm ventral of bregma with the tooth-bar set at −4.0 mm. Approximately 60 nl of the tracer were injected using a Picospritzer II (Parker Hannifin). The correct localization of the injection sites was verified histologically (supplemental Fig. S1, available at www.jneurosci.org as supplemental material).
Laser-capture microdissection of distinct neuronal cell types in the striatum.
Tissue preparation, Nissl staining of sections, and laser-capture microdissection (LCM) were performed as reported previously (Kamme et al., 2004; Meurers et al., 2009). The retrograde tracer WGA-HRP was visualized by peroxidase induced precipitation of TMB. Fresh-frozen sections (10 μm) were fixed in 100% ethanol as described above and subsequently incubated with 0.01% TMB, 0.05% ammonium paratungstate, and 0.006% H2O2 in 0.1 m phosphate buffer at pH 6.0 for 10 min. A 0.2% stock solution of TMB was made in 100% EtOH; ammonium paratungstate was prepared as a 1% stock solution in H2O. The TMB working solution was mixed just before application to the sections. In addition to the tracer labeling, sections were Nissl stained for visualization of WGA-HRP-negative neurons. All chemicals were purchased from Sigma. Striatonigral neurons were identified by their TMB-positive (black) cell bodies, whereas striatopallidal neurons appeared as TMB-negative Nissl-stained medium-sized neurons (Gerfen et al., 1990). Because the distinction between the two types of neurons depends on a sufficient labeling of striatonigral neurons, only animals that had 40–45% of medium-sized neurons in the dorsal striatum marked as striatonigral were used for capturing of tracer-negative Nissl-stained neurons. Following these guidelines striatonigral neurons were collected from 5 animals, whereas striatopallidal neurons were captured only from 3 animals. In the latter, both types of neurons were captured from the same sections. The correct phenotype of striatonigral and striatopallidal neurons was verified by quantitative PCR (qPCR) analyses of the marker genes dynorphin, enkephalin, and the D1 (Drd1) and D2 (Drd2) dopamine receptors as described below.
Attempts to label striatopallidal neurons by tracer injections into the globus pallidus did not result in a sufficient separation of the two pathways. Comparisons of the expression data from control and lesioned animals were very similar to those of the randomly selected total striatal population (data not shown). This lack of differentiation between the two types of projection neurons was recently confirmed in both tracer and antidromic stimulation experiments (Ballion et al., 2008).
In addition to striatonigral and striatopallidal neurons, samples representing the entire pool of projection neurons were generated by LCM of randomly selected medium-sized neurons from Nissl-stained sections (n = 3 in each treatment group). For all LCM–array experiments, samples consisted of pooled sets of ∼200 individually captured neurons that were collected from the dorsolateral area of the striatum just rostral of the anterior commissure (bregma +0.2 to +0.3). Samples for qPCR analyses consisted on average of 50–200 neurons for each gene.
Gene expression profiling of striatal neurons.
RNA extraction, two rounds of T7-based RNA amplification, RNA labeling, and microarray hybridization were performed as previously reported (Kamme et al., 2003; Meurers et al., 2009). The custom made cDNA arrays contained a total number of 6937 clones. The experimental design that contained replicates at various levels is depicted in supplemental Figure S2 (available at www.jneurosci.org as supplemental material). Following overnight hybridization slides were scanned with an Agilent G2565AA Microarray Scanner (Agilent Technologies). Fluorescence intensity for each feature on the array was obtained by using Imagene5.5 software (Biodiscovery), and analyzed by in-house-developed QC algorithms (Bittner et al., 2004).
Statistical analyses of array data.
All raw data were log2 transformed before analyses. The 4 replicate data points generated from hybridizations of each sample on duplicate arrays (supplemental Fig. S2, available at www.jneurosci.org as supplemental material) were treated as technical replicates and normalized using a smooth-spline function in S-Plus software (Tibco). The entire data were then normalized across the different samples by adjusting the 75th quantiles of each array to log2100. To filter out genes that are differentially regulated between the control and lesion groups, a nested ANOVA analysis was applied and a gene was considered significantly changed when its p value for the treatment (control vs lesion) effect was smaller than 0.05. In addition, the average value of the hybridization signal intensity had to be above the average plant gene background in at least one of the two treatment groups. The suitability of the ANOVA model was assessed by comparisons with results from t test algorithms assuming either equal or unequal variance. All statistical analyses were performed using S-plus (Tibco). Cluster analyses were performed on Cluster software version 2.11, developed by Michael Eisen (Eisen et al., 1998).
Quantitative PCR analyses of gene expression.
qPCR experiments were performed in a Smart Cycler (Cepheid) as described by Kamme et al. (2003) or an ABI Prism 7900HT sequence detection system using the Roche LightCycler FastStart DNA MasterPLUS SYBR Green I mix (Roche Diagnostics). cDNA derived from 2-round amplified RNA and nonamplified RNA from laser-capture microdissected neurons served as template in the qPCR experiments. For the nonamplified templates an average of 50–200 neurons were used for each gene. Before qPCR analyses cDNA synthesis products were purified on QIAquick PCR purification columns (Qiagen). All reactions including those for RNA normalization and plasmid standards were performed in triplicates. Aldo-keto reductase 1a1 (aldehyde reductase) and peptidylprolyl isomerase A (cyclophilin A) were used for normalization of RNA content. These genes were chosen because they are abundantly expressed and the results of the prior array analyses demonstrated a lack of treatment-dependent changes in expression levels. Size and purity of the PCR products were verified by gel electrophoresis. Standard curves for absolute quantification were generated from 10-fold serial plasmid dilutions for each gene. Statistical significance of group differences was determined by Student's t tests (Microsoft Excel) using p values <0.05 as a cutoff.
Results
Identification of striatonigral and striatopallidal neurons
Differential labeling of striatonigral and striatopallidal projection neurons was achieved by a retrograde tracer method that has previously been shown to result in a sufficient separation of the two pathways (Gerfen et al., 1990; Schiffmann and Vanderhaeghen, 1993). Injection of wheat-germ agglutinin coupled to horseradish peroxidase (WGA-HRP) into the substantia nigra resulted in a positive identification of cell bodies that send their axons to this area. Neurons that project exclusively to the globus pallidus appeared as Nissl-stained WGA-HRP-negative medium-sized cells (Gerfen et al., 1990; Kawaguchi et al., 1990). Samples of striatonigral and striatopallidal neurons were generated from double-labeled sections by laser-capture microdissection (Kamme et al., 2004; Meurers et al., 2009) of individual neurons that were pooled to sample sizes of 50 cells (Fig. 1A–D).
Figure 1.
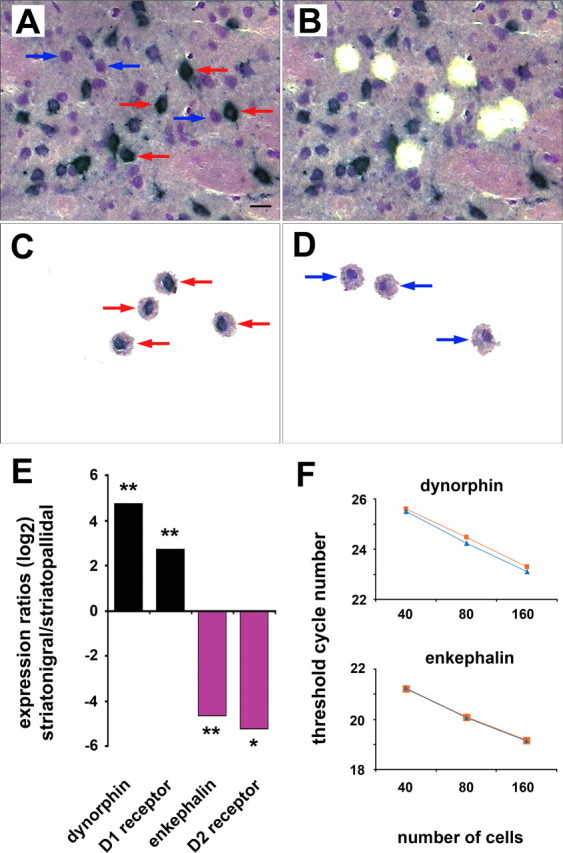
Identification and phenotypic verification of striatonigral and striatopallidal projections neurons. A, Striatonigral neurons appear as WGA-HRP-positive cells with a black TMB precipitate (red arrows). Striatopallidal neurons are TMB-negative Nissl-stained medium-sized cells (blue arrows). Twenty-four of 43 (56%) medium-sized neurons are positive for TMB, demonstrating a high labeling efficiency of striatonigral neurons. Shown is a 10 μm fresh-frozen TMB- and Nissl-stained section. Scale bar, 20 μm. B, Same section as A after individual dissection of striatonigral and striatopallidal neurons. C, D, Captured striatonigral (C) and striatopallidal (D) neurons. E, qPCR analyses of dynorphin, enkephalin, dopamine D1, and dopamine D2 receptor mRNA expression levels in striatonigral and striatopallidal neurons of 3 normal control animals. Each sample contained 50 neurons. * and ** indicate p values <0.05 and 0.01, respectively (Student's t test). F, Assessment of reproducibility of qPCR measurements from LCM samples. Dynorphin and enkephalin mRNA quantities were analyzed in striatonigral and striatopallidal neurons, respectively. Blue and orange graphs represent data from duplicates samples for each cell number. Threshold cycle numbers were determined by the ABI Prism 7900HT sequence detection system software.
The correct phenotype of the two populations was verified by qPCR analyses of dopamine D1 (Drd1) and D2 (Drd2) receptor as well as dynorphin and enkephalin mRNA expression levels. The dopamine receptors and the two peptides have previously been identified as markers for striatonigral and striatopallidal neurons, respectively (Gerfen and Young, 1988; Gerfen et al., 1990). In accordance with these data, our qPCR experiments revealed large differences in mRNA levels for all four genes (Fig. 1E). Expression was, however, not exclusive, which is in agreement with reports about overlapping expression of marker genes in the two pathways (Gerfen and Young, 1988; Surmeier et al., 1996).
The reproducibility of the LCM–qPCR technology was tested in separate experiments for both genes. Neuronal samples with twofold increments in cell numbers, ranging from 40 to 160 neurons per sample, resulted in consistent decrements of the detection threshold for the respective gene products. For both genes, the amplification efficiency was close to the theoretical maximum of 1 (1.17 ± 0.035 for dynorphin and 1.04 ± 0.063 for enkephalin (median ± SEM); n = 2 for each cell number) (Fig. 1F). Similar results were obtained for the Drd1 and Drd2 genes (data not shown).
These data confirm the validity of the retrograde tracing procedure for identifying striatonigral and striatopallidal neurons and demonstrate the high reproducibility of the LCM–qPCR procedure.
Retrograde tract tracing does not change the gene expression profile of labeled neurons
Using an in vivo retrograde tracing method to identify neurons for gene array-based transcriptional profiling experiments raises the question, whether the labeling procedure itself causes changes in gene expression patterns. This concern is reinforced by sporadic reports in the literature that certain tracers seem to be cytotoxic (Garrett et al., 1991). We addressed the issue in a three-way comparison between different populations of striatal neurons from control and tracer-injected animals (Fig. 2A), thus avoiding the technical difficulty of having to identify the exact same type of neurons by different labeling methods or marker genes. Only consistent changes in comparisons 2 and 3 (Fig. 2A) were regarded as being due to the retrograde labeling procedure. The fact that potential tracer-induced changes are identified in two independent comparisons substantially reduces the level of noise in the data. Striatonigral neurons were collected as described above. Samples representing the total neuronal population were generated by laser-capture microdissection of randomly selected medium-sized cells from Nissl-stained sections of control and tracer-injected animals. All samples (n = 2 animals for all three sample types) consisted of 200 individually dissected cells. The amplified RNA was hybridized to cDNA microarrays containing 6937 clones.
Figure 2.

Impact of retrograde tracing on gene expression profiles. A, Experimental design. Comparisons of microarray data from retrogradely labeled striatonigral neurons (a) and randomly selected medium-sized striatal neurons from WGA-HRP-injected tract tracing (b) and normal control animals (c). All samples contained 200 neurons (n = 2 animals). Genes changed by the tract tracing (tt) procedure will be detected in comparisons 2 and 3. B, Average correlation coefficients (R2) for all individual samples of comparisons 1–3 and all duplicate samples within each group (a–c).
The average correlation coefficients (R2) for comparisons 1 and 2 (Fig. 2B) demonstrate the difference in expression profiles between striatonigral neurons and the total striatal population. In contrast, the much higher average R2 value for comparison 3, which is close to the value for all technical replicates, suggests a high degree of similarity between the total populations of striatal neurons from control and tracer-injected animals. A detailed statistical analysis of the data revealed only nine genes with consistent differences in mRNA levels in comparisons 2 and 3. The genes and their respective expression changes are listed in supplemental Table S1 (available at www.jneurosci.org as supplemental material). Functionally, some of these genes have been implicated in growth regulation (Ccng1, Mx2) (Kobayashi et al., 2004; Ohtsuka et al., 2004), neurite outgrowth (Cspg5) (Ichihara-Tanaka et al., 2006), and interferon-inducible antiviral responses (Mx2, Rsad2) (Aebi et al., 1989; Helbig et al., 2005). None of the affected genes is involved in neurotransmitter signal transduction.
These results demonstrate that retrograde labeling of neurons with WGA-HRP does not induce substantial alterations in gene expression profiles and is therefore suitable for transcriptome analyses of neuronal phenotypes that are defined by their axonal target areas.
Chronic dopamine depletion causes large-scale transcriptional alterations in striatonigral and striatopallidal neurons
The effects of dopamine depletion on striatal target neurons were analyzed in rats with a unilateral 6-OHDA lesion (Schwarting and Huston, 1996). In vivo, the degree of the lesion was evaluated by using a behavioral test for limb use asymmetry (Olsson et al., 1995). This procedure was chosen to avoid potential drug-induced alterations of gene expression patterns that might be associated with conventional testing of rotational behavior elicited by dopamine agonists. Treatment with dopamine agonists has been shown to result in long lasting changes of behavioral responses to subsequent drug applications (Morelli and Di Chiara, 1987). The mean behavioral score, expressed as percentage difference of the lesioned and nonlesioned sides, of all 6-OHDA-treated animals used in this study was 96.64 ± 1.02% (mean ± SEM). Quantitative histological analysis of tyrosine hydroxylase immunoreactivity in the striatum confirmed the efficacy of the lesioning procedure. In accordance with the behavioral data all animals had a >90% [94.78 ± 0.19% (mean ± SEM)] decrease in tyrosine hydroxylase immunoreactivity in the striatum. Experiments were performed 5–6 weeks after the induction of the lesion. Separate samples of 200 striatonigral and striatopallidal neurons were collected from the dorsolateral striatum just rostral of the anterior commissure as described above (Fig. 1A–D). The design of the microarray experiments including animal and array numbers is depicted in supplemental Figure S2 (available at www.jneurosci.org as supplemental material).
Hierarchical cluster analyses (Eisen et al., 1998), which were performed as an initial screen of the dataset revealed a complete segregation of the two treatment groups in both types of projection neurons (Fig. 3A). The results provide evidence for the homogeneous composition of the samples and the reproducibility of the LCM–array technology. In addition, the robust treatment effects are indicative of relatively large-scale changes in gene expression profiles, which were confirmed by more detailed statistical analyses. The total numbers of 497 and 558 differentially regulated genes (Fig. 3B) represented 11.7% and 14.5% of all genes expressed above background level in striatonigral and striatopallidal neurons, respectively. Similar percentages of genes showed upregulated and downregulated mRNA levels in both cell types (striatonigral neurons: 44% upregulated and 56% downregulated, striatopallidal neurons: 46% upregulated and 54% downregulated). Overlapping changes between the two populations that occurred in the same and in opposite directions were found for 88 genes (Fig. 3B). Thus the percentages of unique changes amounted to 89.6% and 90.7% in striatonigral and striatopallidal neurons, respectively. The data indicate that the two types of neurons responded very differently to chronic dopamine depletion.
Figure 3.

DA depletion induced gene expression changes in striatonigral and striatopallidal neurons. A, Results of hierarchical cluster analyses in striatonigral (STR-SNR) (n = 5) and striatopallidal (STR-GP) (n = 3) neurons. The dendrogram at the top represents the relative distance between samples. Analyses were performed with average expression values of each animal. For further details about the experimental design (animal and array numbers), see supplemental Figure S2 (available at www.jneurosci.org as supplemental material). Red and blue colors indicate increased and decreased expression values compared with the group mean. B, Numbers of differentially regulated genes with statistically significant differences in striatonigral (yellow) and striatopallidal (blue) neurons. Overlapping changes in the same and opposite directions are indicated by green and orange colors, respectively. C, D, Fold changes of all differentially regulated genes with statistically significant differences in striatonigral and striatopallidal neurons. E, Statistically significant changes in neuropeptide expression. F, Numbers of significantly regulated genes in distinct functional groups of genes.
In contrast to the robust change in pattern, the overall size of the individual changes in mRNA levels was rather small (Fig. 3C,D). With few exceptions, they did not exceed twofold increases or decreases. This pattern of large-scale, small-amplitude transcriptional alterations is consistent with relatively mild functional abnormalities that have been described in various diseases or disease-associated conditions of the CNS, such as schizophrenia or chronic morphine exposure (Mirnics et al., 2000; McClung et al., 2005).
Differential gene expression was detected in a broad range of functional groups, such as neurotransmitter and peptide receptors, ion channels, postsynaptic signal transduction, cytoskeletal structure, transport mechanisms, and synaptic neurotransmitter release. In particular the large number of receptors affected by the transcriptional alterations (Table 1) demonstrates the scope of the adaptive response that involved multiple intrastriatal and extrastriatal neurotransmitter systems. Overall the biggest changes in both types of projection neurons occurred in neuropeptide gene expression (Fig. 3E). Two of these genes, follistatin and neuromedin U, have previously not been associated with chronic DA depletion.
Table 1.
Dopamine depletion induced changes in receptor gene expression of striatonigral (STR-SNR) and striatopallidal (STR-GP) neurons
| Cell type | Expression level |
Ratio (log2) | p value (ANOVA) | Entrez gene ID | Neurotransmitter | |
|---|---|---|---|---|---|---|
| Control | Lesion | |||||
| STR-SNR | 35.6 | 42.5 | 0.253 | 0.041 | Chrna1 | Acetylcholine |
| STR-SNR | 56.7 | 45.1 | −0.327 | 0.037 | Gabbr1 | GABA |
| STR-SNR | 34.2 | 55.7 | 0.701 | 0.001 | Gipr | Gip |
| STR-SNR | 83.8 | 97.4 | 0.216 | 0.013 | Gria1 | Glutamate |
| STR-SNR | 299.6 | 352.6 | 0.234 | 0.011 | Gria4 | Glutamate |
| STR-SNR | 206.6 | 271.7 | 0.384 | 0.045 | Grin1 | Glutamate |
| STR-SNR | 47.2 | 40.6 | −0.219 | 0.046 | Grm4 | Glutamate |
| STR-SNR | 198.6 | 148.1 | −0.424 | 0.014 | Grm7 | Glutamate |
| STR-SNR | 104.2 | 129.6 | 0.313 | 0.003 | Gpr22 | Orphan GPR |
| STR-SNR | 42.6 | 29.3 | −0.537 | 0.011 | Gpr68 | Orphan GPR |
| STR-SNR | 440.2 | 810.9 | 0.881 | 2.00 × 10⁻⁵ | Hrh3 | Histamine |
| STR-SNR | 167.3 | 211.8 | 0.339 | 0.001 | Igf1r | Igf1 |
| STR-SNR | 491.9 | 580.5 | 0.238 | 0.013 | Npr3 | Natriur. peptide |
| STR-SNR | 144.4 | 96.4 | −0.583 | 0.001 | Ntsr2 | Neurotensin |
| STR-SNR | 47.8 | 66.5 | 0.476 | 0.048 | Opkr1 | Opioids |
| STR-GP | 275.6 | 230.8 | −0.255 | 0.008 | Adra2c | Adrenaline |
| STR-GP | 1459.2 | 1806.6 | 0.308 | 0.048 | Folr1 | Folate |
| STR-GP | 104.6 | 87.7 | −0.253 | 0.015 | Gabrb1 | GABA |
| STR-GP | 76.5 | 89.4 | 0.224 | 0.003 | Gabrg2 | GABA |
| STR-GP | 235.6 | 141.5 | −0.735 | 0.006 | Gabrd | GABA |
| STR-GP | 147.4 | 233.5 | 0.663 | 0.005 | Grik2 | Glutamate |
| STR-GP | 146.4 | 102.2 | −0.518 | 0.007 | Ldlr | VLDL |
| STR-GP | 123.5 | 69.7 | −0.825 | 0.002 | LOC293546 | Orphan GPR |
| STR-SNR | 83.1 | 101.7 | 0.293 | 0.019 | GPR12 | Orphan GPR |
| STR-GP | 69.4 | 111.4 | 0.683 | 0.011 | ||
| STR-SNR | 166.1 | 229.6 | 0.434 | 0.013 | Gucy1a3 | Nitric oxide |
| STR-GP | 244.8 | 168.8 | −0.575 | 0.029 | ||
| STR-SNR | 104.2 | 60.1 | −0.795 | 0.008 | Mchr1 | mch |
| STR-GP | 103.5 | 125.8 | 0.281 | 0.018 | ||
GPR, G-protein-coupled receptor; Gip, gastric inhibitory polypeptide; Igf1, insulin-like growth factor; mch, melanin-concentrating hormone; Natriur., natriuretic; VLDL, very-low-density lipoprotein.
Analyses of gene clusters that were grouped by biological functions revealed that changes in receptor and ion channel gene expression were more dissimilar between the two cell types than those for cytoskeletal and synaptic neurotransmitter release-associated genes (Fig. 3F, Tables 1, 2; supplemental Table S2A,B, available at www.jneurosci.org as supplemental material). In addition to ion channels and receptors greater disparity was also found for genes involved in protein kinase A (PKA)/DARPP-32/protein phosphatase 1 (PP1) signaling pathways (see Fig. 5A,B). These data suggest that structural adaptations are more similar than those in signal transduction.
Table 2.
Dopamine depletion induced changes in ion channel gene expression of striatonigral (STR-SNR) and striatopallidal (STR-GP) neurons
| Cell type | Expression level |
Ratio (log2) | p value (ANOVA) | Entrez gene ID | |
|---|---|---|---|---|---|
| Control | Lesion | ||||
| STR-SNR | 64.5 | 77.6 | 0.266 | 0.049 | Cacna2d2 |
| STR-SNR | 68.5 | 82.9 | 0.276 | 0.001 | Cacna2d3 |
| STR-SNR | 53.9 | 39.4 | −0.449 | 0.005 | Cacng1 |
| STR-SNR | 33.8 | 26.4 | −0.353 | 0.037 | Kcnn3 |
| STR-SNR | 164 | 202.4 | 0.303 | 0.014 | Kcnk1 |
| STR-SNR | 27.3 | 37.9 | 0.474 | 0.004 | Kcnab3 |
| STR-SNR | 416.3 | 524.1 | 0.331 | 0.047 | Scn9a |
| STR-SNR | 127.5 | 94.4 | −0.432 | 0.016 | Scn1b |
| STR-SNR | 196.1 | 161.3 | −0.281 | 0.019 | Scn1a |
| STR-SNR | 114.7 | 85.2 | −0.428 | 0.002 | Trpv1 |
| STR-GP | 516.8 | 470.8 | −0.134 | 0.049 | Clcn3 |
| STR-GP | 74.6 | 67.6 | −0.142 | 0.027 | Kcnk6 |
| STR-GP | 118.9 | 103.4 | −0.201 | 0.033 | Kcna1 |
| STR-GP | 142.5 | 121.7 | −0.227 | 0.046 | Kcnd2 |
| STR-SNR | 54.9 | 68.3 | 0.315 | 0.013 | |
| STR-GP | 109.7 | 70.5 | −0.637 | 0.003 | Accn1 |
| STR-SNR | 59.3 | 52.9 | −0.163 | 0.028 | |
| STR-GP | 47.3 | 69.3 | 0.549 | 0.001 | Cacnb1 |
| STR-SNR | 113.3 | 150.7 | 0.411 | 0.011 | |
| STR-GP | 120.5 | 89.5 | −0.428 | 0.045 | Kcnk2 |
Figure 5.
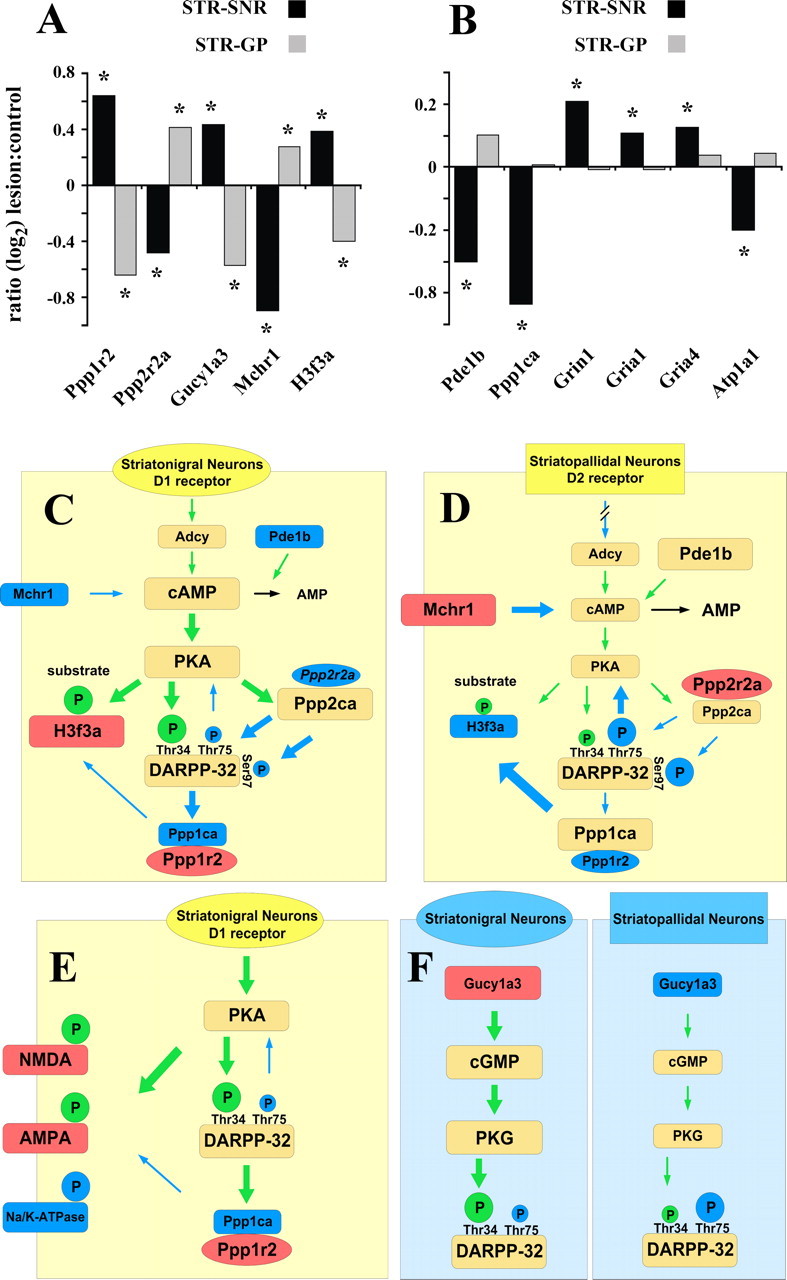
Expression changes of genes associated with DARPP-32 signal transduction and their prospective functional effects within the signaling cascades. A, Microarray data of DARPP-32-associated genes that change in opposite directions in striatonigral and striatopallidal neurons. Group sizes for the array experiments are n = 5 for striatonigral and n = 3 for striatopallidal neurons. * indicates significant differences (p < 0.05; Student's t test). B, Array data for genes that changed exclusively in striatonigral neurons. C–F, Association of altered gene expression levels and published functions of DARPP-32-related genes. Blue fill color of boxes/ovals reflects decreased and red color indicates increased expression levels. Green and blue arrows depict stimulatory and inhibitory effects, respectively, and arrow sizes reflect the quantitative aspect of the effect. Circled P symbolizes a phosphate group with the size of the circle indicating the degree of phosphorylation. Green and blue fill colors of the circles indicate phosphorylation-mediated activation and deactivation, respectively. C, D, Potential effects of expression changes in cAMP/PKA/DARPP-32/PP1-related genes in striatonigral (C) and striatopallidal (D) neurons. E, Expression changes of DA target genes in relation to the effects of DA-mediated phosphorylation on the respective gene products in striatonigral neurons. F, Impact of altered guanylate cyclase expression on PKG/DARPP-32 signaling.
Of all the differentially regulated genes ion channels are among the most likely candidates to have a direct impact on neuronal firing properties. Within this family of genes our analyses identified a bimodal change in expression levels of the tandem-pore-domain potassium channel, Kcnk2 (Table 2). In addition to Kcnk2 other members of the same family changed in equivalent directions in both types of neurons. In accordance with the upregulated expression of Kcnk2 the mRNA level of Kcnk1 is increased in striatonigral neurons, whereas the decreased expression of Kcnk2 in striatopallidal neurons is matched by a reduced mRNA abundance of Kcnk6 (Table 2). Through time- and voltage-independent “leak” currents the channels have been shown to affect resting membrane potential and cellular excitability (Goldstein et al., 2001). Thus the transcriptional changes in striatonigral and striatopallidal neurons will potentially result in alterations of neuronal responsiveness to incoming stimuli.
In summary our data demonstrate that chronic dopamine depletion causes robust transcriptional alterations that are most prominent in functions associated with cellular signaling pathways.
Validation of microarray data
Microarray experiments with small sample sizes and small changes in gene expression levels are often not amenable to a statistical evaluation of the false discovery rate. Comparable to previously published datasets (Mootha et al., 2003) the application of multiple comparison corrections did not result in statistically significant differences between the two treatment groups in our experiments. We therefore pursued three different experimental strategies to ensure the validity of our array data.
First, we performed an “in silico validation” (Chuaqui et al., 2002) of the results. Genes that had previously been reported to change their mRNA levels in response to chronic dopamine depletion were also detected by our technology (data not shown).
Second, comparisons of array results from striatonigral neurons with data obtained from randomly selected striatal neurons that represent the entire population provided an estimate of the reproducibility of the LCM–array technology (Fig. 4A). The approach is based on the assumption that genes found to be differentially expressed in a subpopulation that comprises ∼45% of all striatal neurons should at least in part be detectable in the total population. A detailed analysis of the two datasets showed that 75.4% of all significantly regulated genes in striatonigral neurons changed in the same direction in the total population. In addition to providing a high-throughput validation with an independent neuronal population and a different staining technique the comparison depicted in Figure 4A also demonstrates that increasing the cellular specificity of the samples increased the sensitivity of detecting differential gene expression. Most of the fold changes in striatonigral neurons were substantially larger than those detected in the total population. Two reasons, exemplified in Tables 3 and 4, seemed to account for this phenomenon. First, the change in expression in one population was diluted by the lack of regulation in the other and, second, transcriptional regulation occurred in opposite directions in both types of neurons and was therefore not detectable at the level of the total population.
Figure 4.

Experimental validation of microarray data. A, Comparison of gene expression ratios from control and 6-OHDA-treated animals in the subpopulation of striatonigral neurons and the total population of striatal medium-sized neurons. The former represent ∼45% of the total population. Depicted are all genes with significant changes in the striatonigral population for which the changes in the total population occurred in the same direction (75.4% of all significantly regulated genes). B, qPCR validation of array data from control and 6-OHDA-treated animals in the total population of striatal neurons (n = 3). qPCR experiments were performed with the same amplified RNA that was used for the array hybridization or nonamplified RNA from recaptured neurons of the same animals. All differences were statistically significantly different (p < 0.05) except for the Cnr1 data from nonamplified RNA (Student's t test).
Table 3.
Dilution effects of unchanged expression in one subpopulation on differential gene expression in the other
| Cell type | Expression level |
Ratio (log2) | p value (ANOVA) | Annotation | |
|---|---|---|---|---|---|
| Control | Lesion | ||||
| Total pop. | 94.59 | 89.29 | 0.083 | 0.711 | |
| STR-SNR | 154.66 | 92.32 | 0.744 | 0.013 | Ntsr2 |
| STR-GP | 110.26 | 95.17 | 0.212 | 0.15 | |
| Total pop. | 85.01 | 87.53 | −0.042 | 0.792 | |
| STR-SNR | 119.27 | 125.27 | −0.071 | 0.677 | |
| STR-GP | 85.59 | 42.38 | 1.014 | 1.30 × 10⁻⁵ | Csnk2b |
| Total pop. | 143.92 | 148.91 | −0.049 | 0.979 | |
| STR-SNR | 92.67 | 149.35 | −0.689 | 0.032 | |
| STR-GP | 95.32 | 88.59 | 0.106 | 0.737 | Tmsb10 |
| Total pop. | 118.4 | 128.93 | −0.123 | 0.72 | |
| STR-SNR | 133.14 | 206.97 | −0.636 | 0.016 | |
| STR-GP | 470.12 | 467.18 | 0.009 | 0.872 | Nap1l1 |
| Total pop. | 201.11 | 190.8 | 0.076 | 0.906 | |
| STR-SNR | 174.82 | 163.13 | 0.1 | 0.531 | |
| STR-GP | 53.14 | 37.52 | 0.513 | 0.001 | Gstp2 |
pop., Population.
Table 4.
Annihilating effects of changes in opposite directions
| Cell type | Expression level |
Ratio (log2) | p value (ANOVA) | Annotation | |
|---|---|---|---|---|---|
| Control | Lesion | ||||
| Total pop. | 177.48 | 170.76 | 0.056 | 0.57 | |
| STR-SNR | 266.94 | 343.31 | 0.386 | 0.014 | Similar to NADH:ubiquinone oxidoreductase B15 subunit |
| STR-GP | 132.41 | 101.29 | −0.363 | 0.011 | B15 subunit |
| Total pop. | 86.47 | 79.61 | 0.119 | 0.404 | |
| STR-SNR | 57.84 | 43.12 | −0.44 | 0.002 | |
| STR-GP | 55.54 | 75.35 | 0.423 | 9.10 × 10⁻⁴ | epoxide hydrolase 1 |
| Total pop. | 90.88 | 87.55 | 0.054 | 0.837 | |
| STR-SNR | 77.2 | 56.27 | −0.832 | 0.017 | |
| STR-GP | 75.85 | 135.01 | 0.456 | 0.042 | cyclin D2 |
| Total pop. | 159.71 | 169.27 | −0.084 | 0.702 | |
| STR-SNR | 141.62 | 93.59 | −0.861 | 0.049 | |
| STR-GP | 167.53 | 304.19 | 0.597 | 0.015 | decorin |
| Total pop. | 413.72 | 434.41 | −0.07 | 0.473 | |
| STR-SNR | 172.11 | 230.76 | 0.58 | 0.02 | |
| STR-GP | 242.07 | 161.91 | −0.423 | 0.026 | guanylate cyclase 1, soluble, alpha 3 |
pop., Population.
A third line of evidence for the validity of our array results is provided by qPCR analyses. The genes chosen for these experiments covered a wide range of fold changes (1.3- to 3.7-fold). In the population of total striatal neurons the array data (n = 3) could be confirmed for 11 of 12 genes (Fig. 4B). These experiments were performed with the amplified RNA samples (n = 3) used for array hybridization as well as nonamplified material from recaptured neurons (n = 3). The latter samples were included to rule out effects of cell sampling and RNA amplification. qPCR analyses also confirmed the array data for three genes that changed their expression levels in opposite directions in striatonigral and striatopallidal neurons (see Fig. 6A,B). These experiments were performed in a separate set of animals (n = 4).
Figure 6.

qPCR expression analyses of genes associated with DARPP-32 signal transduction after l-dopa treatment. A, B, qPCR experiments were conducted with nonamplified samples from striatonigral (A) and striatopallidal (B) neurons in a different set of animals (n = 4 for all treatment groups and cell types). Each sample contained ∼100 neurons. * indicates p values <0.05 (Student's t test).
In addition to these experimental approaches the suitability of our statistical instruments was evaluated by comparing the results of three different algorithms. All three tests returned very similar sets of significantly regulated genes (supplemental Fig. S3, available at www.jneurosci.org as supplemental material).
Together these data provide solid evidence for the validity or our array data and demonstrate that cellular specificity is a crucial component for detecting differential gene expression in complex neuroanatomical structures.
Transcriptional regulation of genes involved in DARPP-32-related postsynaptic signal transduction occurs at multiple levels
Within the dopamine-related postsynaptic signal transduction cascades of striatal projection neurons, the loss of dopaminergic innervation caused numerous transcriptional alterations. The responses in striatonigral and striatopallidal neurons either involved different genes or identical genes with changes in opposite directions (Fig. 5A,B). Functionally these genes can be divided into three categories: genes that are part of the PKA/DARPP-32/PP1 signaling cascade (Fig. 5C,D), neurotransmitter systems other than dopamine that feed into the DARPP-32 cascade (Fig. 5C,D,F), and target proteins of PKA/PP1 regulated phosphorylation (Fig. 5E). Figure 5C–F depicts the potential impact of the altered expression levels on signal transduction based on the functional profiles of the individual gene products.
In the first category, we identified several regulatory and catalytic subunits of the DARPP-32 cascade with altered transcriptional profiles. Ppp1r2 and Ppp2r2a, two inhibitory subunits of the protein phosphatases 1 (Huang and Glinsmann, 1976) and 2A (Kamibayashi et al., 1992), changed their expression levels in opposite directions in striatonigral and striatopallidal neurons (Fig. 5A,C,D). In addition, one of the catalytic α subunits of PP1 (Ppp1ca) and the phosphodiesterase 1b (Pde1b), which metabolizes cAMP (Reed et al., 2002), altered their expression exclusively in striatonigral neurons (Fig. 5B,C).
Transcriptional regulation also occurred in two neurotransmitter systems with functional connections to DARPP-32/PP1-mediated signaling. The gene encoding the melatonin-concentrating hormone receptor 1 (Mchr1) showed opposing changes in expression levels in the two types of projection neurons (Fig. 5A). The receptor, which has been shown to be abundantly expressed in the dorsal striatum of the rat (Hervieu et al., 2000) is coupled to G(α)i and/or G(α)q proteins and thus decreases intracellular cAMP levels (Saito et al., 1999) (Fig. 5C,D). Compared with the Mchr1 data the direction of changes is reversed for the α3 subunit of guanylate cyclase 1 (Gucy1a3) (Fig. 5A). The enzyme mediates the postsynaptic effects of nitric oxide (NO) signaling (Nakane et al., 1990) and causes an increased phosphorylation of DARPP-32 at threonine residue 34 via cyclic guanosine monophosphate formation and protein kinase G activation (Greengard et al., 1999) (Fig. 5F).
Several genes coding for known target proteins of PKA/DARPP-32/PP1-mediated phosphorylation showed altered transcription levels after chronic DA depletion (Fig. 5A,C–E). As a general pattern, the direction of these changes correlated with the effect of phosphorylation on the respective proteins, i.e., proteins that are activated by phosphorylation showed increased mRNA expression levels and vice versa. Histone H3, which is functionally upregulated by increased phosphorylation (Nowak and Corces, 2004) has recently been shown to be subject to DARPP-32-dependent DA signaling. D1 receptor stimulation in striatonigral neurons results in increased phosphorylation, whereas D2 receptor stimulation in striatopallidal neurons has the opposite effect (Bertran-Gonzalez et al., 2008). In our dataset the expression of H3f3a, a member of the histone H3 family of genes, showed opposing changes in the two pathways, with increased and decreased mRNA levels occurring in striatonigral and striatopallidal neurons, respectively (Fig. 5A,C,D). In addition to H3f3a the same pattern was observed for several genes that changed exclusively in striatonigral neurons. mRNA expression levels of 3 different NMDA- (Grin1) and AMPA-type (Gria1 and Gria4) glutamate receptor subunits were found to be increased in these neurons (Fig. 5B,E). Both types of receptors have previously been demonstrated to be subject to PKA/DARPP-32/PP1 regulation (Greengard et al., 1999). The upregulation of NMDA receptor function has been shown to be mediated by phosphorylation of the NR1 (Grin1) subunit (Greengard et al., 1999). Similarly, AMPA receptor activity is increased through PKA-dependent mechanisms. Phosphorylation of its Gria1 subunit causes an increase in peak currents (Roche et al., 1996), whereas phosphorylation of the Gria4 subunit stimulates synaptic incorporation of the receptor (Esteban et al., 2003). In contrast to NMDA and AMPA receptors, activity levels of the Na+,K+-ATPase are downregulated by increased phosphorylation (Greengard et al., 1999). In our experiments the α1 subunit of Na+,K+-ATPase (Atp1a1) showed a decreased mRNA expression level (Fig. 5B,E).
Together these data demonstrate that chronic dopamine depletion of striatal projection neurons caused multiple transcriptional alterations within postsynaptic DARPP-32-related signal transduction systems. The responses occur in a cell-type-specific manner either through bimodal regulation of the same genes or selective changes in one of the two populations.
l-Dopa treatment causes a cell-type-specific reversion of gene expression changes
To test the effects of chronic l-dopa treatment on gene expression changes in the DARPP-32-associated signal transduction cascade, 6-OHDA-lesioned animals (n = 4) were treated with 25 mg/kg l-dopa twice daily at 12 h intervals for a period of 3 weeks as described by Dunah et al. (2000). With regard to the severity of the nigrostriatal lesion, behavioral inclusion criteria for these experiments were as described above. All l-dopa-treated animals exhibited contralateral rotation, orofacial dyskinesias, and dystonic movements and postures, the latter being most pronounced toward the end of the rotational period. Control groups (n = 4 in each group) consisting of naive and 6-OHDA-treated animals received vehicle injections. The mRNA abundance of select DARPP-32-associated genes that changed their expression levels following chronic DA depletion were assessed by qPCR analyses of nonamplified template mRNA from laser-dissected striatonigral and striatopallidal neurons.
Comparisons of control and 6-OHDA-treated animals confirmed the array data for Ppp1r2, Ppp2r2a, and Gucy1a3 (Fig. 6). l-dopa treatment resulted in a cell-type-specific alteration of these lesion-induced transcriptional adaptations. In striatonigral neurons the expression levels for Ppp1r2 and Ppp2r2a remained increased and decreased, respectively (for Ppp1r2 the difference between control and l-dopa-treated animals did not reach statistical significance (p = 0.071)), whereas for Gucy1a3 the mRNA level changed in the opposite direction (Fig. 6A). In contrast to the findings in striatonigral neurons the expression levels of all three genes returned to normal control values in striatopallidal neurons (Fig. 6B). These data indicate a cell-type-specific regulation of gene expression in response to chronic dopamine replacement therapy in animals with severe nigrostriatal lesions.
Discussion
Our transcriptome analyses in a well characterized animal model of striatal DA depletion revealed large-scale alterations in gene expression profiles of striatonigral and striatopallidal neurons. Consistent with its function as a slow-acting neuromodulator, the loss of dopamine caused multiple changes in postsynaptic PKA/DARPP-32/PP1-associated signal transduction cascades. These transcriptional adaptations that occurred in a cell-type-specific manner are likely to affect the efficacy of signal transduction and thus change the intrinsic responsiveness of medium spiny projection neurons in the striatum.
A quintessential prerequisite of the study is the identification and sampling of striatonigral and striatopallidal neurons with the least possible amount of cross-contamination. For technical reasons such as lack of appropriate antibodies for labeling of marker proteins and superior preservation of RNA during the staining procedure for the retrograde tracer, we decided to use a previously described tracing method (Gerfen et al., 1990; Schiffmann and Vanderhaeghen, 1993) to identify neurons of the two projections systems. qPCR based expression analyses of the dopamine receptors Drd1 and Drd2 as well as two differentially expressed peptides, dynorphin and enkephalin, confirmed the validity of the approach. The expression ratios for each of these marker genes are in agreement with recently published data obtained from transgenic mice that express enhanced green fluorescent protein under the control of the Drd1 and Drd2 promoters (Heiman et al., 2008). In addition, the detection of changes that occur in opposite directions in the two populations provides further evidence for the relatively high purity of the cell samples; these results would not have been possible with a substantial cross-contamination of the samples.
The large discrepancy between the responses of striatonigral and striatopallidal neurons to chronic DA depletion is likely to have several reasons. In addition to the differential expression of the D1 and D2 DA receptors and their distinct coupling to postsynaptic signal transduction cascades (Stoof and Kebabian, 1981; Beaulieu et al., 2005; Bertran-Gonzalez et al., 2008), recently discovered intrinsic differences that are not directly linked to DA action, such as cellular excitability (Gertler et al., 2008) and intracellular Ca2+ release (Heiman et al., 2008) might contribute to the diverse regulation of gene expression. The finding that differences between the two cell types are mainly related to functions of signal transduction and signal integration is in agreement with our data that demonstrate a larger degree of overlap in dopamine depletion induced transcriptional changes for cytoskeletal and neurotransmitter release-associated functions than for ion channels, receptors, and signal transduction cascades.
The biological relevance of transcriptional regulation as an adaptive mechanism to changes in DA input is supported by the fact that changes in the core PKA/DARPP-32/PP1 cascade occur at multiple levels. Thus the potential effects on the overall signaling efficacy are mediated by different mechanisms. In D1-positive striatonigral neurons the activity of PKA will be increased by a decreased expression of Pde1b (Reed et al., 2002) and Ppp2r2a (Kamibayashi et al., 1992). It has previously been shown that PP2A is part of a positive feedforward loop that increases PKA activity through dephosphorylation of DARPP-32 at Thr75 (Svenningsson et al., 2004). This in turn will result in increased phosphorylation of DARPP-32 at Thr34, which will cause increased inhibition of PP1. PP1 activity will also be reduced by the decreased expression of the catalytic α subunit Ppp1ca and the increased expression of the inhibitory subunit Ppp1r2. Opposite effects will occur in striatopallidal neurons.
The potential impact on DARPP-32 phosphorylation profiles, consisting of increased Thr34 and decreased Thr75 phosphorylation in striatonigral neurons and a reversed pattern in striatopallidal neurons, parallels the effects of DA in the respective cell types under physiologic conditions (Bateup et al., 2008). Thus the most likely interpretation of the DA depletion induced transcriptional changes in postsynaptic signal transduction is that they represent compensatory mechanisms.
In accordance with the central role of DARPP-32 for signal integration in striatal projection neurons, transcriptional adaptations also occurred in other neurotransmitter systems that feed into the DARPP-32 cascade. The regulation of Mchr1 and Gucy1a3 expression will induce prodopaminergic phosphorylation patterns in striatonigral and striatopallidal neurons (Greengard et al., 1999; Saito et al., 1999). Both neurotransmitter systems have previously been implicated in the physiologic control of motor functions (Greengard et al., 1999; Smith et al., 2005). Our data suggest that they are also part of a transcriptional adaptation in motor system disease. Interestingly, the increased binding levels for D1 and D2 DA receptors in mice with deletions of the Mchr1 (Smith et al., 2005) suggest that there might be a potential for reciprocal adaptive interactions between different neurotransmitter systems.
Further support for the hypothesis that the responses are at least in part compensatory results from transcriptional changes in multiple target proteins of DA signaling that represent a broad range of cellular functions. The physiologic DA effects on histone H3-mediated chromatin remodeling (Bertran-Gonzalez et al., 2008) might be partially mimicked by the changes in H3f3a expression. Similarly, the altered expression levels of “leak” current producing Kcnk channel subunits (Goldstein et al., 2001) represent a potential compensation for the lack of DA-mediated modulation of Kir2- and Kcnk-mediated anomalous rectifier K+ currents (Nicola et al., 2000; Perez et al., 2006). As a potential effect, the changes in Kcnk channel expression might increase the inherent difference in anomalous rectifier currents in striatonigral and striatopallidal neurons (Gertler et al., 2008) by as much as 70%. Given the fact that these currents account for a large proportion of the conductance at resting membrane potential (Uchimura et al., 1989), these changes might cause a substantial alteration in excitability in the two types of neurons. Thus the adaptation of Kcnk expression levels might provide a mechanism for the respective decrease and increase in responsiveness of striatonigral and striatopallidal neurons to cortical stimulation in a rodent model of PD (Mallet et al., 2006).
However, alterations of excitability in the down state constitute only one component of the mechanisms that determine the overall activity patterns of MSNs. What is perhaps more important is the transition to the up state (Wilson and Kawaguchi, 1996), a process that is regulated by a complex interplay of multiple neurotransmitters and ion channels. Dopamine plays a crucial role in this transition via modulation of ion channel activities (Nicola et al., 2000). The fact that in both types of striatal projection neurons the transcriptional changes represent compensatory mechanisms might indicate that the increasingly deficient dopamine signaling is one of the main reasons for the disease-related changes in firing patterns. In other words, the compensational changes are insufficient to prevent the occurrence of abnormal electrical activity and motor symptoms. This hypothesis is supported by changes in glutamatergic signaling that mediate the transition from down to up states. In striatonigral neurons the increased expression of several different glutamate receptor subunits might partially compensate for the decreased level of activity (Mallet et al., 2006). On the other hand the reduction of glutamatergic synapses on striatopallidal neurons after dopamine depletion, as described by Day et al. (2006) potentially compensates the increased excitability and activity seen after dopamine depletion (Mallet et al., 2006), implicating that the anatomical changes in these neurons are homeostatic. In summary, this hypothesis assumes that one of the major postsynaptic deficits in MSNs lies in dopamine controlled state transitions.
Our findings have several implications for diseases associated with reduced DA innervation in the striatum such as PD. The postsynaptic changes in transcription patterns provide at least a partial explanation for the protracted preclinical phase of the disease. Studies in human PD patients (Bernheimer et al., 1973; Morrish et al., 1995) and a primate model of the disease (Bezard et al., 2001) have estimated that the threshold for symptom development is 40–50% for the loss of DA neurons and 70–80% for the loss of DA terminals and DA uptake sites. Depending on their persistence after the initiation of DA replacement therapy, the changes identified in our experiments might also have an impact on the effects of externally administered DA agonists (Bezard et al., 2003; Santini et al., 2008). In fact, the partial reversion of the DARPP-32-associated gene expression changes in striatonigral neurons in our experiments suggests the occurrence of altered phosphorylation patterns during long-term l-dopa treatment. This hypothesis is in agreement with reports about increased phosphorylation of DARPP-32 at threonine residue 34 (Picconi et al., 2003) and hyperphosphorylation of the Grin1 subunit of the NMDA receptor at serine residues (Dunah et al., 2000) in animals that have received extended l-dopa treatment. Potential mechanisms for this complex cell-type-specific response might include the pulsatile or nonphysiologic nature of dopamine receptor stimulation or indicate the existence of additional regulators such as trophic feedback from DA terminals.
In summary the data provide solid evidence for the profound changes in transcriptional profiles in striatonigral and striatopallidal neurons after DA depletion. Based on the combined functional patterns of the individual changes, the responses in both types of neurons are most likely compensatory. Elucidating the mechanisms that orchestrate these complex alterations will provide valuable insight into the adaptability of the brain to disease-related dysfunction.
Footnotes
This work was supported in part by the American Parkinson's Disease Foundation (B.M.), Consejo Nacional de Investigaciones Científicas y Técnicas and the Antorchas Foundation, Argentina (G.D.), and the Merit Review Program of the Department of Veterans Affairs and Grant P01 NS044233 from the National Institutes of Health (C.W.S.). We thank Lee Goodglick for providing access to the Arcturus PixCell II laser-capture microscope and Nancy Wu for assistance with some of the early-stage qPCR analyses. Special thanks go to Marie-Francoise Chesselet and Mark G. Erlander for their constant support and encouragement. This paper is dedicated to the memory of Clifford W. Shults, who was instrumental in initiating and driving the project.
References
- Aebi M, Fäh J, Hurt N, Samuel CE, Thomis D, Bazzigher L, Pavlovic J, Haller O, Staeheli P. cDNA structures and regulation of two interferon-induced human Mx proteins. Mol Cell Biol. 1989;9:5062–5072. doi: 10.1128/mcb.9.11.5062. [DOI] [PMC free article] [PubMed] [Google Scholar]
- Albin RL, Young AB, Penney JB. The functional anatomy of basal ganglia disorders. Trends Neurosci. 1989;12:366–375. doi: 10.1016/0166-2236(89)90074-x. [DOI] [PubMed] [Google Scholar]
- Ballion B, Mallet N, Bézard E, Lanciego JL, Gonon F. Intratelencephalic corticostriatal neurons equally excite striatonigral and striatopallidal neurons and their discharge activity is selectively reduced in experimental parkinsonism. Eur J Neurosci. 2008;27:2313–2321. doi: 10.1111/j.1460-9568.2008.06192.x. [DOI] [PubMed] [Google Scholar]
- Bateup HS, Svenningsson P, Kuroiwa M, Gong S, Nishi A, Heintz N, Greengard P. Cell type-specific regulation of DARPP-32 phosphorylation by psychostimulant and antipsychotic drugs. Nat Neurosci. 2008;11:932–939. doi: 10.1038/nn.2153. [DOI] [PMC free article] [PubMed] [Google Scholar]
- Beaulieu JM, Sotnikova TD, Marion S, Lefkowitz RJ, Gainetdinov RR, Caron MG. An Akt/beta-arrestin 2/PP2A signaling complex mediates dopaminergic neurotransmission and behavior. Cell. 2005;122:261–273. doi: 10.1016/j.cell.2005.05.012. [DOI] [PubMed] [Google Scholar]
- Bergman H, Feingold A, Nini A, Raz A, Slovin H, Abeles M, Vaadia E. Physiological aspects of information processing in the basal ganglia of normal and parkinsonian primates. Trends Neurosci. 1998;21:32–38. doi: 10.1016/s0166-2236(97)01151-x. [DOI] [PubMed] [Google Scholar]
- Bernheimer H, Birkmayer W, Hornykiewicz O, Jellinger K, Seitelberger F. Brain dopamine and the syndromes of Parkinson and Huntington. Clinical, morphological and neurochemical correlations. J Neurol Sci. 1973;20:415–455. doi: 10.1016/0022-510x(73)90175-5. [DOI] [PubMed] [Google Scholar]
- Bertran-Gonzalez J, Bosch C, Maroteaux M, Matamales M, Hervé D, Valjent E, Girault JA. Opposing patterns of signaling activation in dopamine D1 and D2 receptor-expressing striatal neurons in response to cocaine and haloperidol. J Neurosci. 2008;28:5671–5685. doi: 10.1523/JNEUROSCI.1039-08.2008. [DOI] [PMC free article] [PubMed] [Google Scholar]
- Bezard E, Dovero S, Prunier C, Ravenscroft P, Chalon S, Guilloteau D, Crossman AR, Bioulac B, Brotchie JM, Gross CE. Relationship between the appearance of symptoms and the level of nigrostriatal degeneration in a progressive 1-methyl-4-phenyl-1,2,3,6-tetrahydropyridine-lesioned macaque model of Parkinson's disease. J Neurosci. 2001;21:6853–6861. doi: 10.1523/JNEUROSCI.21-17-06853.2001. [DOI] [PMC free article] [PubMed] [Google Scholar]
- Bezard E, Gross CE, Brotchie JM. Presymptomatic compensation in Parkinson's disease is not dopamine-mediated. Trends Neurosci. 2003;26:215–221. doi: 10.1016/S0166-2236(03)00038-9. [DOI] [PubMed] [Google Scholar]
- Bittner A, Carmen AC, Leung A, Liu X, Smith S, Sun L, Wan J, Xiao H, Yao X, Yieh L. Methods and algorithms for performing quality control during gene expression profiling on DNA microarray technology. 2004 U.S. Patent. CODEN: USXXCO US 20040229245A1, CAN 141:406750, AN 2004:999599. [Google Scholar]
- Brown P. Oscillatory nature of human basal ganglia activity: relationship to the pathophysiology of Parkinson's disease. Mov Disord. 2003;18:357–363. doi: 10.1002/mds.10358. [DOI] [PubMed] [Google Scholar]
- Chuaqui RF, Bonner RF, Best CJ, Gillespie JW, Flaig MJ, Hewitt SM, Phillips JL, Krizman DB, Tangrea MA, Ahram M, Linehan WM, Knezevic V, Emmert-Buck MR. Post-analysis follow-up and validation of microarray experiments. Nat Genet. 2002;32(Suppl):509–514. doi: 10.1038/ng1034. [DOI] [PubMed] [Google Scholar]
- Day M, Wang Z, Ding J, An X, Ingham CA, Shering AF, Wokosin D, Ilijic E, Sun Z, Sampson AR, Mugnaini E, Deutch AY, Sesack SR, Arbuthnott GW, Surmeier DJ. Selective elimination of glutamatergic synapses on striatopallidal neurons in Parkinson disease models. Nat Neurosci. 2006;9:251–259. doi: 10.1038/nn1632. [DOI] [PubMed] [Google Scholar]
- Dunah AW, Wang Y, Yasuda RP, Kameyama K, Huganir RL, Wolfe BB, Standaert DG. Alterations in subunit expression, composition, and phosphorylation of striatal N-methyl-D-aspartate glutamate receptors in a rat 6-hydroxydopamine model of Parkinson's disease. Mol Pharmacol. 2000;57:342–352. [PubMed] [Google Scholar]
- Dziewczapolski G, Lie DC, Ray J, Gage FH, Shults CW. Survival and differentiation of adult rat-derived neuronal progenitor cells transplanted to the striatum of hemiparkinsonian rats. Exp Neurol. 2003;183:653–664. doi: 10.1016/s0014-4886(03)00212-7. [DOI] [PubMed] [Google Scholar]
- Eisen MB, Spellman PT, Brown PO, Botstein D. Cluster analysis and display of genome-wide expression patterns. Proc Natl Acad Sci U S A. 1998;95:14863–14868. doi: 10.1073/pnas.95.25.14863. [DOI] [PMC free article] [PubMed] [Google Scholar]
- Esteban JA, Shi SH, Wilson C, Nuriya M, Huganir RL, Malinow R. PKA phosphorylation of AMPA receptor subunits controls synaptic trafficking underlying plasticity. Nat Neurosci. 2003;6:136–143. doi: 10.1038/nn997. [DOI] [PubMed] [Google Scholar]
- Garrett WT, McBride RL, Williams JK, Jr, Feringa ER. Fluoro-Gold's toxicity makes it inferior to True Blue for long-term studies of dorsal root ganglion neurons and motoneurons. Neurosci Lett. 1991;128:137–139. doi: 10.1016/0304-3940(91)90778-r. [DOI] [PubMed] [Google Scholar]
- Gerfen CR, Young WS., 3rd Distribution of striatonigral and striatopallidal peptidergic neurons in both patch and matrix compartments: an in situ hybridization histochemistry and fluorescent retrograde tracing study. Brain Res. 1988;460:161–167. doi: 10.1016/0006-8993(88)91217-6. [DOI] [PubMed] [Google Scholar]
- Gerfen CR, Engber TM, Mahan LC, Susel Z, Chase TN, Monsma FJ, Jr, Sibley DR. D1 and D2 dopamine receptor-regulated gene expression of striatonigral and striatopallidal neurons. Science. 1990;250:1429–1432. doi: 10.1126/science.2147780. [DOI] [PubMed] [Google Scholar]
- Gertler TS, Chan CS, Surmeier DJ. Dichotomous anatomical properties of adult striatal medium spiny neurons. J Neurosci. 2008;28:10814–10824. doi: 10.1523/JNEUROSCI.2660-08.2008. [DOI] [PMC free article] [PubMed] [Google Scholar]
- Goldstein SA, Bockenhauer D, O'Kelly I, Zilberberg N. Potassium leak channels and the KCNK family of two-P-domain subunits. Nat Rev Neurosci. 2001;2:175–184. doi: 10.1038/35058574. [DOI] [PubMed] [Google Scholar]
- Graybiel AM. The basal ganglia. Curr Biol. 2000;10:R509–R511. doi: 10.1016/s0960-9822(00)00593-5. [DOI] [PubMed] [Google Scholar]
- Greengard P, Allen PB, Nairn AC. Beyond the dopamine receptor: the DARPP-32/protein phosphatase-1 cascade. Neuron. 1999;23:435–447. doi: 10.1016/s0896-6273(00)80798-9. [DOI] [PubMed] [Google Scholar]
- Heiman M, Schaefer A, Gong S, Peterson JD, Day M, Ramsey KE, Suárez-Fariñas M, Schwarz C, Stephan DA, Surmeier DJ, Greengard P, Heintz N. A translational profiling approach for the molecular characterization of CNS cell types. Cell. 2008;135:738–748. doi: 10.1016/j.cell.2008.10.028. [DOI] [PMC free article] [PubMed] [Google Scholar]
- Helbig KJ, Lau DT, Semendric L, Harley HA, Beard MR. Analysis of ISG expression in chronic hepatitis C identifies viperin as a potential antiviral effector. Hepatology. 2005;42:702–710. doi: 10.1002/hep.20844. [DOI] [PubMed] [Google Scholar]
- Hervieu GJ, Cluderay JE, Harrison D, Meakin J, Maycox P, Nasir S, Leslie RA. The distribution of the mRNA and protein products of the melanin-concentrating hormone (MCH) receptor gene, slc-1, in the central nervous system of the rat. Eur J Neurosci. 2000;12:1194–1216. doi: 10.1046/j.1460-9568.2000.00008.x. [DOI] [PubMed] [Google Scholar]
- Hirsch E, Graybiel AM, Agid YA. Melanized dopaminergic neurons are differentially susceptible to degeneration in Parkinson's disease. Nature. 1988;334:345–348. doi: 10.1038/334345a0. [DOI] [PubMed] [Google Scholar]
- Huang FL, Glinsmann WH. Separation and characterization of two phosphorylase phosphatase inhibitors from rabbit skeletal muscle. Eur J Biochem. 1976;70:419–426. doi: 10.1111/j.1432-1033.1976.tb11032.x. [DOI] [PubMed] [Google Scholar]
- Ichihara-Tanaka K, Oohira A, Rumsby M, Muramatsu T. Neuroglycan C is a novel midkine receptor involved in process elongation of oligodendroglial precursor-like cells. J Biol Chem. 2006;281:30857–30864. doi: 10.1074/jbc.M602228200. [DOI] [PubMed] [Google Scholar]
- Ingham CA, Hood SH, Taggart P, Arbuthnott GW. Plasticity of synapses in the rat neostriatum after unilateral lesion of the nigrostriatal dopaminergic pathway. J Neurosci. 1998;18:4732–4743. doi: 10.1523/JNEUROSCI.18-12-04732.1998. [DOI] [PMC free article] [PubMed] [Google Scholar]
- Kamibayashi C, Lickteig RL, Estes R, Walter G, Mumby MC. Expression of the A subunit of protein phosphatase 2A and characterization of its interactions with the catalytic and regulatory subunits. J Biol Chem. 1992;267:21864–21872. [PubMed] [Google Scholar]
- Kamme F, Salunga R, Yu J, Tran DT, Zhu J, Luo L, Bittner A, Guo HQ, Miller N, Wan J, Erlander M. Single-cell microarray analysis in hippocampus CA1: demonstration and validation of cellular heterogeneity. J Neurosci. 2003;23:3607–3615. doi: 10.1523/JNEUROSCI.23-09-03607.2003. [DOI] [PMC free article] [PubMed] [Google Scholar]
- Kamme F, Zhu J, Luo L, Yu J, Tran DT, Meurers B, Bittner A, Westlund K, Carlton S, Wan J. Single-cell laser-capture microdissection and RNA amplification. Methods Mol Med. 2004;99:215–223. doi: 10.1385/1-59259-770-X:215. [DOI] [PubMed] [Google Scholar]
- Kawaguchi Y, Wilson CJ, Emson PC. Projection subtypes of rat neostriatal matrix cells revealed by intracellular injection of biocytin. J Neurosci. 1990;10:3421–3438. doi: 10.1523/JNEUROSCI.10-10-03421.1990. [DOI] [PMC free article] [PubMed] [Google Scholar]
- Kobayashi K, Nishioka M, Kohno T, Nakamoto M, Maeshima A, Aoyagi K, Sasaki H, Takenoshita S, Sugimura H, Yokota J. Identification of genes whose expression is upregulated in lung adenocarcinoma cells in comparison with type II alveolar cells and bronchiolar epithelial cells in vivo. Oncogene. 2004;23:3089–3096. doi: 10.1038/sj.onc.1207433. [DOI] [PubMed] [Google Scholar]
- Kreitzer AC, Malenka RC. Endocannabinoid-mediated rescue of striatal LTD and motor deficits in Parkinson's disease models. Nature. 2007;445:643–647. doi: 10.1038/nature05506. [DOI] [PubMed] [Google Scholar]
- Mallet N, Ballion B, Le Moine C, Gonon F. Cortical inputs and GABA interneurons imbalance projection neurons in the striatum of parkinsonian rats. J Neurosci. 2006;26:3875–3884. doi: 10.1523/JNEUROSCI.4439-05.2006. [DOI] [PMC free article] [PubMed] [Google Scholar]
- McClung CA, Nestler EJ, Zachariou V. Regulation of gene expression by chronic morphine and morphine withdrawal in the locus ceruleus and ventral tegmental area. J Neurosci. 2005;25:6005–6015. doi: 10.1523/JNEUROSCI.0062-05.2005. [DOI] [PMC free article] [PubMed] [Google Scholar]
- Meurers BH, Dziewczapolski G, Bittner A, Shi T, Kamme F, Shults CW. Dopamine depletion induced up-regulation of HCN3 enhances rebound excitability of basal ganglia output neurons. Neurobiol Dis. 2009;34:178–188. doi: 10.1016/j.nbd.2009.01.007. [DOI] [PubMed] [Google Scholar]
- Mirnics K, Middleton FA, Marquez A, Lewis DA, Levitt P. Molecular characterization of schizophrenia viewed by microarray analysis of gene expression in prefrontal cortex. Neuron. 2000;28:53–67. doi: 10.1016/s0896-6273(00)00085-4. [DOI] [PubMed] [Google Scholar]
- Mootha VK, Lindgren CM, Eriksson KF, Subramanian A, Sihag S, Lehar J, Puigserver P, Carlsson E, Ridderstråle M, Laurila E, Houstis N, Daly MJ, Patterson N, Mesirov JP, Golub TR, Tamayo P, Spiegelman B, Lander ES, Hirschhorn JN, Altshuler D, et al. PGC-1alpha-responsive genes involved in oxidative phosphorylation are coordinately downregulated in human diabetes. Nat Genet. 2003;34:267–273. doi: 10.1038/ng1180. [DOI] [PubMed] [Google Scholar]
- Morelli M, Di Chiara G. Agonist-induced homologous and heterologous sensitization to D-1- and D-2-dependent contraversive turning. Eur J Pharmacol. 1987;141:101–107. doi: 10.1016/0014-2999(87)90415-8. [DOI] [PubMed] [Google Scholar]
- Morrish PK, Sawle GV, Brooks DJ. Clinical and [18F] dopa PET findings in early Parkinson's disease. J Neurol Neurosurg Psychiatry. 1995;59:597–600. doi: 10.1136/jnnp.59.6.597. [DOI] [PMC free article] [PubMed] [Google Scholar]
- Nakane M, Arai K, Saheki S, Kuno T, Buechler W, Murad F. Molecular cloning and expression of cDNAs coding for soluble guanylate cyclase from rat lung. J Biol Chem. 1990;265:16841–16845. [PubMed] [Google Scholar]
- Nicola SM, Surmeier J, Malenka RC. Dopaminergic modulation of neuronal excitability in the striatum and nucleus accumbens. Annu Rev Neurosci. 2000;23:185–215. doi: 10.1146/annurev.neuro.23.1.185. [DOI] [PubMed] [Google Scholar]
- Nowak SJ, Corces VG. Phosphorylation of histone H3: a balancing act between chromosome condensation and transcriptional activation. Trends Genet. 2004;20:214–220. doi: 10.1016/j.tig.2004.02.007. [DOI] [PubMed] [Google Scholar]
- Ohtsuka T, Jensen MR, Kim HG, Kim KT, Lee SW. The negative role of cyclin G in ATM-dependent p53 activation. Oncogene. 2004;23:5405–5408. doi: 10.1038/sj.onc.1207693. [DOI] [PubMed] [Google Scholar]
- Olsson M, Nikkhah G, Bentlage C, Björklund A. Forelimb akinesia in the rat Parkinson model: differential effects of dopamine agonists and nigral transplants as assessed by a new stepping test. J Neurosci. 1995;15:3863–3875. doi: 10.1523/JNEUROSCI.15-05-03863.1995. [DOI] [PMC free article] [PubMed] [Google Scholar]
- Perez MF, White FJ, Hu XT. Dopamine D(2) receptor modulation of K(+) channel activity regulates excitability of nucleus accumbens neurons at different membrane potentials. J Neurophysiol. 2006;96:2217–2228. doi: 10.1152/jn.00254.2006. [DOI] [PubMed] [Google Scholar]
- Picconi B, Centonze D, Håkansson K, Bernardi G, Greengard P, Fisone G, Cenci MA, Calabresi P. Loss of bidirectional striatal synaptic plasticity in L-DOPA-induced dyskinesia. Nat Neurosci. 2003;6:501–506. doi: 10.1038/nn1040. [DOI] [PubMed] [Google Scholar]
- Reed TM, Repaske DR, Snyder GL, Greengard P, Vorhees CV. Phosphodiesterase 1B knock-out mice exhibit exaggerated locomotor hyperactivity and DARPP-32 phosphorylation in response to dopamine agonists and display impaired spatial learning. J Neurosci. 2002;22:5188–5197. doi: 10.1523/JNEUROSCI.22-12-05188.2002. [DOI] [PMC free article] [PubMed] [Google Scholar]
- Roche KW, O'Brien RJ, Mammen AL, Bernhardt J, Huganir RL. Characterization of multiple phosphorylation sites on the AMPA receptor GluR1 subunit. Neuron. 1996;16:1179–1188. doi: 10.1016/s0896-6273(00)80144-0. [DOI] [PubMed] [Google Scholar]
- Saito Y, Nothacker HP, Wang Z, Lin SH, Leslie F, Civelli O. Molecular characterization of the melanin-concentrating-hormone receptor. Nature. 1999;400:265–269. doi: 10.1038/22321. [DOI] [PubMed] [Google Scholar]
- Santini E, Valjent E, Fisone G. Parkinson's disease: levodopa-induced dyskinesia and signal transduction. FEBS J. 2008;275:1392–1399. doi: 10.1111/j.1742-4658.2008.06296.x. [DOI] [PubMed] [Google Scholar]
- Schiffmann SN, Vanderhaeghen JJ. Adenosine A2 receptors regulate the gene expression of striatopallidal and striatonigral neurons. J Neurosci. 1993;13:1080–1087. doi: 10.1523/JNEUROSCI.13-03-01080.1993. [DOI] [PMC free article] [PubMed] [Google Scholar]
- Schwarting RK, Huston JP. Unilateral 6-hydroxydopamine lesions of meso-striatal dopamine neurons and their physiological sequelae. Prog Neurobiol. 1996;49:215–266. doi: 10.1016/s0301-0082(96)00015-9. [DOI] [PubMed] [Google Scholar]
- Shen W, Flajolet M, Greengard P, Surmeier DJ. Dichotomous dopaminergic control of striatal synaptic plasticity. Science. 2008;321:848–851. doi: 10.1126/science.1160575. [DOI] [PMC free article] [PubMed] [Google Scholar]
- Smith DG, Tzavara ET, Shaw J, Luecke S, Wade M, Davis R, Salhoff C, Nomikos GG, Gehlert DR. Mesolimbic dopamine super-sensitivity in melanin-concentrating hormone-1 receptor-deficient mice. J Neurosci. 2005;25:914–922. doi: 10.1523/JNEUROSCI.4079-04.2005. [DOI] [PMC free article] [PubMed] [Google Scholar]
- Stoof JC, Kebabian JW. Opposing roles for D-1 and D-2 dopamine receptors in efflux of cyclic AMP from rat neostriatum. Nature. 1981;294:366–368. doi: 10.1038/294366a0. [DOI] [PubMed] [Google Scholar]
- Surmeier DJ, Song WJ, Yan Z. Coordinated expression of dopamine receptors in neostriatal medium spiny neurons. J Neurosci. 1996;16:6579–6591. doi: 10.1523/JNEUROSCI.16-20-06579.1996. [DOI] [PMC free article] [PubMed] [Google Scholar]
- Svenningsson P, Nishi A, Fisone G, Girault JA, Nairn AC, Greengard P. DARPP-32: an integrator of neurotransmission. Annu Rev Pharmacol Toxicol. 2004;44:269–296. doi: 10.1146/annurev.pharmtox.44.101802.121415. [DOI] [PubMed] [Google Scholar]
- Uchimura N, Cherubini E, North RA. Inward rectification in rat nucleus accumbens neurons. J Neurophysiol. 1989;62:1280–1286. doi: 10.1152/jn.1989.62.6.1280. [DOI] [PubMed] [Google Scholar]
- Valjent E, Corvol JC, Pages C, Besson MJ, Maldonado R, Caboche J. Involvement of the extracellular signal-regulated kinase cascade for cocaine-rewarding properties. J Neurosci. 2000;20:8701–8709. doi: 10.1523/JNEUROSCI.20-23-08701.2000. [DOI] [PMC free article] [PubMed] [Google Scholar]
- Wilson CJ, Kawaguchi Y. The origins of two-state spontaneous membrane potential fluctuations of neostriatal spiny neurons. J Neurosci. 1996;16:2397–2410. doi: 10.1523/JNEUROSCI.16-07-02397.1996. [DOI] [PMC free article] [PubMed] [Google Scholar]