

Abstract
Background
There are no validated observational surveys to assess injury hazards in the home environment.
Objective
Evaluate the reproducibility and reliability of a survey quantifying home injury hazards for children.
Methods
We analyzed a nested cohort of children in the intervention arm of the Home Observations and Measures of the Environment (HOME) Study trial. The number and density of hazards were quantified by research assistants in the homes of participants at a baseline visit (BHV) for 4 high-risk rooms (kitchen, main activity room, child's bathroom and child's bedroom) and stairways and later at an intervention planning visit (IPV) for the 4 high-risk rooms and entire household. Statistical analysis included Pearson correlation, Bland-Altman analysis of agreement, analysis of variance, and Kappa statistics.
Results
There were163 households with measurements at BHV and IPV. The number and density of hazards for the 4 high-risk rooms were significantly correlated between BHV and IPV (r=0.50 and 0.75, respectively). The number and density of hazards for the 4-high risk rooms were significantly correlated with that for the whole household at the IPV (r=0.17 and 0.52, respectively). The number of injury hazards was significantly higher in the kitchen than the other high-risk rooms whereas density was highest in the child's bathroom. Inter-rater reliability between research assistants, as measured by the Kappa statistic, was excellent with a mean of 0.81.
Conclusions
The HOME Injury Survey was reliable and replicable tool for quantifying residential injury hazards. The density of injury hazards was a more stable and valid measure than the number of injury hazards.
The home environment is a leading location of injury-related morbidity and mortality for U.S. children. Despite significant reductions in injuries and deaths over the past two decades, injuries sustained in the home still account for over 2,800 deaths, 74,000 hospitalizations, and 4 million emergency visits in US children under 19 years of age each year.1, 2 To prevent morbidity and mortality from residential hazards, we must continue to identify and control injury hazards in the home environment.
There are observational tools to identify and quantify residential injury hazards but none that have been validated for inter-observer reliability, test-retest reliability, and external validity. Several studies have examined the home environment to confirm parental reports of injury control measures.3-9 The instruments have found less than optimal sensitivity and specificity between parental report and observed hazards in the home.8, 10 Furthermore, none have validated these instruments for their test-retest characteristics over time using the same instrument on the same environment (reliability), the test-retest agreement between research assistants at the same visit (replicability), nor assessed external validity by examining an instrument's association with recognized risk factors for home injuries. Hazards within a home are likely to be dynamic over time (e.g., scissors moving from cabinet in kitchen to drawer in bathroom after usage) and no prior studies have examined the dynamic nature of injury hazards in the home environment. To enhance the measurement of injury hazards and injury prevention efforts, it is essential to develop and validate a survey instrument to quantify injury hazards in the home environment.11
The purpose of this study was to develop and validate an instrument to quantify injury hazards in the homes of young children. We hypothesized that: 1) the number and density (number of hazards per 100 sq.ft.) of hazards measured in 4 high risk rooms (kitchen, main activity room, child's bedroom and child's bathroom) would be reliable; 2) the number and density of hazards identified in the 4-room survey would be representative of the number and density of hazards identified across the whole household; 3) the number and density of hazards independently identified by multiple research assistants at the same visit will be replicable; and 4) the number and density of hazards identified at a baseline home visit (BHV) would be significantly associated with some of the known risk factors for residential injury.
Methods
These analyses are based on data from a nested cohort of children within the injury intervention arm, prior to intervention, of the Home Observations and Measures of the Environment (HOME) Study. The HOME Study is a prospective, randomized, controlled two-arm trial of residential injury and lead hazard control. The intervention in the injury arm consists of the installation of multiple consumer safety products to reduce exposure to injury hazards in the home. Each arm serves as the other's control. The primary outcomes for the injury intervention trial are a reduction in emergency and medically-attended injuries for children from birth through 3 years of age.
The survey used to assess homes for injury hazards, the HOME Injury Survey, was developed by analyzing the leading mechanisms for emergency visits for US children and a review of instruments used in other studies.1, 12 7, 9, 13 The leading unintentional mechanisms of residential injury resulting in an emergency visit are: cutting/piercing, struck/strike, fall, poison, and burns.1 Five high-exposure, high-risk areas in homes have been identified in several studies by parents of young children as being of concern for child safety: the kitchen, the main activity room (where TV and toys kept), the child's bedroom, the child's bathroom, and stairways.13, 14 Next, we conducted a pilot survey of the home environment for injury hazards with an experienced home child-proofer. The pilot instrument was revised after surveying 6 homes. The final instrument included 55 items covering 5 mechanisms of injury and was used at the BHV, IPV, and at subsequent annual visits for the 5 high-exposure, high-risk areas of the home. The survey was designed to focus on hazards below eye level for a 3 year-old child or about the 75th percentile for height of a 3 year-old male (1 meter / 39 inches).
The current analysis focuses on the first two visits: BHV and IPV. The BHV occurred prior to randomization and birth in all enrolled participant's homes and surveyed the 4 high-exposure, high risk rooms and stairways. The IPV occurred only in homes in the injury intervention arm of the trial and included the rooms surveyed at the BHV and all finished living space including basements and attics. Surveys were conducted by trained research assistants at an average of 5.4-months (s.d. 2.3) after the birth of the child. The IPV was conducted 9.9 months (s.d. 2.7 mo.) after the BHV. The instrument required about 20 minutes to complete the BHV, 4-room survey and 1 hour of research assistant time for the IPV.
Statistical Analysis
To assess reliability, we correlated the number and density of hazards identified at the BHV with a survey of the same rooms several months later during in-home visits prior to installation of the intervention, the IPV. At the IPV, in addition to the 4 high-risk, high-exposure rooms and stairways surveyed at the BHV, all finished living space of the home was surveyed. To examine whether a 4-room survey was representative of all finished living space, we examined the correlation of the survey of injury hazards identified in the 4-room sub-sample with a survey of the whole household living space conducted at the same visit (the IPV). Replicability was assessed using a random selection of pairs of research assistants from the total of seven involved with the study: kappa scores were estimated for each item in the instrument by having the research assistants survey 100 rooms within hours of each other.15
As a measure of external validity, we examined the association of the number and density of hazards with some known risk factors for home injury included in the trial. These risk factors included maternal and child demographic characteristics, maternal depressive symptoms, and socio-economic factors. 1, 2, 16, 17 We used measures of depressive symptoms (Beck Depression Inventory) 18, 19 16, 20 and other socio-demographic data collected at BHV and IPV to examine the association with the number and density of hazards at both the BHV and IPV.
The total number of hazards per room was quantified and the sum over the rooms represented the total hazards. The area in square feet was measured for the whole house and each of the high-exposure/high-risk rooms (stairways were not included). The density of hazards was determined by dividing the number of hazards by the area of the room. The configurations of the stairways (landings between steps, widening at top and bottom entries, and occasionally spiral design) precluded a standardized approach to the measurement of stairway area and so this was not collected and the density of hazards for stairways therefore could not be determined. The total household density was the total number of hazards divided by the total area of the house (excluding stairways). Number and density of hazards was examined for violation of the normality assumption prior to analysis. Pearson correlation coefficients are presented as appropriate. For assessment of the agreement between number of hazards and hazard density between BHV and IPV, a Bland-Altman analysis was undertaken. 21, 22 Analysis of variance with post hoc Student-Newman-Keuls correction was used to compare number and density of hazards between rooms at the BHV and IPV separately. A p-value of <0.05 was considered statistically significant. SAS® version 9.1 (SAS Institute, Cary, NC) was used for analysis.
Results
We screened expectant mothers presenting to obstetrical practices for prenatal care for eligibility for the HOME Study. Of the 8878 women screened, 3366 (37.9%) were excluded (see Fig. 1). The reasons for exclusion were; less than 18 years of age, over 19 weeks of pregnancy gestation, living in a home built after 1978 (year legislation passed banning lead-based paint), living outside the 5 Ohio county (Hamilton, Clermont, Warren, Butler, and Brown) study area encompassing the City of Cincinnati, OH, or living in public housing, shelters, group homes, or trailer homes. Another 3921 (44.2%) were found to be ineligible because they either had plans to relocate outside of the study area in the near future, discontinued prenatal care at participating obstetrical practices and hospitals, were not fluent in English, or had a medical condition that would interfere with study participation. An additional 328 (3.7%) did not respond to the letter and could not be contacted.
Fig. 1.
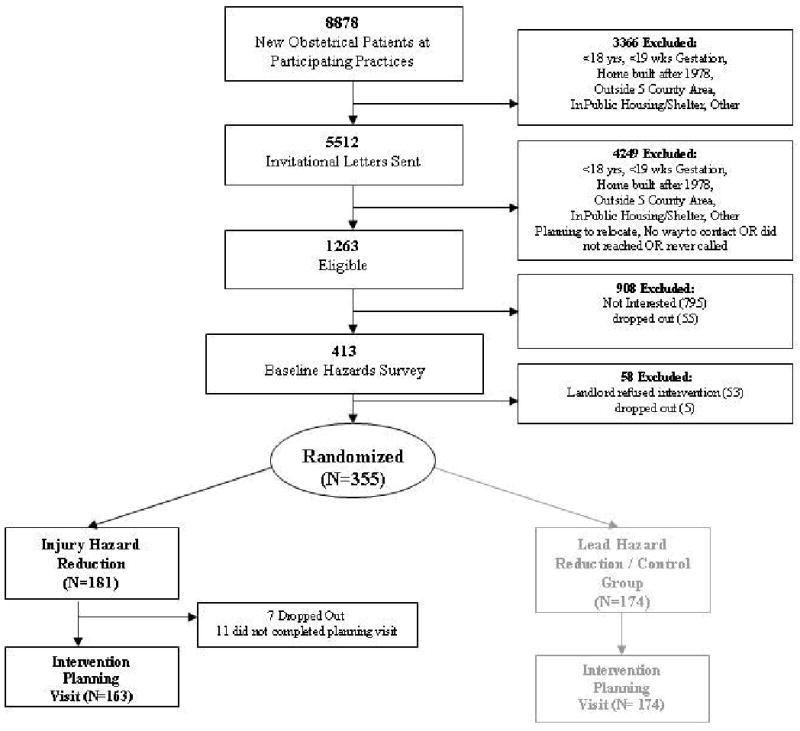
Home Observations and Measures of the Environment (HOME) Study HOME Injury Survey Enrollment
A total of 1263 (14.2% of those screened) women were eligible for participation. Of these, 795 declined to participate and 55 dropped out during the run-in period for the trial and prior to randomization. After the BHV, but prior to randomization, an additional 53 became ineligible because the landlord refused to participate and 5 dropped out. This left 355 expectant mothers who consented to participate. These women were randomly assigned, prior to delivery of their infant, to the injury intervention arm of the trial (n=181) or to the control arm (n=171). For this analysis we report on 163 who did not relocate and had complete data on follow-up from BHV through IPV. All of the participants in the injury intervention group in this analysis received in-home visits by research assistants at both BHV and IPV.
The mean age of the enrolled mothers at the intervention planning visit was 30 years (Table 1). A majority of enrolled children were white, non-Hispanic and half were only children. The majority of households made less than $70,000 annually. Most households and children had private health insurance and just over half of enrolled mothers had a college degree.
Table 1. Demographic Characteristics of Mother-Child Participants (N=163).
| Maternal Age (mean, s.d.) years | 30.0 ± 5.6 | |
|---|---|---|
| Child Age (mean, s.d.) months | 5.4 ± 2.5 | |
| Child Gender | ||
| M | 68 | 41.7 |
| F | 95 | 58.3 |
| Child Race | ||
| White, non-hispanic | 115 | 70.6 |
| Black, non-hispanic | 38 | 23.3 |
| Other | 10 | 6.1 |
| Number of Siblings | ||
| 0 | 82 | 50.3 |
| 1 | 57 | 35.0 |
| ≥2 | 12 | 7.4 |
| Unknown | 12 | 7.4 |
| Total Household Income | ||
| <$30,000 | 40 | 23.5 |
| $30,000-49,999 | 27 | 16.6 |
| $50,000-69,999 | 25 | 15.3 |
| $70,000-89,999 | 37 | 22.7 |
| $90,000-119,999 | 13 | 8.0 |
| ≥$120,000 | 17 | 10.4 |
| Unknown | 4 | 2.4 |
| Insurance Status | ||
| Private | 122 | 74.8 |
| Medicaid | 31 | 19.4 |
| Unknown | 10 | 6.1 |
| Maternal Education | ||
| <=High school | 20 | 12.3 |
| < college | 49 | 30.0 |
| College grad / post grad | 94 | 57.7 |
Households in the injury intervention arm varied by size and the number of rooms, with a mean of 13 rooms (range 5 to 26 rooms). The majority was single family dwellings and 57% were located in urban areas of the City of Cincinnati (see Table 2). The mean size of the housing units was 1401 square feet (sq.ft.), range 288 to 4172 sq.ft. The mean total space for the 4 high-risk, high-exposure rooms was 547 sq.ft., range 229 to 1093 sq.ft.
Table 2. Household Characteristics (N=163).
| Mean (sd) or N | Range or % | |
|---|---|---|
| Total Household (sq feet) | 1401 (611) | 288 - 4172 |
| Total Household (sq meters) | 130 (57) | 27 - 388 |
| 4 – rooms (sq feet) | 547 (126) | 229 – 1093 |
| 4 – rooms (sq meters) | 51 (12) | 21 – 102 |
| Number of rooms | 13 | 5 - 26 |
| Location | ||
| Urban | 91 | 56% |
| Suburban | 64 | 39% |
| Rural | 8 | 5% |
| Type of Housing | ||
| Single family | 132 | 81% |
| Multi-family | 12 | 7% |
| Apartment | 15 | 9% |
| Townhouse/Other | 4 | 3% |
| Number of Floors | ||
| 1 | 45 | 28% |
| 2 | 92 | 56% |
| 3 or more | 26 | 16% |
The number and density of hazards were significantly lower at the baseline visit than the IPV. At the BHV, the mean number of hazards for the 4 rooms was 31.8 and later at the IPV was 37.0 hazards across rooms (paired t-test, t=59 on 162 df, p<0.0001). The mean density of hazards for the 4 rooms combined was also significantly different between BHV and IPV (6.1 hazards / 100 sq.ft. and 7.1 hazards / 100 sq.ft., respectively, paired t-test, t=42 on 158 df, p<0.0001, Table 3). The number and density of hazards were highly correlated between the BHV and IPV (Table 4, r=0.50, r=0.75, both p<0.0001).
Table 3. Mean Number and Density (Number per 100 square feet) of Hazards for Baseline Home Visit and Intervention Planning Visit (N=163).
| Number of Hazards* | Mean | s.d. |
|---|---|---|
| Baseline (4 rooms) | 31.8 | 6.8 |
| Intervention Planning Visit (4 rooms) | 37.0 | 6.3 |
| Intervention Planning Visit (all rooms) | 81.4 | 23.2 |
| Density of Hazards * | ||
| Baseline (4 rooms) | 6.1 | 1.8 |
| Intervention Planning Visit (4 rooms) | 7.1 | 1.8 |
| Intervention Planning Visit (all rooms) | 6.4 | 2.3 |
| Number of Hazards (Stairs) | ||
| Baseline | 4.0 | 2.0 |
| Intervention Planning Visit | 3.4 | 1.9 |
paired t-test between 4-rooms at BHV and IPV, p<0.0001
Table 4. Correlation of the Mean Number and Density (Number per 100 square feet) of Residential Injury Hazards (N=163).
| Pearson r | p-value | |
|---|---|---|
| Correlation of Baseline Home Visit with Intervention Planning Visit | ||
| Number of Hazards (4 rooms) | 0.50 | <0.0001 |
| Density of Hazards (4 rooms) | 0.75 | <0.0001 |
| Number of Hazards (Stairs) | 0.51 | <0.0001 |
| Correlation of 4 rooms with all rooms for Intervention Planning Visit | ||
| Number of Hazards | 0.17 | 0.03 |
| Density of Hazards | 0.52 | <0.0001 |
The number and density of hazards for the 4-rooms were significantly correlated with the number and density for the whole household at the IPV (r=0.17, p=0.03 and r=0.52, p<0.0001, respectively). In order to assess agreement we followed the methodology proposed by Bland and Altman.22 Briefly, this approach examines the difference between individual measures and the mean across all measures taken allowing for examination of bias, precision, and outliers. We found minimal correlation between the difference and sum for both the number of hazards and the density for the total of the 4 areas at the two time points (r=0.08 and 0.009 respectively). Thus, Bland-Altman figures show no systematic bias and only 4 (2.5%) of the data points were outside the limits of agreement for number or density of hazards. Similar results were seen when we assessed the rooms individually.
We found that the number and density of hazards were correlated over time for the individual rooms, but the density of hazards was consistently more highly correlated than the number of hazards (Table 4). The number of hazards in the stairways was also highly correlated between the BHV and IPV (Table 4, r=0.51, p<0.0001). The number and density of hazards varied significantly by room of the home, with the kitchen having the highest number of hazards at both BHV and IPV, 10.3 and 11.7 respectively. In contrast, the child's bathroom had the highest mean density at the BHV and IPV, with 15.8 and 16.5 hazards per 100 sq.ft., respectively (Figure 2).
Figure 2.
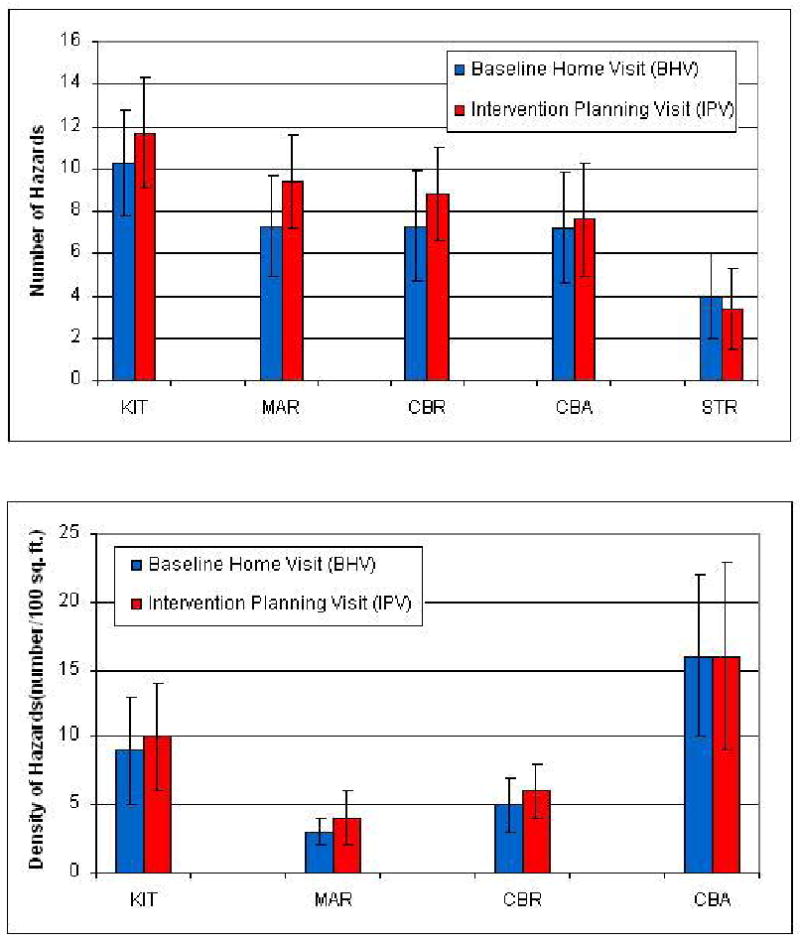
Number and Density (Number per 100 square feet) of Hazards by Room at the Baseline Home Visit and Intervention Planning Visit (N=163).
We assessed the agreement between seven research assistants using the instrument in 100 randomly assigned rooms evaluated within hours of each other. In general, agreement was strong; with Kappa scores ranging from 0.65 and 0.66 for free standing furniture and accessible choking hazards to 0.94 and 1.00 for oven door guards and accessibility of fire escapes on the 2nd floor and higher (Table 5). The overall agreement across hazards assessed between research assistants was 0.81, reflecting excellent agreement. In fact, 22 of the 26 items showed excellent agreement, as defined by a Kappa of 0.70 or more.
Table 5. Correlation of the Number and Density (Number per 100 square feet) of Injury Hazards by Room for the Baseline Home Visit and Intervention Planning visit (N=163).
| Pearson r | p-value | |
|---|---|---|
| Kitchen | ||
| Number of Hazards | 0.42 | <0.0001 |
| Density of Hazards | 0.77 | <0.0001 |
| Main Activity Room | ||
| Number of Hazards | 0.41 | <0.0001 |
| Density of Hazards | 0.66 | <0.0001 |
| Child's Bedroom | ||
| Number of Hazards | 0.30 | <0.0001 |
| Density of Hazards | 0.59 | <0.0001 |
| Child's Bathroom | ||
| Number of Hazards | 0.44 | <0.0001 |
| Density of Hazards | 0.52 | <0.0001 |
| Stairs | ||
| Number of Hazards | 0.51 | <0.0001 |
We assessed the external validity of the instrument by examining correlations of the number and density of identified hazards with some recognized risk factors for childhood injury measured within the HOME Study. In general, the number of hazards was not significantly correlated with the risk factors examined. In contrast, the density of hazards was positively and significantly correlated with maternal depressive symptoms and significantly negatively correlated with maternal age and income (Table 6). The number and density of hazards were not associated at the BHV with the level of maternal education (number, p=0.84, density, p=0.36) or IPV (number, p=0.35, density, p=0.06), using analysis of variance.
Table 6. Kappa Scores for Research Assistants Surveying 100 randomly assigned rooms.
| Observed Hazard | Kappa |
|---|---|
| Visible sharps on surfaces <1 meter from floor | 0.70 |
| Sharps in cabinets, drawers, closets without working locks | 0.74 |
| Furniture <1 meter from floor with exposed sharp edges or corners | 0.70 |
| Glass surfaces as part of doors or furniture | 0.73 |
| Poisons visible <1 meter from floor: candles and soaps | 0.80 |
| Poisons visible <1 meter from floor other than candles or soaps | 0.77 |
| Poisons in cabinets, drawers, closets without working locks <1 meter from floor | 0.77 |
| Do potential poisons in cabinets, drawers, closets have safety cap devices | 0.68 |
| Shelves, tables, dressers, cabinets <1 meter from floor which could be climbed upon by child < 6 years of age | 0.72 |
| Freestanding and unstable shelves, tables, dressers, cabinets, could be pulled over by child <6 years of age | 0.65 |
| Electronic equipment could be pulled over by child <6 yrs (TV, VCR, microwave oven, etc.) | 0.74 |
| Rugs, carpets not fixed firmly to floor | 0.89 |
| Slats of infant's crib >6cm apart | 0.89 |
| Rails or safety guards on beds where kids <4 years sleep | 0.65 |
| Windows with lower ledge <1 meter from floor have working guards, locks, restricted openings (<10 centimeter) | 0.87 |
| Non-slip tread in bathtub | 0.88 |
| Water temperature (<120 degrees F) | 0.92 |
| Type of stove in kitchen | 0.88 |
| Stove top <1 meter from floor | 1.00 |
| Stove top protectors restricting access | 0.93 |
| Oven with working door with guard or locks | 0.94 |
| Electrical sockets accessible < 1 meter from floor | 0.95 |
| Electrical appliances on surfaces < 1 meter from floor | 0.72 |
| Objects smaller fit into choke tube (smaller diameter than ping pong ball) on surfaces <1 meter from floor | 0.66 |
| Fire escape ladders available and accessible on 2nd floor and higher | 1.00 |
| Any power, electrical, or window blind cords hanging to within 1 meter of floor | 0.90 |
Discussion
The HOME Injury Survey, a tool to quantify unintentional injury hazards in the indoor environment of homes with young children, was reliable with good correlation and agreement over time and replicable with good agreement between research assistants assessing identical rooms. In addition, the HOME Injury survey was externally valid; that is, it was correlated with some of the known risk factors for childhood injury including maternal depressive symptoms, household income, and maternal age. Finally, although it was not a random sample of rooms, the 4 high-risk, high-exposure rooms identified by parents were significantly correlated with the mean number and density of hazards for the whole household.
The density of injury-related hazards in the home (number of hazards per area) was a more reliable and valid measure of childhood injury hazards than the number of hazards. It was not obvious why this is the case. “Standardizing” the number of measured hazards by dividing by the exposed area of a room or household might reduce the degree of variation between visits, but this is unlikely as the coefficient of variation (s.d. / mean) was slightly higher for the mean density than the mean number of hazards (Table 3) indicating greater variability around this metric. In addition, the Bland and Altman analysis showed good agreement for hazard density over time between the BHV and IPV measurements and between the abbreviated 4-room survey and the comprehensive survey of the entire living space completed at the IPV.21, 22 Although we could not directly measure a child's exposure (through video, time-lapse analysis) to specific hazards, it is likely that the density is a better indicator of a child's probability of encountering a hazard – that is, the higher the density of hazards, the more likely a child will encounter a hazard. This conclusion is supported by the significant correlation of injury hazard density with some known risk factors for childhood injury. 16, 20
Although the HOME Injury Survey has good reliability, replicability, and external validity, the ultimate validation of this instrument is whether it predicts childhood injury. Thus, future studies will need to examine whether the mean number or density of hazards quantified by this or other instruments predict reports of injury during early childhood.
The HOME Injury Survey was shown to be replicable and efficiently administered by research assistants who evaluated the same 100 randomly assigned rooms within hours of each other. Kappa scores were generally strong, with a mean of 0.81. Lower Kappa scores were measured for the presence of child safety caps on medicines and the presence of movable furniture, but these still represented moderate to strong agreement between research assistants. The highest Kappa scores were achieved for assessment of stove top height and accessibility and the presence of fire escape ladders.
We found that the density of injury hazards identified by the HOME Injury Survey was associated with some recognized risk factors for childhood injury including maternal depressive symptoms and socio-economic indicators, such as income and maternal age. 1, 16, 20, 23, 24 The finding that household income and maternal age are inversely correlated with a higher density of injury-related hazards may help to illuminate the associations found in prior research on childhood injury.20 Younger parents or those with lower educational or income levels may not have the training or resources necessary to make their homes safe through the purchase and installation of home safety products.6, 20, 25 It also is likely that mothers with higher levels of depressive symptoms have diminished ability to maintain a safe environment.16, 26 This may explain the association of depressive symptoms with the density of hazards observed in this study and increased risk of childhood injury in other studies.16, 24
Home hazard survey instruments are essential to understand mechanisms of injury and effective ways to control it. Although there has been progress on indoor safety (i.e. safe tap water temperature, fire resistant clothing and building materials) over the past three decades and injury rates appear to be on the decline2, 27-29, racial disparities persist and further reductions in home injury will require continued innovation.
The prevention of home injuries has typically relied on provision of safety devices and teaching parents about supervision or their children about home safety rules.5, 12, 13, 17, 30-32 There have been several studies and a systematic review of the effect of education, counseling and provision of free or reduced cost safety devices with the aim of controlling residential injuries. These educational interventions have produced increases in parental knowledge and the use of safety devices, but they have not examined or reported a reduction of injury outcomes in the participants.5, 12, 25, 33 To understand if a residential injury control intervention is effective, we need accurate, reliable, and valid measures of exposure to potential injury hazards in the homes of young children.
There are several limitations of this study. Many hazards in the home environment are dynamic. Still, despite the fact that hazards may change or be moved between rooms over time, we found that our density measures were highly correlated and exhibited good agreement over time. Although the correlations for the number and density of hazards between the 4-rooms and whole household were moderate, the selection of the 4 high-exposure, high-risk areas and stairways was based on prior studies of parenting perceptions and behaviors toward residential injury risk and therefore may represent a biased sample of areas of the home. 7, 13, 14 Nevertheless, the strong correlation of the 4 high-risk rooms with the whole house indicated that these rooms can be sampled to assess housing units for injury hazards in epidemiologic studies. This cohort of mothers, their children, and homes represented a more affluent and educated group; however, almost 40 percent lived below the median household income for the US ($50,233.) and 25 percent were near or below the poverty level ($21, 200. annual income in 2008 for a family of four). Mothers participating in this study were similar to the age (country-wide mean 27.3 yrs.) and racial and ethnic backgrounds of mothers who gave birth in the 5 counties from which they were enrolled: 72% white, non-Hispanic, 21% Black, and 5% Hispanic, and 2% other (Ohio 2007 birth certificate data). The HOME Injury Survey instrument was based upon residential injury mechanisms specific to US urban, suburban, and rural households. Although the instrument may be of utility in more developed nations similar to the US where younger children spend a great deal of their time in the indoor environment, it was not designed for use in underdeveloped nations and different cultures where home environments and the time spent indoors is likely to be qualitatively different.
Conclusion
The HOME Injury Survey is a reproducible and reliable instrument to assess the home environment for injury-related hazards for young children. The density of injury hazards (number of hazards per area) was a more reliable, replicable, and valid measure of home injury hazards compared with the number of hazards. Before this instrument is routinely used, however, future studies are needed to test the predictive ability for injury-related hazards measured with injury events in prospective cohorts of young children.
What is already known on this subject
Unintentional injuries in the homes of children contribute substantially to their health services burden, morbidity, and mortality in the US including more than 4 million emergency visits, over 70,000 hospitalizations, and more than 2,800 preventable deaths annually.
Although unintentional injuries and deaths that occur in the home are generally believed to be preventable, there are no validated tools to identify and quantify residential injury hazards.
What this study adds
The HOME Injury Survey, a 55-item tool to quantify unintentional injury hazards in the indoor environment of homes with young children, was reliable, valid, and replicable between different users and over time.
The HOME Injury Survey was correlated with reported risk factors for childhood injury (externally valid) including maternal depressive symptoms, household income, and maternal age.
Four high-risk, high-exposure rooms (kitchen, main activity room, child's bathroom, and child's bedroom) identified by parents in prior reports were shown to be representative of similar injury hazards found throughout the entire household.
The density of unintentional injury-related hazards (number of hazards per area) was a more reliable and valid measure of childhood residential hazards than the total number of hazards.
Table 7. Correlations (Pearson r (p-value)) for the Number and Density (Number per 100 square feet) of residential hazards at Baseline Home Visit and Intervention Planning Visit according to maternal socio-economic characteristics (N=163).
| Prenatal BDI | 4-week BDI | Maternal Age | Income | |
|---|---|---|---|---|
| Baseline Home Visit (4 rooms) | ||||
| Number | 0.20 (0.01) | 0.01 (0.91) | -0.03 (0.72) | -0.09 (0.24) |
| Density | 0.28 (0.0004) | 0.17 (0.03) | -0.12 (0.12) | -0.25 (0.002) |
| Intervention Planning Visit (4 rooms) | ||||
| Number | 0.04 (0.58) | 0.01 (0.87) | -0.10 (0.20) | -0.12 (0.13) |
| Density | 0.21 (0.008) | 0.22 (0.006) | -0.20 (0.01) | -0.31 (<0.0001) |
BDI – Beck Depression Inventory
Acknowledgments
K. Phelan supported by: 1K23HD045770-01A2 Career Development Award from the National Institute of Child Health and Development (NICHD)
B. Lanphear supported by: the National Institute of Environmental Health Sciences and US Environmental Protection Agency (PO1-ES11261) and the National Institutes for Environmental Health Sciences (R01ES014575).
Footnotes
NIH Trial Registration (www.clinicaltrials.gov): NCT00129324
Presented at the Pediatric Academic Society Meetings, Honolulu, HI May 3, 2008
The Corresponding Author has the right to grant on behalf of all authors and does grant on behalf of all authors, an exclusive licence (or non-exclusive for government employees) on a worldwide basis to the BMJ Publishing Group Ltd and its Licensees to permit this article (if accepted) to be published in IP and any other BMJPGL products to exploit all subsidiary rights, as set out in our licence.
Neither Dr. Phelan, Dr. Lanphear, Dr. Khoury, nor Yingying Xu have any conflicts of interest nor competing interests to declare.
References
- 1.Phelan KJ, Khoury JC, Kalkwarf HJ, Lanphear BP. Residential Injuries in US Children and Adolescents. Public Health Rep. 2005;120(1):63–70. doi: 10.1177/003335490512000111. [DOI] [PMC free article] [PubMed] [Google Scholar]
- 2.Nagaraja J, Menkedick J, Phelan KJ, Ashley P, Zhang X, Lanphear BP. Deaths from residential injuries in US children and adolescents, 1985-1997. Pediatrics. 2005;116(2):454–461. doi: 10.1542/peds.2004-1415. [DOI] [PubMed] [Google Scholar]
- 3.DiGuiseppi C, Roberts I, Wade A, et al. Incidence of fires and related injuries after giving out free smoke alarms: cluster randomised controlled trial. Bmj. 2002 Nov 2;325(7371):995. doi: 10.1136/bmj.325.7371.995. [DOI] [PMC free article] [PubMed] [Google Scholar]
- 4.Johnston B, Britt J, D'Ambrosio L, Mueller BA, Rivara FP. A preschool program for safety and injury prevention delivered by home visitors. Injury Prevention. 2001;6:305–309. doi: 10.1136/ip.6.4.305. [DOI] [PMC free article] [PubMed] [Google Scholar]
- 5.Posner JC, Hawkins LA, Garcia Espana F, Durbin DR. A randomized, clinical trial of a home safety intervention based in an emergency department setting. Pediatrics. 2004;113(6):1603–1608. doi: 10.1542/peds.113.6.1603. [DOI] [PubMed] [Google Scholar]
- 6.Quinlan KP, Sacks JJ, Kresnow M. Exposure to and compliance with pediatric injury prevention counseling--United States, 1994. Pediatrics. 1998;102(5):e55. doi: 10.1542/peds.102.5.e55. [DOI] [PubMed] [Google Scholar]
- 7.Watson M, Kendrick D, Coupland C. Validation of a home safety questionnaire used in a randomised controlled trial. Injury Prevention. 2003;9:180–183. doi: 10.1136/ip.9.2.180. [DOI] [PMC free article] [PubMed] [Google Scholar]
- 8.Robertson AS, Rivara FP, Ebel BE, Lymp JF, Christakis DA. Validation of parent self reported home safety practices. Inj Prev. 2005;11(4):209–212. doi: 10.1136/ip.2005.009019. [DOI] [PMC free article] [PubMed] [Google Scholar]
- 9.Greaves P, Glik D, Kronenfeld JJ, Jackson K. Determinants of controllable in-home child safety hazards. Health Educ Res. 1994;9(3):307–315. [Google Scholar]
- 10.Hatfield PM, Starensic AG, Sorkness CA, Peterson NM, Schirmer J, Katcher ML. Validating self reported home safety practices in a culturally diverse non-inner city population. Inj Prev. 2006;12:52–57. doi: 10.1136/ip.2005.009399. [DOI] [PMC free article] [PubMed] [Google Scholar]
- 11.Armstrong BK, White E, Saracci R. Principles of Exposure Measurement in Epidemiology. Vol. 21. Oxford, UK: Oxford University Press; 1992. Validity and Reliability Studies; pp. 78–114. [Google Scholar]
- 12.Kendrick D, Coupland C, Mulvaney C, et al. Home safety education and provision of safety equipment for injury prevention. Cochrane Database Syst Rev. 2007;(1):CD005014. doi: 10.1002/14651858.CD005014.pub2. [DOI] [PubMed] [Google Scholar]
- 13.Glik DC, Greaves P, Kronenfeld J, Jackson K. Safety Hazards in Households with Young Children. J Pediatr Psych. 1993;18(1):115–131. doi: 10.1093/jpepsy/18.1.115. [DOI] [PubMed] [Google Scholar]
- 14.Morriongiello BA, Ondejko L, Littlejohn A. Understanding toddlers' in-home injuries: II. Examining parental strategies, and their efficacy, for managing child injury risk. J Pediatr Psych. 2004;29(6):433–446. doi: 10.1093/jpepsy/jsh047. [DOI] [PubMed] [Google Scholar]
- 15.Fleiss J. The Measurement of Interrater Agreement. In: Bradley R, Hunter J, Kendall D, Watson G, editors. Statistical Methods for Rates and Proportions. 2. New York: John Wiley & Sons; 1981. pp. 211–236. [Google Scholar]
- 16.Phelan K, Khoury J, Atherton H, Kahn RS. Maternal depression, child behavior, and injury. Inj Prev. 2007 Dec;13(6):403–408. doi: 10.1136/ip.2006.014571. [DOI] [PMC free article] [PubMed] [Google Scholar]
- 17.Morrongiello BA, Corbett M, McCourt M, Johnston N. Understanding unintentional injury risk in young children II. The contribution of caregiver supervision, child attributes, and parent attributes. J Pediatr Psychol. 2006 Jul;31(6):540–551. doi: 10.1093/jpepsy/jsj073. [DOI] [PubMed] [Google Scholar]
- 18.Beck AT, Ward CH, Mendelson M, Mock J, Erbaugh J. An inventory for measuring depression. Arch Gen Psychiatry. 1961;4:561–571. doi: 10.1001/archpsyc.1961.01710120031004. [DOI] [PubMed] [Google Scholar]
- 19.Lasa L, Ayuso-Mateos JL, Vazquez-Barquero JL, Diez-Manrique FJ, Dowrick CF. The use of the Beck Depression Inventory to screen for depression in the general population: a pre-liminary analysis. J Affective Disorders. 2000;57:261–265. doi: 10.1016/s0165-0327(99)00088-9. [DOI] [PubMed] [Google Scholar]
- 20.Scholer SJ, Hickson GB, Ray WA. Sociodemographic factors identify US infants at high risk of injury mortality. Pediatrics. 1999;103:1183–1188. doi: 10.1542/peds.103.6.1183. [DOI] [PubMed] [Google Scholar]
- 21.Altman DG, Bland JM. Measurement in Medicine: the Analysis of Method Comparison Studies. The Statistician. 1983;32:307–317. [Google Scholar]
- 22.Bland JM, Altman DG. Statistical Methods for Assessing Agreement Between Two Methods of Clinical Measurement. Lancet. 1986;i:307–310. [PubMed] [Google Scholar]
- 23.Chung EK, McCollum KF, Elo IT, Lee HJ, Culhane JF. Maternal Depressive Symptoms and Infant Health Practices Among Low-Income Women. Pediatrics. 2004;113:e523–3529. doi: 10.1542/peds.113.6.e523. [DOI] [PubMed] [Google Scholar]
- 24.McLennan JD, Kotelchuck M. Parental prevention practices for young children in the context of maternal depression. Pediatrics. 2000 May;105(5):1090–1095. doi: 10.1542/peds.105.5.1090. [DOI] [PubMed] [Google Scholar]
- 25.Gielen AC, Wilson MEH, McDonald EM, et al. Randomized Trial of Enhanced Anticipatory Guidance for Injury Prevention. Arch Pediatr Adolesc Med. 2001;155:42–49. doi: 10.1001/archpedi.155.1.42. [DOI] [PubMed] [Google Scholar]
- 26.Morrongiello BA. Caregiver supervision and child-injury risk: I. Issues in defining and measuring supervision; II. Findings and directions for future research. J Pediatr Psychol. 2005 Oct-Nov;30(7):536–552. doi: 10.1093/jpepsy/jsi041. [DOI] [PubMed] [Google Scholar]
- 27.Feldman KW. Tap water scald burns in children. Pediatrics. 1978;62(1):1–7. [PubMed] [Google Scholar]
- 28.Phelan KJ, Khoury J, Kalkwarf H, Lanphear B. Residential injuries in U.S. children and adolescents. Public Health Rep. 2005 Jan-Feb;120(1):63–70. doi: 10.1177/003335490512000111. [DOI] [PMC free article] [PubMed] [Google Scholar]
- 29.Grossman DC. The history of injury control and the epidemiology of child and adolescent injuries. Future Child. 2000;10(1):23–52. [PubMed] [Google Scholar]
- 30.Garling A, Garling T. Mothers' Anticipation and Prevention of Unintentional Injury to Young Children in the Home. J Pediatr Psych. 1995;20(1):23–36. doi: 10.1093/jpepsy/20.1.23. [DOI] [PubMed] [Google Scholar]
- 31.Kendrick D, Barlow J, Hampshire A, Polnay L, Stewart-Brown S. Parenting interventions for the prevention of unintentional injuries in childhood. Cochrane Database Syst Rev. 2007;(4):CD006020. doi: 10.1002/14651858.CD006020.pub2. [DOI] [PubMed] [Google Scholar]
- 32.Morrongiello BA, Corbett M, McCourt M, Johnston N. Understanding unintentional injury-risk in young children I. The nature and scope of caregiver supervision of children at home. J Pediatr Psychol. 2006 Jul;31(6):529–539. doi: 10.1093/jpepsy/jsj045. [DOI] [PubMed] [Google Scholar]
- 33.Gielen AC, McDonald EM, Wilson MEH, et al. Effects of Improved Access to Safety Counseling, Products, and Home Visits on Parents' Safety Practices - Results of a Randomized Trial. Arch Pediatr Adolesc Med. 2002;156:33–40. doi: 10.1001/archpedi.156.1.33. [DOI] [PubMed] [Google Scholar]