Abstract
The hardware-based Anti-Brownian ELectrokinetic trap (ABEL trap) features a feedback latency as short as 25 µs, suitable for trapping single protein molecules in aqueous solution. The performance of the feedback control loop is analyzed to extract estimates of the position variance for various controller designs. Preliminary data are presented in which the trap is applied to the problem of determining the distribution of numbers of ATP bound for single chaperonin multi-subunit enzymes.
Keywords: electrokinetic trap, Brownian motion, chaperonin, single molecule, multi-subunit enzymes, fluorophore counting
1. INTRODUCTION
Trapping and manipulating individual molecules in solution can allow the experimenter to measure intra-molecular movements, to explore intermolecular interactions, and to construct novel nanostructures. When molecules are measured one-by-one, probability distributions can be extracted which are not accessible in conventional ensemble measurements. Thus the ability to trap and manipulate single molecules in solution has always been an attractive goal. While laser tweezers allow trapping of a molecule attached to a large polarizable bead, tweezers cannot trap nanoscale objects less than about 50 nm in diameter. Here our interest is in trapping truly small objects less than 50 nm in size, without using optical forces or large beads. Our Anti-Brownian ELectrokinetic trap (ABEL trap) [1] makes this possible by directly sensing the position of the small object in each time interval, and then using electrokinetic forces in a closed-loop active feedback system to suppress Brownian motion. The first implementations of this idea used camera-based position sensing [2], which limited the update rate and did not allow trapping of the smallest objects. In recent work, this limitation was removed by a hardware-based design [3], to be described here.
To dynamically trap an individual small molecule in solution, the main challenge for the feedback system is to act quickly enough to cancel the Brownian motion of the molecule. The primary limitations on the feedback latency are the latency of detecting the displacement of the molecule and the latency of moving the molecule back to the center of the field of view. In previous tracking or trapping experiments, the feedback latency was either limited by the speed of detection [1,2,4,5] or the speed of applying feedback [6–13]. Our hardware-based ABEL trap has a feedback latency as short as 25µs, which allows us to trap individual protein molecules in buffer. The trap detects the movement of a fluorescent object with a 40kHz rotating beam, which speeds up the detection of displacements to essentially the photon detection rate. This rotating beam detecting scheme was originally proposed by Enderlein [6] and first implemented by Berglund and Mabuchi [7,9] for particle tracking. Meanwhile, in the electrokinetic force system we are using, the particle’s response to the feedback field is much faster than the 40kHz overall bandwidth of the hardware ABEL trap and thus is not a limitation [3,14].
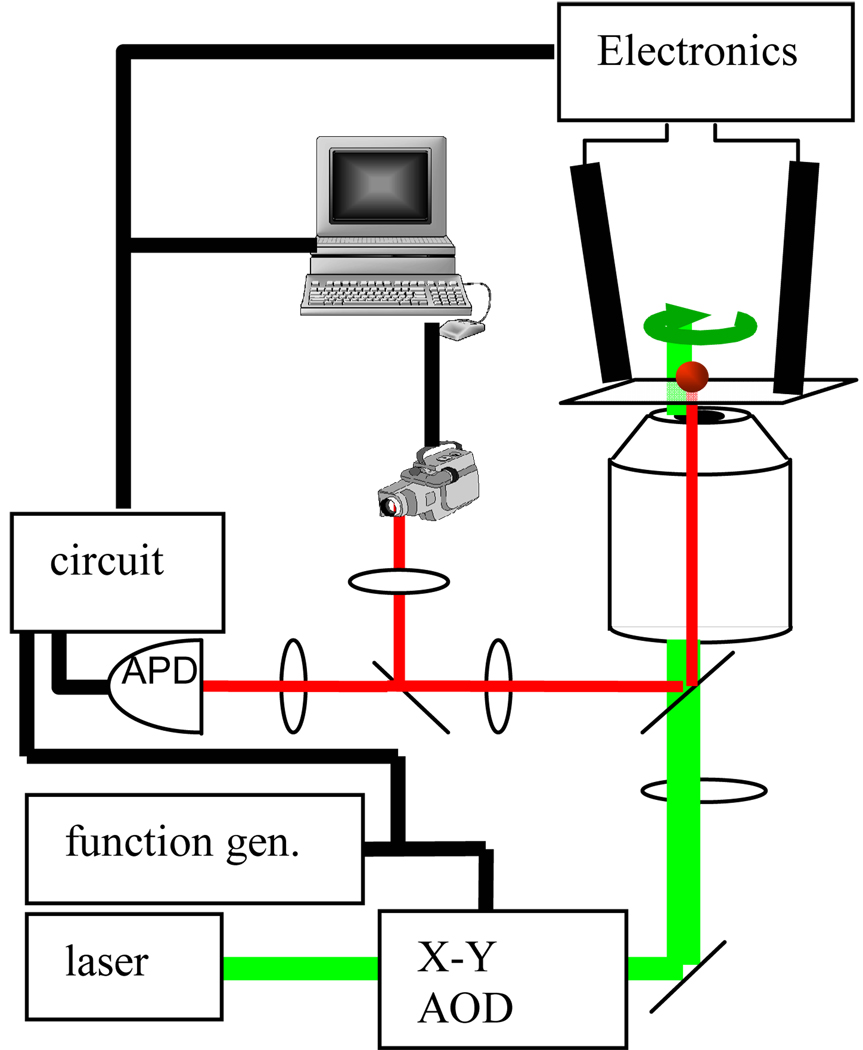
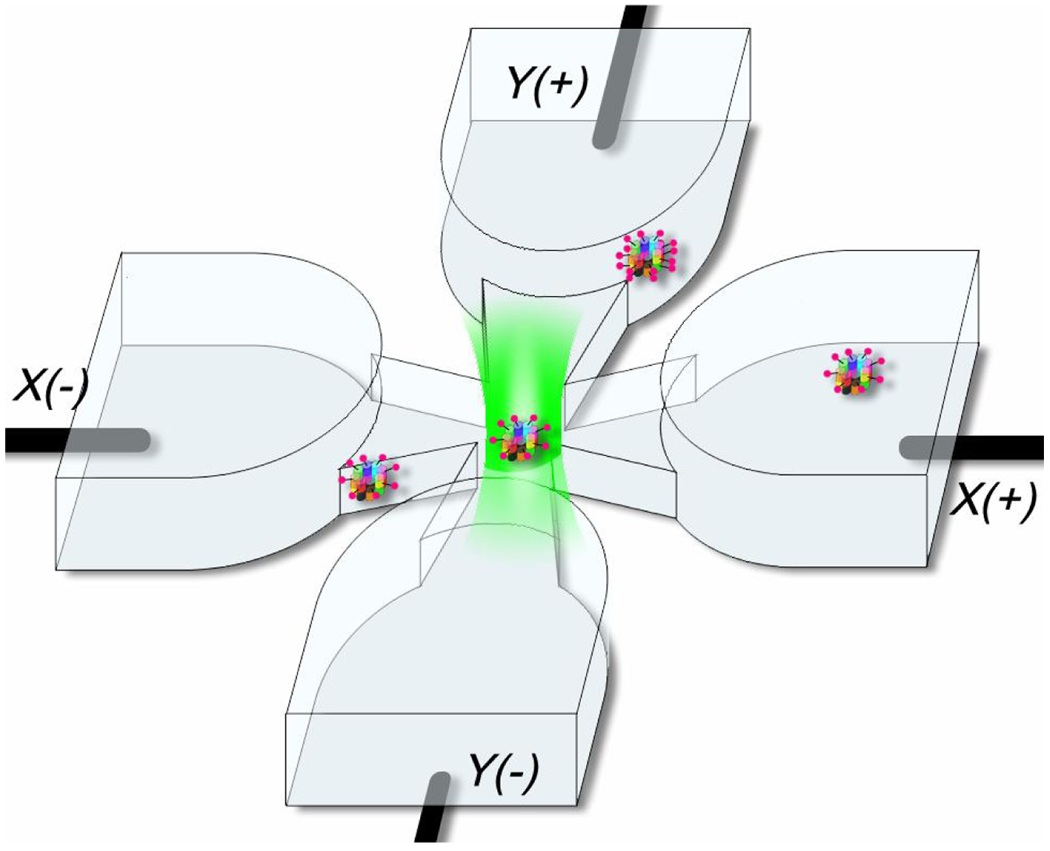
The basic configuration of the hardware-based ABEL trap is shown in Figure 1; for full details, see [3]. A collimated 532 nm laser beam is diffracted by a pair of acousto-optic deflectors controlled by a function-generating data acquisition board to scan around a small cone angle at 40 kHz. The beam is then coupled into the oil-immersion objective (100x, NA 1.3) of an inverted microscope so that in the sample plane the scanning laser beam is focused to a rotating spot. The photons emitted by the fluorescent object are collected by an avalanche photodiode photon-counting detector. When the fluorescent object is in the center of the rotation its emission is not modulated, but when the object moves off-center, the emission becomes modulated at 40 kHz, and the phase of this modulation contains information about the x,y direction of the displacement. The signals from the APD and the reference signal, which is a copy of the AOD control signal, are analyzed by a home-made lock-in circuit to determine the displacement of a fluorescent object, which yields the control voltages applied to the electrodes of the microfluidic cell. The output of the lock-in circuit is amplified by a pair of high-voltage amplifiers and applied to the two pairs of electrodes positioned at the end of the four microfluidic channels (Fig. 2). The corresponding drift force is then applied via the microfluidic geometry to the target object in order to cancel the displacement relative to the center of the rotating beam.
Figure 1.
Schematic of the hardware-feedback ABEL trap.
Figure 2.
Cartoon of the microfluidic geometry, showing a labeled protein trapped in the center of the trapping region (not to scale). The microfluidic cell is made of fused silica as previously described [3]. Channels are etched in fused silica wafers, thin in the trapping region, and deep in the regions extending out to the electrodes. The patterned wafer is bonded to a quartz coverslip with a thin layer of sodium silicate solution. The depth of the cell used in this study along the axial direction is 750nm in the trapping region, while the transverse dimensions of the thin trapping region are ~20µmx20µm.
For small objects with high diffusion coefficient, one wishes to run the rotation rate at a high speed in order to obtain information on the Brownian displacements as quickly as possible. While the electrokinetic response rate itself appears to not be limiting in our system, the accuracy of position detection may become a limitation. In fact, for objects with emission rate less than 40kHz, the current ABEL trap system is using the information from individual detected photons to apply feedback. This situation demands the ultimate from the feedback system, and may leave it particularly vulnerable to the measurement noise. Section 2 of this paper describes a Monte Carlo simulation of the feedback controller in the ABEL trap, which shows possible routes to improvement of the control system. Section 3 presents preliminary work on single trapped chaperonin molecules, where the ABEL trap is used to count the numbers of ATP molecules bound to a multi-subunit enzyme.
2. SIMULATIONS OF TRAP PERFORMANCE
For optimal implementation of the hardware ABEL trap, the design of an efficient feedback controller is essential. We used Monte-Carlo simulation as a test bed for different controller structures. The simulations reveal the effect of measurement noise introduced by photon counting statistics; they also provide guidance in choosing the optimum controller design and experimental parameters for future developments. We will describe the simulation of two families of algorithms: a model based on phase estimation (current implementation) [3,14] and a linearized model based on lock-in detection, which was previously proposed for particle tracking experiments [9].
2.1 Method based on phase estimation
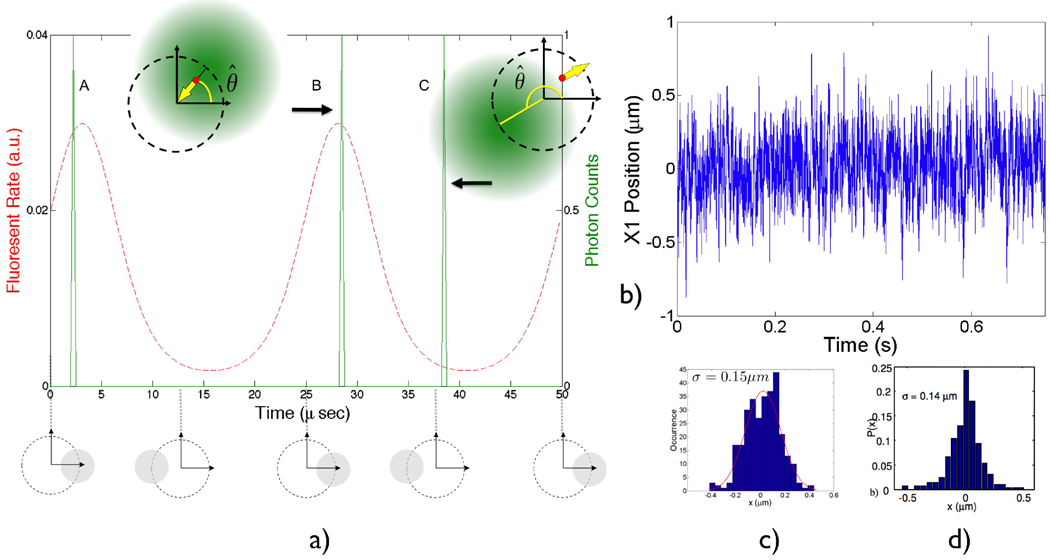
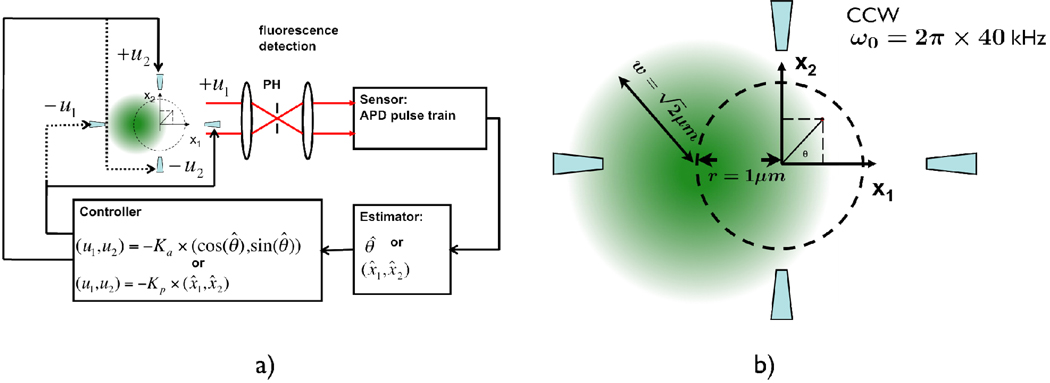
The phase estimation method works by trying to determine the polar angle θ (phase) of the fluorescent particle in real time and then applying a force to the opposite direction of the unit vector determined by θ (Fig. 4b). Since the fluorescent photon is most likely to be detected when the rotation spot and the particle have the same phase angle, it is reasonable to estimate the phase of the particle (θ̂) to be the same as the phase angle of the laser spot when a photon is detected. The phase angle determines a unit vector pointing radially outward from the trapping center. Subsequently, a pair of X and Y voltages are generated in the opposite direction of the unit vector in an attempt to bring the particle back to origin. The closed-loop block diagram is shown in Fig. 3a.
Figure 4.
a) Illustration of the photon-by-photon phase–sensitive detection method. Two rotation periods are shown. The fluorescent particle is fixed at (0.5, 0.5) µm in the trapping plane for illustration. The average fluorescence rate (red, dashed) is the result of the laser spot modulation having peaks at 45 degrees of phase. The actual photons detected (A, B and C, green, solid) are a Poisson realization of the modulated fluorescence rate (assuming nominal count rate of 1 photon per cycle). The resulting feedback forces (yellow arrow) of cases B and C are also shown, where photon C is the “noisy” photon that tends to push the particle away from the trapping center. θ̂ is the estimated phase. b) Simulated trace (along one coordinate) of trapping a single molecule of the prokaryotic chaperonin GroEL in water (D=21µm2/s). The nominal fluorescence rate is set to 28kHz in the linear region to approximate experimental conditions where the photon counting rate drops from 40kHz to 10kHz during photo-bleaching steps [3], and the background count rate is set to 1kHz. c) Position histogram of the simulated trace (averaged over 2.5ms, see text). d) Experimental data from trapping single GroEL in the ABEL trap [14]. The position histogram is extracted from the trajectory of video images.
Figure 3.
a) Closed-loop block diagram of the ABEL trap. The signal flows of both phase-sensitive and position-sensitive algorithms are shown. Estimated quantities are denoted by a hat. See text for how the estimates are computed. b) Close-up view of the trapping region where the rotating laser spot is illustrated; the positions of the electrodes are shown schematically, but are actually very far away in the deep channels.
At low photon counting rates (≈1 count per cycle2), the phase estimation is marred by photon counting noise. (Fig. 4a, photon C) [15]. Measurement noise is then injected into the particle dynamics by the feedback controller, limiting the performance of the closed loop system.
Our simulation takes into account the Gaussian profile of the rotating laser beam, photon-counting statistics and background counts. Specifically, the rotating laser spot has a beam waist of w=1.414µm at the sample plane and is scanned on a circle (1µm in radius) at a frequency of 40kHz (Fig. 3b). Such a w/r ratio can easily be shown to produce uniform time-averaged intensity within the r < 0.5 µm region. A nominal photon-counting rate (i.e., the rate of fluorescent counts if the particle is fixed at the origin) is specified before each run. The simulation runs at 250ns time steps. During each step, the position of the particle is updated according to the following discrete-time dynamic equation:
in which x1,2 are the Cartesian coordinate positions of the particle (k is the discrete time index), µ11,22 are the diagonal components of the electrokinetic mobility tensor in unit of µm/(V-s) [3] with off-diagonal components ignored, u1,2 are the voltages applied, D is the diffusion coefficient and dWp is the Wiener increment with mean 0 and variance dt, driving the particle’s Brownian motion. Also calculated during the time interval is the fluorescence rate determined by the distance between the particle and the laser spot center. The rate in each time interval is considered to be constant and a Poisson realization of that rate determines whether any photon is detected. If so, a phase estimate (θ̂) is determined by the phase of the laser spot at the time step and the voltage vector is updated according to
where K is the gain determined before each run. If no photon arrives within the 250ns window, the voltage vector maintains its value from the previous time step.
Fig. 4b shows a simulated trace of trapping a chaperonin GroEL molecule (D=21µm2/s) in water. Fig. 4d shows the experimental position deviation3 obtained by trapping a single GroEL the ABEL trap [3]. The position information in constructing the histogram is from locating the centers of the images acquired on a CCD camera [3] with a sub-kHz frame rate, which smoothed out fast dynamics during the trapping process. In an attempt to compare the simulation to the actual experiment, the positions in Fig. 4b were averaged every 2.5ms (approx. the exposure time on the CCD) and then histogrammed to yield Fig. 4c. The simulation is in good agreement with experiment.
The photon-by-photon phase estimation method is straightforward to be implemented by analog circuitry [14], which has extremely low latency. However, this approach deliberately throws away information about the particle’s radial distance from the trapping center, the consequence of which being the particle will receive the same kicking strength whenever a photon is detected, even when it is close to the origin!
2.2 Method based on position estimation
The idea of using a lock-in amplifier to demodulate the fluorescent signal excited by a rotating laser spot was originally proposed by Enderlein [6] and analyzed in detail by Berglund and Mabuchi [9] in particle tracking experiments. Briefly, the expectation values of the lock-in quadrature outputs are proportional to the x1 and x2 positions of the particle, provided the particle stays close to the trapping (tracking) center. Those signals provide linear error signals for the controller to minimize. An additional advantage of such an approach is the availability of many efficient signal-processing tools in the linear control system literature such as the LQG (Linear Quadratic Gaussian) method [16,17].
We performed simulations of the ABEL trap with lock-in based position sensing in the linear region. The system can be formulated in the standard linear state space model in discrete time,
where the system dynamical equation is identical to the previous model with update time dt now set to 25µs (one rotation period). In the measurement equation, Δt is the integration time of the lock-in amplifier, set to an integer number of rotations for convenience. nm is the noise spectral density from the finite-bandwidth lock-in detection [8], determined by estimating the position of a fixed particle at different filtering bandwidths (Fig. 5a). dWm is the Wiener increment (independent of the Brownian motion increment dWp) with mean 0 and variance Δt, driving the measurement noise. p is the ratio between the integration time and update time (Δt/dt). The first term in the measurement equation takes into account the fact that in addition to the stochastic motion that a particle experiences, the particle also undergoes deterministic motion induced by the electrokinetic forces, thus it is more appropriate to model the lock-in outputs as sliding averages of the real particle positions during the integration periods.
Figure 5.
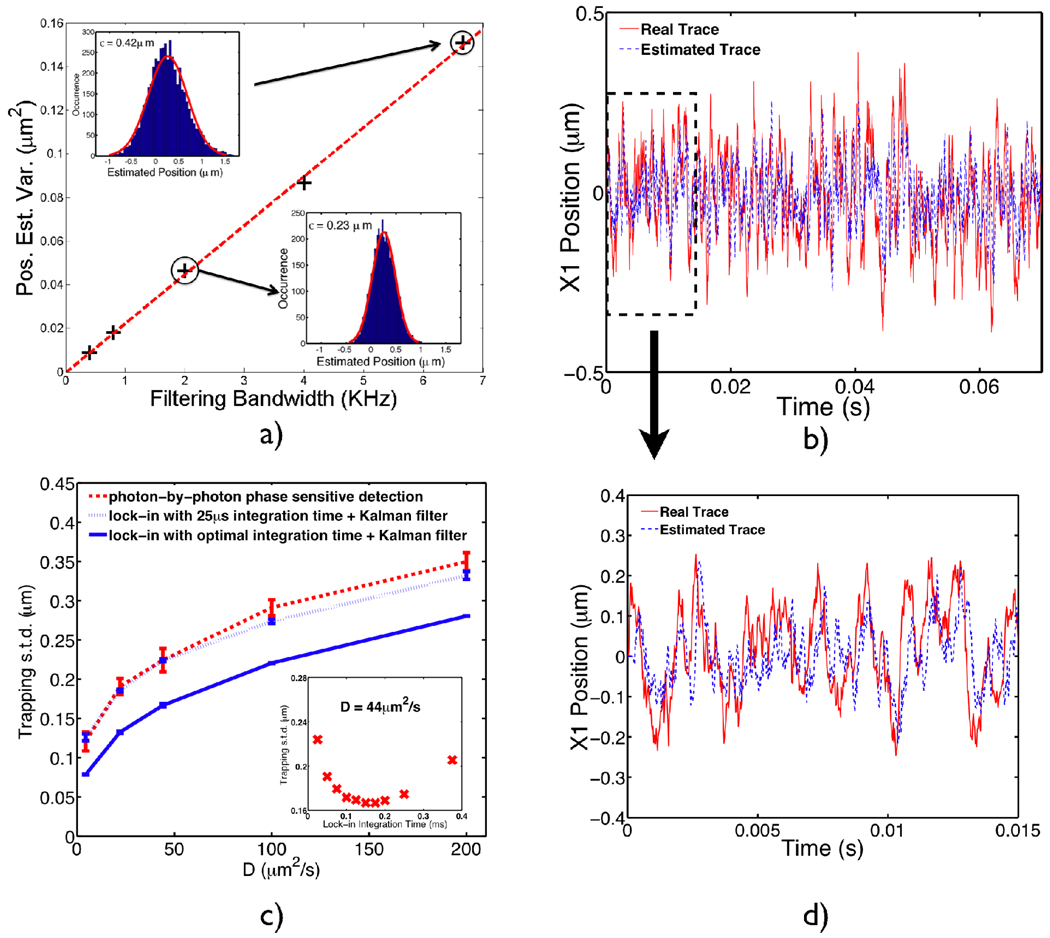
a) Characterization of the measurement noise spectrum density. A particle is fixed at (0.2, 0.2) µm in the trapping plane and a series of numerical experiments were performed to extract the particle’s position by demodulating the fluorescence signal using a simulated lock-in amplifier. The filtering bandwidths were the reciprocals of the lock-in integration times and the position estimation variance was acquired by fitting data with a Gaussian distribution (shown in insets for integrating 6 rotations and 20 rotations). The noise spectrum density obtained is 4.8×10⁻³µm /Hz1/2. b) Simulated trace (along one coordinate) of trapping a single molecule of GroEL in water, (D=21µm2/s ) by the position sensing (plus Kalman filter) algorithm. The photon counting rate is set to be 40kHz in this case. The red curve shows the real position evolution while the blue curve is the estimated trajectory. c) Trapping performance comparison between the photon-by-photon phase sensitive method (red, dashed) and position sensing method (blue, solid and dotted). The dashed blue curve shows the position-sensing algorithm operating at 25µs integration time while the solid blue curve shows optimal trapping performance by fine-tuning the lock-in integration times for different particles. An example of the optimal integration time for a D=44µm2/s particle is shown in the inset.
We implemented an estimator having the structure of a discrete-time Kalman filter [16] with the following update rule
where the "innovation gain" L is calculated by MATLAB’s dlqe routine according to process noise (determined by D and update time dt) and measurement noise (determined by nm and filtering bandwidth 1/ Δt) covariances. The feedback voltage is calculated by
with the gain matrix K calculated by MATLAB’s dlqr routine to minimize the cost function[17]
with weights chosen to emphasize trapping performance. (p >> q)
Fig. 5b shows a simulated trace of trapping a single molecule GroEL in water. It can be seen from the magnified view (Fig. 5d) that the estimator, although slightly lagged in time, does a respectable job in estimating the particle’s position. We compare the trapping performance of the two algorithms, namely, phase-sensitive feedback and lock-in based position-sensing feedback, in Fig. 5c. The two algorithms are comparable at high signal processing bandwidths (40kHz)4, which is not surprising since at such a small integration time (25µs), the lock-in behaves like a multiplier and the two algorithms become very similar.
The simulation also indicates an optimal trapping performance for different particles in the linear trapping region, when the lock-in demodulator is configured with an optimal integration time. The simulation results for a 10nm particle (D=44µm2/s) are shown in the inset of Fig. 5c, where an integration time of 0.15ms would yield the tightest trapping. The optimal values of integration time are determined for particles with different diffusion coefficients and the corresponding trapping standard deviations are plotted in Fig. 5c (blue, solid). Our results are in qualitative agreement with Berglund and Mabuchi [8], where they have treated the position estimation problem of freely diffusing particles.
Field-Programmable-Gate-Arrays devices hold great promise for the implementation of the position sensing feedback scheme, because of their enormous flexibility and low latency [18,19]. It would be interesting to find out how the optimized position-based method would help in one’s attempt to trap a single fluorophore, which is trappable according to the simulations (D for a single Rhodamine 6G molecule in water is 280µm2/s [20]). However, it is worth pointing out that in the fluorescence-based ABEL trap, the limiting factor is almost always the photo-physical properties of the tagging fluorophore [21]. Once the object becomes dark, you lose it no matter what. It is straightforward to modify the current ABEL trap setup to trap colloidal gold particles by scattering light, where the signal-to-noise can be much higher. In all these cases, we expect to see variations in trapping performance when different feedback schemes are implemented and compared.
3. APPLICATION TO ATP COUNTING IN MULTI-SUBUNIT ENZYMES
3.1 Introduction
One area in which the ABEL trap should be useful is in the study of multi-subunit enzymes such as chaperonins, proteasomes, AAA enzymes, and so on where each of many subunits can hydrolyze ATP. In these complexes, cooperativity in ATP binding is generally present and acts to control the conformations of the various subunits so as to make the overall enzyme operate as a small nanomachine. Determining the stoichiometry of multi-subunit enzymes is important in understanding the functionality and the cooperativity of these enzymes. Furthermore, a single-molecule stoichiometry study can reveal rich information about the heterogeneity and the dynamics. This kind of study has been previously implemented by counting the photobleaching steps of fluorophore labeled subunits [22,23]. In these experiments, the proteins are either membrane-bound or immobilized on glass slides so that stable photobleaching traces can be obtained. However, for non-membrane-bound proteins, a method with no surface immobilization is preferred to avoid disturbing the proteins. Thus we have been developing ways to use the ABEL trap to explore cooperativity in multi-subunit enzymes in buffer, starting with the eukaryotic protein-folding machine, TRiC.
The chaperonin TRiC consists of two eight-subunit rings, which form two cavities. Each subunit has a lid-like apical domain, which acts to open or close the cavity together with the apical domains in the other subunits, and an ATP-binding pocket [24]. The two cavities of TRiC switch between open and closed conformation upon the binding and hydrolysis of ATP. Therefore, the stoichiometry of the bound ATP and the chaperonins reflects the cooperativity between the subunits in the chaperonins [25]. If each ATP molecule is fluorescently labeled, our hardware-based ABEL trap offers the possibility of counting the number of ATP molecule on each chaperonin without immobilizing the enzymes to the surface.
In our current experiment, individual chaperonins with Cy3-labeled ATP bound and locked to the binding sites with AlFx are prepared and loaded into the microfluidic trapping cell. The off-time of ATP under these conditions is on the order of several hours. Since each ATP has a fluorophore on it, the intensity trace of each trapped TRiC/ATP/AlFx complex shows a step-wise decrease reflecting the photobleaching of individual fluorophores. The number of these steps and, therefore, the number of fluorescent ATP molecules on each chaperonin can be counted. To perform the experiment, samples with various incubation concentrations of ATP are prepared and studied with the ABEL trap. The distribution of the number of ATP molecules on each chaperonin is obtained for every TRiC molecule from the photon emission stream acquired with the trap.
In addition, in order to validate this method, we also covalently bound Cy3 to denatured actin and incubated the labeled actin with GroEL to form GroEL/Cy3-Actin complexes which have similar size as the TRiC/ATP-Cy3 complexes. The number of fluorophores on these GroEl/Cy3-Actin complexes are then counted by the same method and compared to the stoichiometry of actin labeling calculated from the bulk absorption assay.
3.2 Equipment and analysis method
The basic experimental setup was shown in Fig. 1 and Fig 2 above. In the chaperonin measurements, the radius of the circle around which the focus spot rotates is further modulated by a square wave which produces either a uniform illumination disk if averaged at a rate slower than 40 kHz or a ring. For the case of uniform illumination, the emission signal directly from the trap can also be used for the fluorescent intensity measurement. To achieve this, one copy of the signal from the APD is sent to a pulse counting data acquisition board and binned on the 1 ms scale.
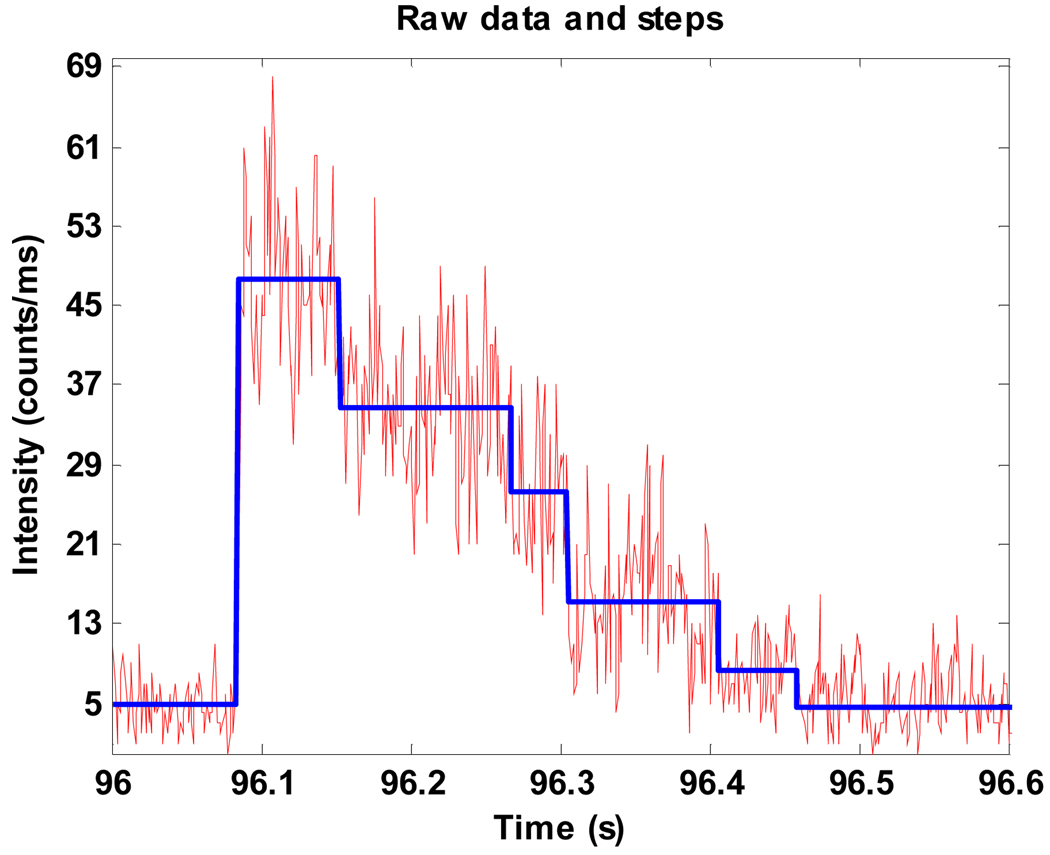
The binned intensity trace is analyzed with the maximum likelihood ratio test [26,27] to extract the intensity jumps reflecting the photobleaching of Cy3 molecules. Fig. 6 shows an example of the raw intensity trace from a single trapped molecule and the photobleaching steps resolved by this algorithm. However, not all the trapped complexes provide nice step-wise traces that can be counted directly to infer the number of fluorophores mainly due to two reasons: first, the Cy3 molecules blink, and second, the time between two photobleaching events is too short to be resolved at times. Thus, for each data trace, 20 events with nicely resolved photobleaching steps are manually picked to calculate the average intensity of a single fluorophore. Then the initial intensity of each complex right after it is trapped is calculated from the trace and divided by the average intensity of a single dye to estimate the number of Cy3-ATP molecules on each complex. Finally, the number of ATP molecules on every chaperonin can be histogrammed to build a number distribution of the ATP binding stoichiometry.
Figure 6.
A representing photobleaching trace for the TRiC/Cy3-ATP/AlFx complexes. The fluctuating red line: the raw intensity data. The thick stepped blue line: the steps found by the maximum likelihood ratio test.
3.3 Materials
Cy3-ATP was prepared by covalently binding Cy3-NHS (GE BioSciences) with N6-AminoHexyl-ATP (JenaBiosciences) at the N6 position. TRiC, MgCl2, Cy3-ATP, AlNO3 and NaF are rapidly mixed together in TRiC buffer (20mM HEPES, 50mM NaCl, 5mM MgCl2, 5% Glycerol) and incubated at room temperature for 45 minutes. The final concentrations of the components are: TRiC 0.25uM, MgCl2 10mM, Cy3-ATP 50uM to 1mM, AlNO3 1mM, NaF 6mM. The 20uL mixture is then filtered by P30 columns (Bio-rad, exchanged into TRiC buffer) twice to exclude the free ATP-Cy3. The final sample is further diluted as needed right before loading into the microfluidic cell.
Cy3-Actin was prepared by reacting an excess amount of Cy3-maleimide with the exposed cysteines on unfolded actin. Each actin has five cysteine residues. The chaperonin GroEL and unfolded Cy3-Actin are mixed together in TRiC buffer and incubated at room temperature for 30 minutes. The final concentrations of the components are: GroEL 1uM, Cy3-Actin 0.145uM. The 50uL mixture is then spun at 19,000 g for 10 minutes to pull down any unwanted aggregates of Actin. The supernatant is collected for trapping.
3.4 Control Study: Stoichiometry of Cy3-Actin
In the case of Cy3-Actin, the stoichiometry of the stock solution can be measured by standard bulk absorption assays based on extinction coefficients for the protein and the fluorescent label and compared to the stoichiometry calculated with our method. We found that the [Cy3]/[Actin] ratio determined by the absorption assay was about 1.79. Considering the excess amount of GroEL used in the measurement, the average number of Cy3 on each trapped GroEL/Cy3-Actin complex should also be about 1.79, that is, it would be unlikely for more than one actin molecule to bind to each GroEL.
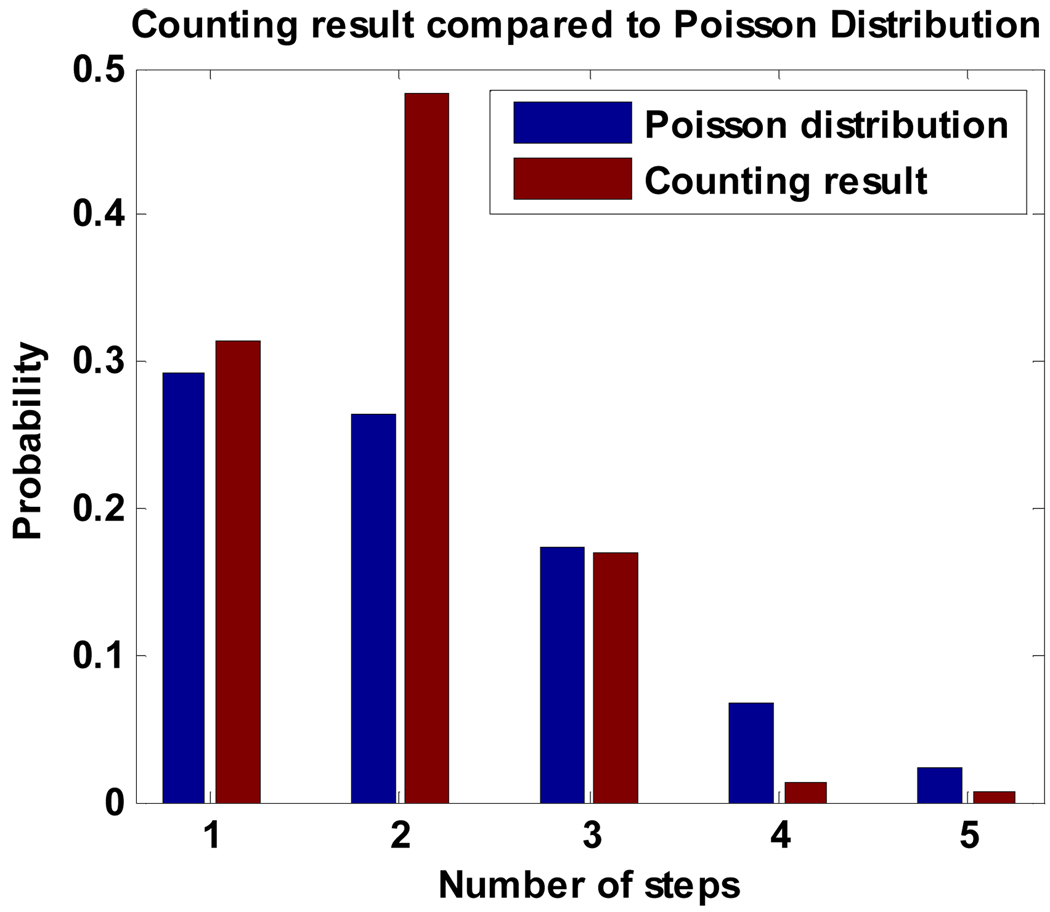
To perform the control test, the number of Cy3 fluorophores on each GroEL/Cy3-ATP complexes is obtained by the ABEL trap method described above. The distribution of the numbers of Cy3 on each trapped complex in a 300-second acquisition period is shown in Fig. 7 (red). The peak of the distribution is located at 2 and the average number of Cy3 on each complex is calculated to be 2.01.
Figure 7.
Distribution of the number of the photobleaching steps for the trapped GroEL/Cy3-Actin complexes compared to a Poisson distribution.
Assuming that actin’s cysteine residues have equal accessibility and affinity to Cy3-maleimide, the expected distribution of the labeling efficiency should obey the Poisson distribution. A theoretical Poisson distribution for the Cy3 stoichiometry is plotted in Fig. 7 (blue), assuming the average [Cy3]/[Actin] ratio is 1.79. The measurement shows the number of Actin labeled with two Cy3 is much higher than the theory predicts while the number of Actin with one Cy3 is consistent with the theory. This comparison suggests that two of the cysteine residues provide easier access for Cy3-maleimide compared to the other three cysteine residues, which is consistent with our observation that on average only 1.79 Cy3 are labeled on each Actin in spite of the five available cysteine sites in Actin and the excess amount of Cy3 used for labeling.
Overall, the result obtained by the ABEL trap method is in good agreement with the bulk assay, which provides a preliminary validation of this trapping and counting method.
3.5 The Binding Stoichiometry of TRiC/ATP
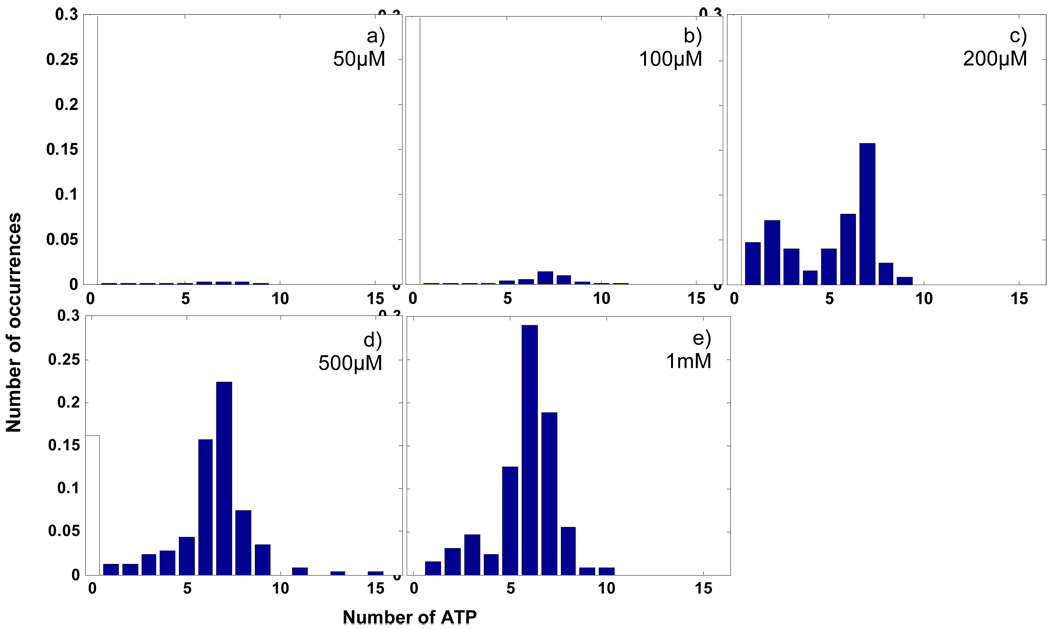
Figure 8 shows preliminary measurements of the distributions of ATP numbers on TRiC at different incubation concentrations of ATP. An interesting feature of these distributions is that the peak of the distribution is always around 7 or 8 even at ATP concentrations as low as 50µM. While the position of the peak does not change appreciably, the change in the probability for a TRiC molecule to bind 7 or 8 ATP molecules is of great interest. However, the ABEL trap does not measure objects with no fluorophores, thus the number of TRiC molecules with no ATP is not directly detected. On the other hand, the concentration of TRiC molecules in the final diluted sample is too low for bulk protein assay. Thus in order to make approximately calibrated plots for the various conditions, the concentration of TRiC was assumed to be the same in every final sample (before the final dilution). Under this assumption, the portion of TRiC molecules not detected by the ABEL trap method is considered to be TRiC with no ATP, shown as the white columns at 0 ATP in Fig. 8.
Figure 8.
Normalized distributions of the number of ATP on each chaperonin at incubation ATP concentrations. a) – e): [ATP] = 50uM, 100uM, 200uM, 500uM, 1mM; dilution factor for each sample = 25, 50, 1000, 500, 1000.
It is worth noting the number of TRiC molecules with one or two ATP may not be as precise as the number of TRiC with eight ATPs due to two main reasons. First, the trapping ability for objects dimmer than 40k counts/s is relatively low and is thus sensitive to the background level and other factors; second, the data analysis for low intensity events is also not as reliable as high intensity events as they are closer to the background.
Despite the possibility of missing events and some degree of imprecision in the number of TRiC with few numbers of ATP, these distributions are still characterized as roughly bimodal, which implies the existence of two stable configurations, TRiC with zero ATP or TRiC with eight ATP, compared to all of the other configurations. There are two interpretations for the eight-ATP configuration: a chaperonin with one ring almost fully occupied by 8 ATP-Cy3; or a chaperonin with two half-occupied rings.
At relatively low ATP concentration, the interpretation of the eight-ATP-bound TRiC as one fully occupied ring and one empty ring depicts an overall trend consistent with the cooperativity model supported by bulk biochemistry studies [28]. Even at 50µM ATP, a noticeable population of chaperonins have eight ATP bound, while the remaining enzymes are almost empty. As the concentration of ATP increases, the population of the one-ring-occupied chaperonins grows, whereas the rest of the population remains free of ATP. Meanwhile, we find a lack of a peak at 16 ATP, which corresponds to chaperonins with both rings fully occupied by ATP, even with an ATP concentrations as high as 1mM. This behavior suggests extremely strong cooperativity of ATP binding within and between the two rings: within each ring, the ATP binding sites exhibit positive cooperativity; thus, the almost-empty and almost-full configurations are most favorable; whereas between the two rings, the ATP-binding sites undergo negative cooperativity; consequently, the configuration of two full rings is rare.
However, the behavior of ATP binding shown by our single-molecule study is not completely consistent with the previous bulk study [28]. The bulk study shows that the negative inter-ring cooperativity can be overcome above 400µM ATP, whereas no additional ATP molecules bind to one TRiC even at 1mM in the single-molecule study. It is still possible that the eight ATP bound to one TRiC are actually four on each of the two rings, which means both rings of TRiC are binding ATP and closing the cavities even at 50µM ATP.
At the present time, both interpretations have difficulties in explaining the full ATP binding behavior. A future experiment with ADP instead of ATP would be very useful in determining which of these interpretations is correct, as TRiC is known to close only one of its rings with ADP bound.
4. CONCLUSION
The hardware-based ABEL trap is a powerful tool for studying multi-subunit enzymes on single-molecule level. The ATP counting method reported in this paper does not only extract useful information about the distributions normally buried by the ensemble averaging associate with bulk experiments, but it also eliminate surface-induced disturbances of the protein by observing them in free buffer. The photon-by-photon trapping algorithm used here has been analyzed, and the simulations suggest a possible improvement by using a Kalman filter in a lockin detection scheme.
ACKNOWLEDGEMENTS
The authors warmly thank Erik Miller and Randy Goldsmith for experimental assistance and useful discussions. This work was supported in part by National Institutes of Health Grant No. 1R21-RR023149 and by the NIH Roadmap for Medical Research Grant No. PN2-EY016525.
Footnotes
A higher fluorescence emission rate would improve the signal-to-noise ratio, but higher pumping intensity leads to shorter time-to-photobleaching, also limiting the trapping time.
The actual algorithm used in trapping a single GroEL in water is a slightly modified version of the photon-by-photon phase sensitive feedback scheme. Instead of applying the feedback voltage as soon as a photon is detected, the system adds up the vectors due to all the photons detected over one 25 microsecond cycle, and then applies that voltage throughout the next 25 microsecond cycle [14]. This modification helped remove the 40kHz noise induced by uneven illumination in the trapping region.
In the phase-sensitive feedback, every photon will produce a kick so the feedback bandwidth is not fixed. In Fig. 5c, the nominal photon count is set to be the same as the rotation rate. i.e. 40kHz, so the controller does, “on average” take action once every cycle.
REFERENCES
- 1.Cohen AE, Moerner WE. A Method for Trapping and Manipulating Nanoscale Objects in Solution. Appl. Phys. Lett. 2005;86:093–109. [Google Scholar]
- 2.Cohen AE, Moerner WE. Suppressing Brownian motion of individual biomolecules in solution. Proc.Natl. Acad. Sci. 2006;103:4362. doi: 10.1073/pnas.0509976103. [DOI] [PMC free article] [PubMed] [Google Scholar]
- 3.Cohen AE, Moerner WE. Controlling Brownian motion of single protein molecules and single fluorophores in aqueous buffer. Opt. Express. 2008;16:6941. doi: 10.1364/oe.16.006941. [DOI] [PMC free article] [PubMed] [Google Scholar]
- 4.Chaudhary S, Shapiro B. Arbitrary steering of multiple particles independently in an electro-osmotically driven microfluidic system. IEEE Transactions on Control Systems Technology. 2006;14:669. [Google Scholar]
- 5.Armani M, Chaudhary S, Probst R, Shapiro B. Using feedback control of microflows to independently steer multiple particles. JMEMS. 2006;15:945. [Google Scholar]
- 6.Enderlein J. Tracking of fluorescent molecules diffusing within membranes. Appl. Phys. B. 2000;71:773. [Google Scholar]
- 7.Berglund AJ, Mabuchi H. Feedback controller design for tracking a single fluorescent molecule. Appl.Phys. B. 2004;78:653. [Google Scholar]
- 8.Berglund AJ, Mabuchi H. Performance bounds on single-particle tracking by fluorescence modulation. Appl. Phys. B. 2006;83:127–133. [Google Scholar]
- 9.Berglund AJ, Mabuchi H. Tracking-FCS: Fluorescence correlation spectroscopy of individual particles. Opt. Express. 2005;13:8069. doi: 10.1364/opex.13.008069. [DOI] [PubMed] [Google Scholar]
- 10.Berglund AJ, McHale K, Mabuchi H. Fluctuations in closed-loop fluorescent particle tracking. Opt. Express. 2007;15:7752. doi: 10.1364/oe.15.007752. [DOI] [PubMed] [Google Scholar]
- 11.Montiel D, Cang H, Yang H. Quantitative characterization of changes in dynamical behavior for single-particle tracking studies. J. Phys. Chem. B. 2006;110:19763. doi: 10.1021/jp062024j. [DOI] [PubMed] [Google Scholar]
- 12.Cang H, Wong CM, Xu CS, Rizvi AH, Yang H. Confocal three dimensional tracking of a single nanoparticle with concurrent spectroscopic readouts. Appl. Phys. Lett. 2006;88:223901. [Google Scholar]
- 13.Xu CS, Cang H, Montiel D, Yang H. Rapid and quantitative sizing of nanoparticles using three-dimensional single-particle tracking. J. Phys. Chem. C. 2007;111:32. [Google Scholar]
- 14.Cohen AE. Ph.D. thesis. Stanford University; 2007. Trapping and manipulating single molecules in solution. [Google Scholar]
- 15.Berglund AJ. Ph.D. thesis. Caltech; 2007. Feedback Control of Brownian Motion for Single-Particle Fluorescence Spectroscopy. [Google Scholar]
- 16.Stengel RF. Optimal Control and Estimation. Dover. 1994 [Google Scholar]
- 17.Åström KJ, Murray RM. Princeton University Press; 2008. Feedback Systems: An Introduction for Scientists and Engineers. [Google Scholar]
- 18.Restelli A, Abbiati R, Geraci A. Digital field programmable gate array-based lock-in amplifier for high-performance photon counting applications. Rev. Sci. Instrum. 2005;76:093112. [Google Scholar]
- 19.Stockton J, Armen M, Mabuchi H. Programmable logic device in experimental quantum optics. J. Opt. Soc.Am. B. 2002;19:3019. [Google Scholar]
- 20.Park C, Nishimura G, Tamura M, Aoki K, Taguchi H, Yoshida M, Kinjo M. Analysis of Interaction Between Chaperonin GroEL and Its Substrate Using Fluorescence Correlation Spectroscopy. Cytometry. 1999;36:247–253. doi: 10.1002/(sici)1097-0320(19990701)36:3<247::aid-cyto15>3.3.co;2-r. [DOI] [PubMed] [Google Scholar]
- 21.Moerner WE. Single-Molecule Mountains Yield Nanoscale Cell images. Nature Methods. 2006;3:781–782. doi: 10.1038/nmeth1006-781. [DOI] [PMC free article] [PubMed] [Google Scholar]
- 22.Ulbrich MH, Isacoff EY. Subunit counting in membrane-bound proteins. Nature Methods. 2007;4:319. doi: 10.1038/NMETH1024. [DOI] [PMC free article] [PubMed] [Google Scholar]
- 23.Shu D, Zhang H, Jin J, Guo P. Counting of six pRNAs of phi29 DNA-packaging motor with customized single-molecule dual-view system. EMBO J. 2007;26:527. doi: 10.1038/sj.emboj.7601506. [DOI] [PMC free article] [PubMed] [Google Scholar]
- 24.Ditzel L, Löwe J, Stock D, Stetter K, Huber H, Huber R, Steinbacher S. Crystal structure of the thermosome, the archaeal chaperonin and homolog of CCT. Cell. 1998;93:125. doi: 10.1016/s0092-8674(00)81152-6. [DOI] [PubMed] [Google Scholar]
- 25.Horovitz A, Fridmann Y, Kafri G, Yifrach O. Review: Allostery in chaperonins. J. Struct. Biol. 2001;135:104. doi: 10.1006/jsbi.2001.4377. [DOI] [PubMed] [Google Scholar]
- 26.Watkins LP, Yang H. Detection of Intensity Change Points in Time-Resolved Single-Molecule Measurements. J. Phys. Chem. B. 2005;109:617. doi: 10.1021/jp0467548. [DOI] [PubMed] [Google Scholar]
- 27.Boudjellaba H, MacGibbon B, Sawyer P. On exact inference for change in a Poisson sequence. Commun. Statist. – Theory Meth. 2001;30(3):407. [Google Scholar]
- 28.Reissmann S, Parnot C, Booth CR, Chiu W, Frydman J. Essential function of the built-in lid in the allosteric regulation of eukaryotic and archaeal chaperonins. Nat. Struct. Mol. Biol. 2007;14:432. doi: 10.1038/nsmb1236. [DOI] [PMC free article] [PubMed] [Google Scholar]


