

Abstract
Backgrounds and Aims
Nitrogen nutrition of legumes, which relies both on atmospheric N2 and soil mineral N, remains a major limiting factor of growth. A decade ago, breeders tried to increase N uptake through hypernodulation. Despite their high nodule biomass, hypernodulating mutants were never shown to accumulate more nitrogen than wild types; they even generally displayed depressed shoot growth. The aim of this study was to dissect genetic variability associated with N nutrition in relation to C nutrition, using an ecophysiological framework and to propose an ideotype for N nutrition in pea.
Method
Five pea genotypes (Pisum sativum) characterized by contrasting root and nodule biomasses were grown in the field. Variability among genotypes in dry matter and N accumulation was analysed, considering both the structures involved in N acquisition in terms of root and nodule biomass and their efficiency, in terms of N accumulated through mineral N absorption or symbiotic N2 fixation per amount of root or nodule biomass, respectively.
Key Results
Nodule efficiency of hypernodulating mutants was negatively correlated to nodule biomass, presumably due to the high carbon costs induced by their excessive nodule formation. Root efficiency was only negatively correlated to root biomass before the beginning of the seed-filling stage, suggesting competition for carbon between root formation and functioning during the early stages of growth. This was no longer the case after the beginning of the seed-filling stage and nitrate absorption was then positively correlated to root biomass.
Conclusions
Due to the high C costs induced by nodule formation and its detrimental effect on shoot and root growth, selecting traits for the improvement of N acquisition by legumes must be engineered (a) considering inter-relationships between C and N metabolisms and (b) in terms of temporal complementarities between N2 fixation and nitrate absorption rather than through direct increase of nodule and/or root biomass.
Key words: Pisum sativum, nodules, roots, symbiotic N2 fixation, genetic variability, C and N nutrition
INTRODUCTION
Legumes have a major environmental role to play in cropping systems, principally as the occurrence of symbiotic fixation of atmospheric N means that savings can be made in inputs of fertilizer N (Jensen and Hauggaard-Nielsen, 2003) and also in weed and pest management in crop rotations (Munier-Jolain and Carrouée, 2003). Moreover, grain legumes constitute a major source of proteins for feeding animals. However, seed yields of pea are still unstable compared with cereals and pea protein yields are low compared with soybean. This was often attributed to sub-optimal N nutrition (Doré, 1992). Indeed, as symbiotic N2 fixation is highly sensitive to environmental stresses (Sprent et al., 1988), it usually decreases at the end of the growth cycle (Pate, 1985; Jensen, 1987). Moreover, the restricted root development of legumes (Hamblin and Tenant, 1987) may limit water and nutrient uptake, especially at late growth stages when environmental stresses are frequent.
Increasing N uptake by legumes is therefore a major challenge for breeders (Salon et al., 2001). However, whilst genetically based variation in N2 fixation traits has now been demonstrated, incorporating such variation into cultivars has had little success (Herridge and Rose, 2000). Creating hypernodulating mutants (Postma et al., 1988; Sagan and Duc, 1996) at first seemed a promising way for improving N uptake by symbiotic fixation. While they constituted a perfect means to dissect regulation pathways of symbiotic fixation (for review, see Oka-Kira and Kawagashi, 2006), the mutations studied finally turned out to be poor candidates for improving N uptake, at least in their genetic backgrounds. Indeed, hypernodulation was systematically associated with more or less depressed shoot and root growth. Maximally, hypernodulation has led to N uptake that was similar but never higher than the wild type (Bourion et al., 2007).
Selecting the most adequate traits for screening genetic variability associated with N nutrition of legumes thus appears as a problem of major importance to breeders but has so far received little attention. In the perspective of identifying genetic variability on processes that are physiologically independent, it would be of considerable help to identify intrinsic properties of crop functioning, especially concerning the inter-relationships between C and N metabolism. To achieve this goal and improve crop production, models depicting interactions between C and N assimilation at the whole-plant scale are of a great value (Lawlor, 2002).
An interesting range of genetic variability associated with root and nodule development was recently assessed in the field by Bourion et al. (2007). In particular, great differences among genotypes in nodule dry matter were associated with differences in seed N concentration. The aim of the present study was to propose an ecophysiological framework for analysing differences among this set of genotypes, considering C and N nutrition at the whole-plant level and across the whole growth cycle, in order to define an ideotype and criteria to breed for it. To do so, two characteristic periods of growth were distinguished as they differed in C and N assimilate partitioning rules within the plant: the first period, which ends at the beginning of the seed-filling (BSF) stage, is characterized by the settling of vegetative aerial and below-ground organs. Below-ground parts have priority for carbon over the shoot but this priority decreases as the reproductive organs progressively appear at the end of this period (Voisin et al., 2003a). Nitrogen that is taken up during this phase is mainly accumulated in the vegetative aerial parts of the crop. The second period, which spans from the BSF stage to physiological maturity, is characterized by the huge sink strength of the growing seeds for both carbon and nitrogen as they drain >80 % of assimilates (Sinclair and de Wit, 1976; Jeuffroy and Warembourg, 1991; Voisin et al., 2003a). Demand for N is higher than exogenous supply at that stage (Sinclair and de Witt, 1975). Thus, N that was accumulated in the vegetative aerial parts before the BSF stage is progressively remobilized towards the seeds until complete depletion that leads to auto-destruction of the plant (Pate and Flinn, 1973). Nodulated roots, which have no autonomy of C supply because of their low reserves, therefore undergo a cut off of energy supply after the BSF stage. As such, nodulated roots are set up and growth is restricted to the first period (before the BSF stage), as shown by Voisin et al. (2003b) and observed by Bourion et al. (2007) on the set of genotypes used in the present study.
In a first step, the analysis aimed at characterizing the different genotypes for their ability to take up nitrogen, considering both the structures involved (roots and nodules) and their efficiency. The relative contributions of symbiotic N2 fixation and root nitrate assimilation to N nutrition were also analysed, in relation to plant growth. The second step of the study was to highlight the ‘intrinsic’ relationships between C and N metabolisms at the whole plant level and during the two characteristic stages of growth. Eventually, the final aim was to define the best strategy for N uptake across the whole growth cycle.
MATERIALS AND METHODS
Site
The experiment was carried out in 2002 at Labruyère near Dijon (France) on a loamy sandy soil with a pH (in H2O) of 7·3. The soil P and K contents were not limiting for the crop as total P was 70 mg kg−1 (Olsen method ISO11263) and total exchangeable K was 150 mg kg−1 (Metson method, NFX 31-108). The Ca, Mg, Na, Cu and Zn contents were 475, 31·5, 2·9, 1·0 and 1·4 mg kg−1, respectively. At sowing, the soil contained around 2·85 mg kg−1 (=1 g m−2) of mineral N (NO3− and NH4+) and 6 g kg−1 of organic C in the ploughed layer (0–30 cm). No inoculation was needed as sufficient effective strains of Rhizobium leguminosarum were present in the soil. The field was irrigated in order to avoid moisture stress. Pests and diseases were well controlled by adequate pesticides used in conventional agricultural practices.
Plant material
The experiment comprised five field-pea genotypes (Pisum sativum L.) that were selected for their contrasting nodulation ability and/or root development in previous experiments (Duc et al., 2000). ‘Frisson’ is a leafy cultivar registered in 1979 in the French variety catalogue. P118 and P121 are mutant lines of ‘Frisson’, derived from ethyl methane sulfonate mutagenesis. They are both hypernodulating mutants but they differ on their genetic basis of hypernodulation. P118 is a sym29 mutant line, with aerial determinism of hypernodulation and P121 is a nod3 mutant for which the control of hypernodulation takes place in the roots (Postma et al., 1988; Sagan and Duc, 1996). Among the hypernodulating lines of ‘Frisson’, P118 and P121 mutants were selected because they were the lines for which shoot growth was the least depressed compared with ‘Frisson’. As there were no mutants for root development among the available mutants of ‘Frisson’, two pea cultivars (‘Athos’ and ‘Austin’) with a high root development in the field were selected. These lines were also selected because they have aerial development rates and flowering dates similar to ‘Frisson’. ‘Athos’ and ‘Austin’ are afila spring pea cultivars that were registered in France in 1996 and in 1998, respectively.
Experimental design
The five genotypes were sown in the field on 12 March 2002. The 15N isotope dilution technique with spring barley (Hordeum vulgare L.) as a reference crop (Duc et al., 1988) was used to estimate symbiotic N2 fixation. The use of a reference plant to estimate 15N enrichment of the soil mineral N pool implies some unavoidable errors due to different root growth and prospecting between the reference plant and the legume plant. The best reference plant may be an isogenic non-nodulating line (Biedermannova et al., 2002). As the non-nodulating mutant specific was not available for all the cultivars in the experiment, the spring barley ‘Scarlett’ which gave good estimations of symbiotic N2 fixation in previous field experiments was used (Voisin et al., 2002). For that purpose, barley was sown on the same date as pea and 0·1 g N m−2 of 15N-labelled ammonium nitrate (15NH415NO3; 1 % atom excess) was dissolved in water and sprayed at a rate of 300 L ha−1 on the whole experimental area (pea and barley) 1 week after sowing. The crops were sown in randomized split plot designs with crops as main plots and pea genotypes as sub-plots and with three replications. The plants were grown in micro-plots of six rows 7 m long and spaced 0·20 m apart. Plant density was 80 and 350 plants m−2 for pea and barley, respectively.
Sampling procedure and measurements
Pea plants were harvested at the 4th and 10th leaf stages (corresponding to the 6th and 12th node stages, respectively), at the beginning of flowering, at the beginning of the BSF stage and at physiological maturity. From the 4th leaf stage to the BSF stage, each harvest consisted of collecting the aerial part of all plants on 80 cm of the four central rows. Within the sampling area, two different root samples were taken by excavating two different soil blocks 40 cm deep, 25 cm long and 15 cm wide. The aerial parts of these plants (four to seven plants) were used for developmental observations. The roots were gently washed free of soil, which was facilitated by the sandy soil. At physiological maturity, roots and nodules of both soil blocks were weighed together. On the other sampling dates, nodules of one root sample were counted and separated from the roots for dry matter determination of both compartments. Total root length per plant and tap root length were measured on the other root sample using image analysis techniques (for more details, see Bourion et al., 2007). The aerial parts of barley were harvested at the BSF stage and at physiological maturity only. Dry matter of shoot, roots and nodules was determined after oven drying at 80 °C for 48 h. Nitrogen concentration of the shoot of pea was determined at each sampling date by the Kjeldahl procedure. The 15N enrichment of the shoots of pea and barley were determined at the BSF stage and at physiological maturity using a dual inlet mass spectrometer (Fison Isochrom, Micromass, Lyon France) operating in line with a CHN analyser (Caro Erba, Val de Reuil, France).
Calculations and statistical analysis
The percentage of N that was derived from fixation (%Ndfa) was calculated at the BSF stage and at physiological maturity using the isotope dilution principle (Mariotti et al., 1983; Duc et al., 1988), specifically:
where δ15NL legume and δ15NRP are the 15N enrichments of the shoots of the legume (pea) and the reference plant (barley), respectively, and εFix is the isotopic fractionation factor associated with N2 fixation processes (Mariotti et al., 1980, 1983). Due to the high variability among the five genotypes studied for their nodulation ability and according to previous studies (Mariotti et al., 1980; Ledgard, 1989; Unkovich et al., 1994) the value of εFix was suspected to depend both upon the pea genotype and the stage of development. Therefore in the present calculations, a specific value was used for each genotype and each growth stage. It was evaluated by growing all genotypes without mineral N in a specific greenhouse experiment and by measuring their 15N enrichment at the BSF stage and at physiological maturity.
To take into account the different behaviours of the genotypes throughout the whole growth cycle, weighted mean values (WV) of several shoot and below-ground variables (V) were calculated by weighting its variations by the duration of each time interval (ta to tb) using the following equation:
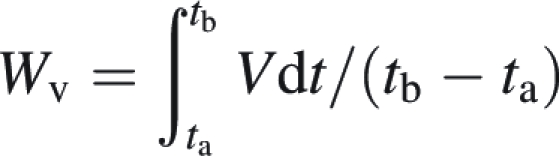 |
with ∫tatb Vdt = ∑i=ab (Vi + Vi+1) × (ti+1 − ti)/2 (trapezoid sum approximation).
Bourion et al. (2007) described the time course of nodulated root dry matter from the 4th leaf stage until physiological maturity. Other below-ground variables (nodule dry matter, root dry matter, total root length, tap root length) were only described until the BSF stage as they were difficult to measure at physiological maturity due to important decay at this late stage of growth. For each genotype, therefore, a so called ‘decay-coefficient’ (d) was calculated using both nodulated root dry matter measured at physiological maturity (MPM) and that measured at the BSF stage (MBSF) as follows: d = 1 – (MPM/MBSF)
The ‘decay-coefficient’ of below-ground organs was 0·43, 0·46, 0·26, 0·56 and 0·34 for ‘Athos’, ‘Austin’, ‘Frisson’, P118 and P121, respectively. To evaluate other root and nodule variables at physiological maturity, this ‘decay-coefficient’ and values obtained at the BSF stage were combined, assuming that decay affected all below-ground variables to the same extent.
Analysis of variance was performed using XLSTAT software (Version 7·5·2; http://www.xlstat.com). Means were compared using the least significant difference test (LSD) at the 0·05 probability level. Genetic correlations were calculated using the Pearson coefficient at the 0·05 probability level.
RESULTS
The patterns of dry matter and N accumulations by the different genotypes across the growth cycle were evaluated considering shoot measurements. The analysis was divided into two major phases. The first one spanned from the beginning of the growth cycle until the BSF stage. The second one started at the BSF stage and ended at physiological maturity.
Patterns of dry matter accumulation across the growth cycle
Total shoot dry matter accumulated across the whole growth cycle was highest for ‘Athos’ (1194 g m−2), being 54 % higher than P118, 43 % higher than ‘Frisson’ and P121 and only (but not significantly) 14 % higher than ‘Austin’ (Table 1). Before the BSF stage, the amount of dry matter accumulated was the highest for ‘Athos’, being 42 % higher than P118, 25 % higher than P121 and ‘Frisson’, and only (and not significantly) 12 % higher than ‘Austin’. Again, after the BSF stage, ‘Athos’ was the genotype with the highest dry matter accumulation, which was 2·4 times higher than that of ‘Frisson’, with P118, P121 and ‘Austin’ having intermediate values.
Table 1.
Characterization of dry matter and N/dry matter accumulation in the shoot of the five pea genotypes studied
| Dry matter accumulated in the shoot (g m−2) |
N/dry matter (g g 1) |
||||
|---|---|---|---|---|---|
| Whole cycle | Before the BSF stage | After the BSF stage | Before the BSF stage | After the BSF stage | |
| ‘Athos’ | 1194a | 784a | 410a | 0·024b | 0·031ab |
| ‘Austin’ | 1051ab | 698ab | 353ab | 0·025b | 0·027b |
| ‘Frisson’ | 814bc | 646bc | 168b | 0·026b | 0·043a |
| P118 | 774c | 552c | 222ab | 0·034a | 0·025b |
| P121 | 861bc | 613bc | 249ab | 0·026b | 0·031ab |
Results of LSD range test are shown. Means followed by similar superscript letters are not significantly different at the 5 % probability level.
Relationship between dry matter and N accumulations
To relate C and N metabolism, the ratio between N uptake and dry matter accumulation was calculated before the BSF stage and after the BSF stage (in g N g DM−1; Table. 1). During the period preceding the BSF stage, this ratio was higher for P118 (0·034 g N g DM−1) compared with the other genotypes for which it averaged 0·025 g N g DM−1. During the period consecutive to the BSF stage, the ratio was similar for ‘Athos’, ‘Austin’, P118 and P121 (0·029 g N g DM−1) while that of ‘Frisson’ was significantly higher (0·043 g N g DM−1).
For all genotypes, N concentration in the shoot declined as shoot dry matter increased across the growth cycle (Fig. 1), in accordance with many studies (Ulrich, 1952; Greenwood et al., 1991). In order to assess whether N uptake allowed N requirements to be sustained by the crops, the principle of the critical N dilution curve, which determines the optimal N nutrition level was used (for a review, see Gastal and Lemaire, 2002). It represents the lowest N concentration for maximal dry matter N accumulation, as defined in pea by Ney et al. (1997). Comparative positioning of the experimental points relative to the critical dilution curve was carried out only from the 10th leaf stage and until the BSF stage, as diagnosis was not valid for dry matter values lower than 100 g m−2 and for growth stages consecutive to the BSF stage. During the so-defined period, it can be concluded that for all the genotypes there was never any N stress, as experimental points were positioned close to the critical N dilution curve (Fig. 1). Nevertheless, shoot N concentration of P118 at the beginning of flowering and at the BSF stage was higher than the calculated optimal N concentration. At the 4th leaf stage, even if no diagnosis could be done, shoot N concentrations of P118 and ‘Frisson’ were interestingly significantly lower (−30 %) than that of ‘Athos’, ‘Austin’ and P121.
Fig. 1.

Diagnosis of the N status of the five genotypes using the N dilution principle. Nitrogen concentration in the shoot (N%) in relation to shoot dry matter (Md). Each point is the mean value of three replicates. 4L, 10L, BF and BSF indicate the developmental stage and stand for the four-leaf stage, the ten-leaf stage, beginning of flowering and beginning of seed filling, respectively. The line is the critical nitrogen dilution curve: N% = 5·08. Md−0·32 (Ney et al., 1997).
Patterns of N uptake across the growth cycle
Total N uptake across the whole growth cycle was highest in ‘Athos’ when compared with ‘Frisson’, P118 and P121 (+33 %), with ‘Austin’ having intermediate values (Table 2). Before the BSF stage, ‘Athos’ and P118 were the genotypes with the highest N accumulation, which was not significantly different from ‘Austin’ and ‘Frisson’, but 18 % higher than P121. After the BSF stage, N accumulation markedly differed among genotypes. ‘Athos’ was the genotype with the highest N accumulation, being twice that of ‘Frisson’ and P118, with ‘Austin’ and P121 having intermediate values.
Table 2.
Characterization of nitrogen accumulation in the shoot of the five pea genotypes studied
| N accumulated in the shoot (g m−2) |
N accumulated in the shoot in the early stages of growth |
N accumulated in the shoot before the BSF stage (g m−2) |
N accumulated in the shoot after the BSF stage (g m−2) |
||||||||
|---|---|---|---|---|---|---|---|---|---|---|---|
| Whole cycle | Before the BSF stage | After the BSF stage | Seed N (g m−2) | %N from seed at the 4th leaf stage | %Ndfa | From N2 | From NO3− | %Ndfa | From N2 | From NO3− | |
| ‘Athos’ | 31·9a | 19·0a | 12·9a | 0·84a | 100a | 87ab | 16·5a | 2·5ab | 70b | 9·0a | 3·8a |
| ‘Austin’ | 27·0ab | 17·4ab | 9·6ab | 0·72b | 84b | 87ab | 15·1ab | 2·3ab | 75b | 7·3ab | 2·3b |
| ‘Frisson’ | 23·1b | 16·5ab | 6·6b | 0·42c | 82b | 89a | 14·6ab | 1·9b | 96a | 6·4ab | 0·3c |
| P118 | 23·7b | 18·5ab | 5·1b | 0·37d | 79bc | 88a | 16·3a | 2·2ab | 66b | 3·4a | 1·7b |
| P121 | 23·6b | 16·1b | 7·5ab | 0·40c | 59c | 81b | 13·1b | 3·0a | 62b | 4·7b | 2·9ab |
Results of LSD range test are shown. Means followed by similar superscript letters are not significantly different at the 5 % probability level.
For each characteristic period of the growth cycle (before and after the BSF stage), the source of nitrogen (symbiotic N2 fixation or root nitrate assimilation) taken up by the plant was identified. Additionally, a first period corresponding to early vegetative stages when the seedling still relies on seed reserves for its growth was considered (Table 2). To evaluate to what extent seed N reserves participated in early plant growth, the amount of seed N reserves was calculated using the N content and the thousand-seed weight of a representative sample of the seeds that was sown in the field experiment. Seed N reserves were highest in ‘Athos’ (0·84 g N m−2; Table 2), being 1·2 times higher than that of ‘Austin’ and twice that of ‘Frisson’, P118 and P121. At the 4th leaf stage, seed reserves accounted for 100 % of N accumulated by ‘Athos’, around 82 % of that accumulated by ‘Austin’, ‘Frisson’ and P118, while it only corresponded to 59 % of N accumulated by P121.
During the period preceding the BSF stage, the percentage of N arising from symbiotic N2 fixation was similar for ‘Athos’, ‘Austin’, ‘Frisson’ and P118 (around 88 %) while that of P121 was lower (81 %). The amount of N2 fixed through symbiosis varied among genotypes from 13·1 to 16·5 g m−2 (Table 2). It was highest for ‘Athos’ and P118, lowest for P121 and intermediate for ‘Austin’ and ‘Frisson’. Relative differences among genotypes were more severe for N accumulation through nitrate assimilation, as it varied between 1·9 and 3·0 g m−2 (Table 2). P121 accumulated the highest amount of mineral N, ‘Frisson’ the lowest amount and ‘Athos’, ‘Austin’ and P118 had intermediate values.
During the period starting at the BSF stage and ending at physiological maturity, the percentage of N originating from N2 fixation had declined for all genotypes down to around 68 % on average, except for ‘Frisson’ for which it had increased up to 96 %. For all genotypes, the amount of N2 fixed was lower than during the first period (before the BSF stage), being highest for ‘Athos’ (9·0 g m−2; Table 2) and lowest for P118 (3·4 g m−2). Conversely, the amount of mineral N retrieved by the roots was similar to that before the BSF stage for ‘Austin’, P118 and P121 (around 2·3 g m−2) while it had increased up to 3·8 g m−2 for ‘Athos’ and decreased down to 0·3 g m−2 for ‘Frisson’.
From the perspective of comparing the ability of the genotype to take up N, the dry matter of their nodules and roots and their activity for N uptake were characterized separately.
Characterization of the nodulated roots of the five genotypes studied
In order to characterize the nodulated roots of the set of genotypes, the weighted mean of their root dry matter was plotted against the weighted mean of their nodule dry matter throughout the whole growth cycle (Fig. 2). ‘Frisson’, P121 and P118 had similar root dry matter values which were the lowest of the genotypes studied. However, their nodule dry matter markedly differed, with that of P121 and P118 being, respectively, 1·6 and 3·3 times higher than that of ‘Frisson’. Conversely, nodule dry matter of ‘Austin’, ‘Athos’ and ‘Frisson’ were not significantly different while root dry matter values of ‘Athos’ and ‘Austin’ were increased, respectively, by 31 % and 68 % compared with ‘Frisson’. As a consequence, ‘Frisson’ was the genotype with both low root and nodule dry matter. ‘Frisson’ also stood out from other genotypes in the kinetics of the establishment of its nodulated roots as its roots reached maximal dry matter earlier than others while its nodule dry matter was maintained later (Bourion et al., 2007). Nevertheless, its below-ground parts experienced a lower decay at the end of the growth cycle, as shown by its significantly lower ‘decay coefficient’ (see Materials and methods).
Fig. 2.

Root dry matter as a function of nodule dry matter for the five genotypes. Values are weighted means over the whole growth cycle. Each point is the mean value of three replicates. Horizontal and vertical bars represent s.d.
Root and nodule efficiency for N uptake
The efficiency for N uptake (ε) was evaluated through calculation of specific activity of nodules (εnodule) and roots (εroot). It was calculated as the ratio between N2 (resp. NO3−) uptake rate (dN/dt) per unit of nodule (resp. root) dry matter (Md) as follows:
 |
In the present experiment, the measurement of the percentage of symbiotic fixation was performed at the BSF stage and at physiological maturity. The long time step between these measurements did not allow calculating instantaneous rates of N2 or NO3− uptake (dN/dt). However, the results allowed accumulated amounts of N2 or NO3− taken up during two distinct periods – before and after the BSF stage – to be calculated. Therefore the integration of the preceding equation with time between ta and tb was used:
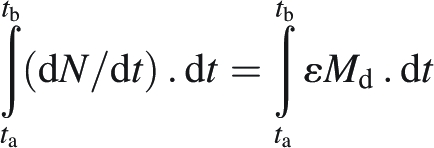 |
If the efficiency for N uptake ε is a constant parameter, it comes as
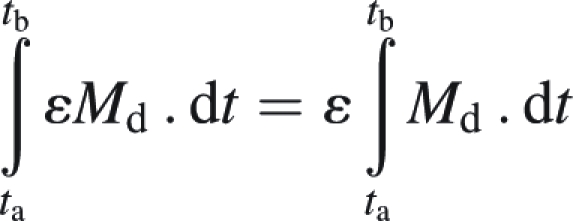 |
Then ε = (Nb − Na)/(∫tatb Md . dt) with ∫tatb Md . dt calculated as explained in Materials and methods.
Indeed, it was shown that N2 fixation rate at a given time was linearly related to nodule dry matter present at that time (Voisin et al., 2003c). However, the slope of the linear relationship (corresponding to εnodule) varied with the growth stage and three different values were found (a) for the vegetative stage (until flowering), (b) for the flowering stage (from beginning of flowering to the BSF stage) and (c) for the seed-filling stage (after the BSF stage). Therefore, even if εnodule was shown to be constant after the BSF stage, it varied during the period preceding the BSF stage. The same problem stands for the estimation of the efficiency of mineral N uptake by the roots εroot. Even if nitrate uptake by the roots of pea does depend upon root dry matter, it is also likely to depend upon the growth stage, as shown for other species (Malagoli et al., 2004), due to changes in assimilate partitioning between aerial and below-ground parts correlative to the appearance of strong reproductive sinks (Voisin et al., 2003a) and to decreased efficiency with root age. Moreover, nitrate uptake by the roots not only depends on root dry matter and on root efficiency but also on nitrate availability. Therefore, εroot may additionally vary with environmental conditions. For all those reasons, the present calculations of εnodule and εroot cannot be considered as quantitative measurement of N uptake efficiency of the nodules and roots but only as averaged indicators on a given period and in a given environment. Consequently, as they were only used to compare genotypes within each period, values of εnodule and εroot were normalized by the value found for ‘Athos’ for each period (Fig. 3).
Fig. 3.
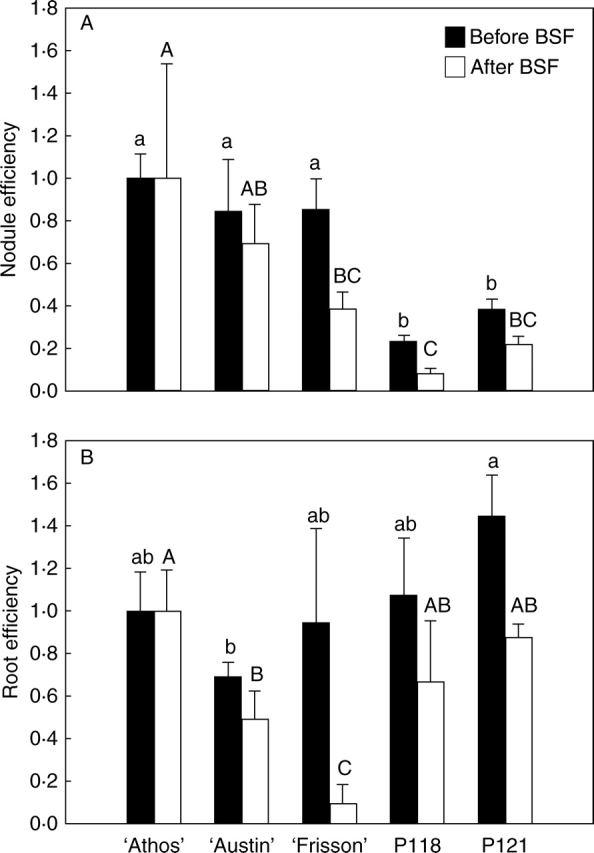
Nodule and root efficiencies for N uptake. Nodule (A) and root (B) efficiencies before and after the beginning of the seed-filling stage (BSF). Nodule (respectively root) efficiency was calculated as the ratio between N2 (respectively NO3−) uptake rate per unit of nodule (respectively root) dry matter, as explained in Results. Values are unit-less as they were normalized to that of ‘Athos’. Each point is the mean value of three replicates. Vertical bars represent s.d. For each period studied, values were normalized to that of ‘Athos’ and a different statistical analysis was performed before and after the BSF stage. Means were compared using the LSD test at the 0·05 probability level. Values followed by the same letter are not significantly different: a, b = before BSF, A, B, C = after BSF.
Before the BSF stage, nodule efficiency for symbiotic fixation εnodule was highest for ‘Athos’, ‘Austin’ and ‘Frisson’, being on average 3 times higher than that of P118 and P121 (Fig. 3A). After the BSF stage, εnodule was highest for ‘Athos’ and 11 times lower for P118 (Fig. 3C). ‘Austin’, ‘Frisson’ and P121 had intermediate values. Concerning root efficiency for mineral N uptake (Fig. 3B), P121 had the highest value measured before the BSF stage, which was 1·6 times higher than that of ‘Austin’. εroot values of ‘Athos’, ‘Frisson’ and P118 were similar and intermediate. After the BSF stage, differences between genotypes were more pronounced (Fig. 3D). εroot was the lowest for ‘Frisson’. It differed from ‘Athos’ by a factor of 11 and from ‘Austin’ by a factor of 6. εroot values of P118 and P121 were intermediate between ‘Athos’ and ‘Austin’.
Root and nodule efficiencies for N uptake of the set of genotypes used were then related to the corresponding weighted mean of their root or nodule dry matter, respectively (Fig. 4). Nodule efficiency exponentially decreased with increasing nodule dry matter both before and after the BSF stage (Fig. 4A, B, respectively). Before the BSF stage, root efficiency decreased linearly with root dry matter (Fig. 4C). However, P121 and ‘Frisson’ stood out from this relationship as their root efficiency was higher and lower, respectively, than the value predicted by the linear relationship (Fig. 4C). In contrast, there was no relationship between εroot and root dry matter after the BSF stage (Fig. 4D).
Fig. 4.

Efficiencies of nodules (A, C) and roots (B, D) for N uptake in relation to their dry matter before (A, B, respectively) and after (C, D, respectively) the BSF stage for the five genotypes. BSF, Beginning of seed filling stage. Root and nodule dry matter values correspond to weighted means over the growth cycle. Nodule (respectively root) efficiency was calculated as the ratio between N2 (respectively NO3−) uptake rate per unit of nodule (respectively root) dry matter, as explained in Results. Efficiency values are unit-less as they were normalized to that of ‘Athos’.
DISCUSSION
The present results interestingly show that the amount of N taken up by the plant did not directly depend upon the size of the below-ground organs responsible for the underlying function. As such, the hypernodulating mutants did not fix more N than others genotypes (Table 2) despite the fact they had two to four times more nodule dry matter (Fig. 2). Similarly, the genotypes with the highest root dry matter (‘Athos’ and ‘Austin’) did not systematically retrieve the highest amounts of nitrate. Conversely, differences in dry matter accumulation seemed to be related to nodule dry matter, as genotypes with the highest nodule dry matter accumulated the lowest dry matter in the shoot, especially before the BSF stage (Table 2). Therefore, a conceptual framework (Fig. 5) was used to highlight the different abilities of the genotypes for N nutrition, taking into account its interactions with carbon metabolism at the whole plant level. Genetic correlations with the variables that were linked in that scheme were calculated in Table 3. The following genetic correlations were used. It was considered that a strong genetic correlation indicated a direct intrinsic property between variables. When the correlation was weaker, genetic variability of one variable independently from the other was suspected. When the correlation was loose, the interpretation was that there was no direct physiological link between variables in the environment studied.
Fig. 5.

A conceptual ecophysiological framework for the analysis of nitrogen nutrition in legumes. Potential N supply is the sum of utilization of seed N reserves and N uptake by symbiotic N2 fixation and root nitrate absorption. The amount of N2 fixed is the product of nodule dry matter by their efficiency while the amount of nitrate accumulated is the product of root dry matter by their efficiency, which depends on nitrate availability in the soil and on the ability of the plant to retrieve it (as partly determined by rooting depth). N demand is mainly determined by variation in shoot dry matter. The N concentration of the shoot results from the balance between N supply and N demand. The N status can be diagnosed using the N dilution principle. In turn, it modulates photosynthetic ability of the plant. Part of the C assimilates is allocated to roots and nodules, thus allowing potential N supply to be modulated by varying their dry matter and/or their efficiency. N compounds circulating in the phloem are presumably involved in the signalling processes leading to whole plant N feedback regulation of N uptake. Using genetic correlations, it was shown that C costs induced by nodule synthesis are detrimental to their functioning and also to shoot and root growth. Carbon costs induced by root synthesis are presumably detrimental to their functioning at the beginning of the growth cycle only.
Table 3.
Genetic correlations between growth variables
| Correlation between | Shoot N and |
Shoot N from N2 and |
Shoot N from NO3− and |
Nodule dry matter and |
|||||
|---|---|---|---|---|---|---|---|---|---|
| shoot dry matter | shoot N from N2 | shoot N from NO3− | nodule dry matter† | root dry matter† | root length† | tap root length† | shoot dry matter† | root dry matter† | |
| Before BSF stage | 0·47 n.s. | 0·96* | −0·20 n.s. | 0·22 n.s. | −0·03 n.s. | −0·42 n.s. | 0·73 n.s. | −0·68 n.s. | −0·47 n.s. |
| After BSF stage | 0·99* | 0·91* | 0·74 n.s. | −0·89* | 0·61 n.s. | 0·10 n.s. | 0·71 n.s. | −0·80 n.s. | −0·65 n.s. |
*Significant at the 0·05 level; n.s., non-significant.
†As mean-weighed values throughout the defined period (before or after the BSF stage).
Characterization of the three different sources for N supply in legumes
As depicted in Fig. 5, N supply to leguminous crops can originate from three different sources: N2 fixation by nodules, nitrate absorption by the roots and seed N reserves.
Although nodulated root dry matter accounted for a similar proportion of total dry matter for all genotypes (around 6 %), root and nodule dry matters were highly variable among genotypes (Fig. 2). Especially, the proportion of nodule dry matter relative to total nodulated root dry matter made it possible to classify genotypes in three groups, with (1) that of ‘Athos’ and ‘Austin’ being around 7 %, (2) that of ‘Frisson’ and P121 around 15 % and (3) that of P118 equal to 31 %. Several studies have shown that nodule growth partly occurs at the expense of roots (Schulze et al., 1994, 1999; Hacin et al., 1997; Voisin et al., 2003b). This is in accordance with observations that no genotype displayed both large root and nodule dry matter together. In the set of genotypes used, there was a negative correlation between root and nodule dry matter (Table 3) but it was not very tight as ‘Frisson’ displayed both low root and nodule dry matter. This may be explained by discrepancies in the kinetics of root and nodule establishment as root dry matter of ‘Frisson’ reached a plateau as soon as the 10th leaf stage while for other genotypes it went on increasing until the BSF stage (Bourion et al., 2007).
Potential N supply not only depends upon the number of structures involved but also upon its efficiency to take up N (or specific activity). As such, root and nodule efficiency were calculated for N uptake. Even if the calculations were not precise enough to really quantify those variables (see Results), they still allowed comparison between genotypes.
Nodule efficiency for N2 uptake was highly variable among genotypes (Fig. 3). It was negatively related to nodule dry matter both before and after the BSF stage, according to exponential-like relationships (Fig. 4A and B). Before the BSF stage, this supports the hypothesis that the high C costs induced by nodule synthesis may occur at the expense of their activity (Voisin et al., 2003c). After the BSF stage, specific activity of nodules was presumably impaired by nodule maintenance (or turn-over), as synthesis processes were excluded at this late stage of growth, in accordance with Voisin et al. (2003c). This was reinforced by the fact that there was even a strong negative correlation (–0·83) between the amount of N2 fixed and nodule dry matter after the BSF stage (Table 3). Furthermore, the fact that nodule efficiencies of P118 and P121 were in a similar range while nodule dry matter of P118 was twice that of P121 raised two kinds of hypotheses. The first one is that the high C costs induced by nodule synthesis before the BSF stage were additionally detrimental to shoot growth in P118, as shown by the lower shoot dry matter accumulation in P118 than in P121 before the BSF stage (Table 1), and in accordance with other observations of depressed shoot growth of hypernodulating mutants sym29 in pea (Sagan and Duc, 1996; Salon et al., 2001) or its orthologue in soybean (Wu and Harper, 1991). This is also consistent with the higher priority of below-ground organs for C over the shoots until the BSF stage (Voisin et al., 2003a). After the BSF stage, dry matter accumulation in the shoot of P118 and P121 was similar, in accordance with preferential allocation of C towards the filling seeds at this late stage of growth (Jeuffroy and Warembourg, 1991). Our hypothesis is that the high C costs of nodule activity and/or maintenance were directly detrimental to nodule dry matter itself in P118. Indeed, the below-ground ‘decay coefficient’ during seed filling (see Materials and methods) was 1·6 times higher for P118 than for P121. The second hypothesis involves the symbiotic partner as Bourion et al. (2007) showed that P118 has modified the selection of rhizobial partner in comparison with the isogenic parent line ‘Frisson’ and with P121. However, the efficiency of rhizobial strains differentially selected remains to be tested.
As for nodule efficiency, the present calculations of root efficiency for nitrate uptake can be used as indicators to compare genotypes (Fig. 4). Unlike nodule efficiency, root efficiency also depends upon nitrate availability as this N resource in not unlimited as is the case for N2. Therefore, differences in root efficiencies may arise either from different ‘intrinsic’ efficiencies but also from different nitrate availabilities, which may have resulted in the present situation from differential soil prospection by the root of the genotypes. At the BSF stage, maximal rooting depth was similar for all genotypes, as their tap root had reached 25–30 cm (Bourion et al., 2007). However, two groups of genotypes could be distinguished according to their kinetics of tap root elongation. ‘Athos’, P118 and P121 had reached this depth as soon as the 10th leaf stage whereas rooting depth had increased more progressively until the BSF stage for ‘Austin’ and ‘Frisson’, resulting in presumably globally lower nitrate availability across time for this second group of genotypes. Nevertheless, root efficiency was globally negatively linearly related to root dry matter before the BSF stage (Fig. 4C). As for nodules, it can be hypothesized that this reflects the fact that the C costs induced by root synthesis came to limit their functioning. Despite the fact that ‘Austin’ belongs to the group of genotypes having low nitrate availability, the hypothesis of competition for C between synthesis and N uptake processes cannot be discarded. Indeed, ‘Athos’, ‘Austin’ and P118 accumulated similar amounts of mineral N before the BSF stage, reinforcing the hypothesis that high (resp. low) root dry matter was counterbalanced by low (resp. high) root efficiency. Therefore, nitrate availability was presumably not a strong limiting factor for ‘Austin’. Interestingly, two genotypes stood out from the linear relationship (Fig. 4C), suggesting that potentially there is additional genetic variability in root efficiency independent of root dry matter. Root efficiency of P121 may thus be higher than other genotypes and that of ‘Frisson’ may be lower, even if the lower efficiency of ‘Frisson’ could also be attributed to lower nitrate availability. After the BSF stage, root efficiency was no longer related to the dry matter of the roots (Fig. 4D), suggesting that C costs associated with root maintenance were not detrimental to their functioning, presumably because they were sufficiently low and/or because of more or less rapid senescence of the roots. Therefore, mineral N uptake at this late stage was mainly linked to root dry matter and nitrate availability. ‘Frisson’, for which nitrate assimilation during the BSF stage was almost nil was probably limited by root prospecting that was not deeper than 30 cm at physiological maturity (vs. 35–40 cm for the other genotypes) but also by decreased ‘intrinsic’ root efficiency, presumably caused by early root decay in the growth cycle. ‘Athos’ and P121 were the genotypes that accumulated the highest amounts of mineral N during the BSF stage (Table 2), which may be in relation to their thinner and more ramified roots compared with those of ‘Austin’ and P118 (cf. Bourion et al., 2007).
In the early stages of growth, seed N reserves additionally constitute a major source of N allowing transition between heterotrophy and autotrophy, as they represent 60–100 % of shoot N at the 4th leaf stage (Table 2). Therefore, differences in seed N reserves among genotypes greatly accounted for differences in N nutrition at the 4th leaf stage. Indeed, P118 and ‘Frisson’, with seed N reserves being half that of ‘Athos’ and ‘Austin’, had a significantly lower shoot N concentration but similar shoot dry matter at this early stage of growth (Fig. 1). However, P121 with seed N reserves similar to that of P118 and ‘Frisson’ exhibited a shoot N concentration that was similar to that of ‘Athos’ and ‘Austin’. This could be explained by the fact that, in contrast to other genotypes, seed N only contributed to 60 % of shoot N (vs. >80 % for the others). Therefore, the presumably higher root efficiency of P121 evidenced herein most probably compensated for its low seed N reserves.
Regulation of N uptake is closely linked to C metabolism
The present results interestingly show that N uptake is closely related to plant growth, as illustrated before the BSF stage by diagnosis made using the critical N dilution curve (Fig. 1) and after the BSF stage by the strong correlation between shoot N and dry matter accumulations (Table 1). Indeed, it was shown previously that N uptake is controlled by plant growth, which represents potential demand for N (Lemaire et al., 1997). In the absence of biotic or abiotic stress, strong N deficiency is rarely observed in pea under low nitrate availability, due to the occurrence of symbiotic fixation. Still, when potential N supply is slightly lower than N demand, shoot growth probably diminishes (as photosynthesis depends upon foliar N; Sinclair and Horie, 1989), thereby inducing an increase in the proportion of C allocated to nodulated roots, as demonstrated by Voisin et al. (2003a). This higher C availability for both root and nodule growth and/or their activity in turn presumably results in improved potential N supply, as illustrated in Fig. 5.
Before the BSF stage, P118 was positioned above the critical N dilution curve (Fig. 2), as shown by its high shoot N concentration compared with other genotypes. This is commonly interpreted as excess N uptake relative to plant growth (Ney et al., 1997). However, such situations are usually observed in situations of high nitrate availability (Voisin et al., 2002; Vocanson et al., 2005), which was not the case in the present study. As such, the high shoot N concentration of P118 was interpreted as the consequence of depressed shoot growth (due to competition with high nodule growth) rather than excess N uptake. Similarly, the high N : dry matter accumulation ratio of ‘Frisson’ after the BSF stage (Table 1) was probably a consequence of the high C costs induced by symbiotic fixation, as ‘Frisson’ was the only genotype exclusively relying on symbiotic fixation after the BSF stage and as it had the lowest shoot growth during this period (Tables 1 and 2).
As such, C and N uptake are closely linked metabolisms and it seems difficult to identify the most limiting factor for N nutrition. Before the BSF stage, differences among genotypes in nitrate assimilation and symbiotic N2 fixation were not linked to differences in root and nodule dry matter but appear to be linked to plant growth. During this first period of growth, which is characterized by high growth rates associated with settlement of vegetative organs, it seems that C uptake is more likely to be limiting than N uptake, especially because of the competition for C between shoots and nodulated roots and because of the high C costs induced by synthesis processes. Potential N supply can sustain increasing N demand as long as C allocation to the nodulated roots is sufficiently high to allow adjustments. This is no longer the case after the BSF stage as C is mainly directed to the seeds. Therefore, N uptake during this phase mainly depends on the structure being set before (Salon et al., 2001). Thus, after the BSF stage, the more the N uptake was lowered the more the nodule dry matter increased (Table 3), presumably because of over-consumption of C associated with symbiotic fixation. Conversely, the more nitrate assimilation increased the higher the root dry matter and nitrate availability (Table 3).
In the present study and in others (Schubert, 1995; Ney et al., 1997), it was hypothesized that N uptake of legumes is ruled out by N demand as determined by plant growth rate. Even if N fixation requires a large quantity of assimilates, C availability may not be the final regulator of nitrogen fixation rates. Several hypotheses concerning the regulation of nitrogen fixation were raised (for a review, see Schulze, 2004). Among them, it was suggested that the ability of nodules to use assimilates, and especially to convert them into malate, may be the effective regulator (Vance and Heichel, 1991). Another hypothesis is that nitrogenase activity would be tightly regulated by the regulation of oxygen diffusion into the nodules (Layzell et al., 1990). Finally, it was shown that modulation of N uptake involves a whole plant N-feedback control exerted by the shoot on the roots through N fluxes (Parsons et al., 1993; Fischinger et al., 2006) or ‘signal’ molecules as specific amino acids (Neo and Layzell, 1997) or hormones circulating in the phloem. This regulation could not depend on the N source (Lemaire et al., 1997), in accordance with the hypothesis concerning both the regulation of both symbiotic fixation (Soussana and Hartwig, 1996) and that of root mineral N absorption (Muller and Touraine, 1992). In the same way, a systemic feedback regulation (Catano-Anollès and Gresshof, 1990, 1991), termed ‘auto regulation of nodulation’, has been mentioned to account for the reduction in nodulation success following the appearance of new nodules (Kosslak and Bolhool, 1984) by reducing both the nodule density and the size of the nodulation zone (for a review, see Oka-Kira and Kawagachi, 2006). P121 and P118 are both hypernodulating mutants in which auto-regulation processes are impaired. Bourion et al. (2007) showed that P118 was probably not impaired in the reduction of the nodulation zone as nodules were mainly situated on first-order laterals, like ‘Frisson’. In contrast, nodules where mainly localized on the tap root and at emergence of first laterals only for P121. In the present study, of importance was the finding that P118 was probably additionally impaired in the regulation of C partitioning between the shoot and the nodulated roots (especially the nodules), as nodule growth was not limited in P118 (unlike P121) and as it presumably happened at the expense of the shoot.
Which is the most efficient strategy for optimal N uptake?
The present study, aimed at analysing genetic variability associated with N nutrition, importantly showed that C partitioning rules within the whole plant play a major role in the regulation of potential N supply in pea. The results thus confirmed the high C costs associated with nodule synthesis and functioning. They also supported competition for C among synthesis, maintenance and functioning processes for both roots and nodules. Lastly, they showed the strong competition for C between roots and nodules and also between below-ground and aerial parts as summarized in Fig. 5. These are strong intrinsic properties, setting hard limits to the possible phenotypic traits to be targeted by breeders for genetic improvement of the efficiency of N acquisition by leguminous crop. This is also consistent with genetic analyses that showed that altered shoot and root growth and morphology are pleiotropic effects associated with hypernodulation (Postma et al., 1988; Sagan and Duc, 1996). It seems that these rules may be partly circumvented only through combining differential dynamics of root and nodule growth across time, as demonstrated by the singular (but unfavourable here) behaviour of ‘Frisson’ compared with other genotypes. As a consequence, the ideal genotype (or ‘ideotype’) for N nutrition must be engineered in terms of optimal complementarities of symbiotic fixation and root absorption in space and time rather than through the increase of either root or nodule dry matter. It must be emphasized that the ideal genotype will depend upon the environment where it is grown. As such, a genotype with a deep prospecting root may not be more efficient under well-watered conditions whereas it might perform ideally under dry conditions. From the perspective of relevant screen genetic performances associated with N nutrition, genotypes must therefore be compared under well-characterized conditions. As (a) C and N nutrition are strongly interrelated processes that remain difficult to de-correlate and (b) all scenarios of environmental conditions cannot reasonably be tested on a large number of genotypes (Tardieu et al., 2003), a modelling approach is being undertaken to identify the most relevant phenotypic traits to screen.
Another important finding of this work is that searching genetic variability on root development and/or efficiency may give more successful results than for nodules. Indeed, it was shown that (a) unlike for nitrate assimilation, the amount of N2 fixed was already maximal with the lowest nodule dry matter and (b) genetic variability associated with the roots may be greater than for nodules and less related to carbon.
Lastly, the present study demonstrated that N uptake was under the control of plant growth (that determines N demand) and thus only partly depended upon potential N supply (as defined here by root and nodule size and efficiency and by nitrate availability). This is in accordance with Mengel (1994) who stated that nitrogenase activity is a flexible process that adjusts to the N demands of the host. Thus, it could be argued that the apparent low nodule efficiency of hypernodulating mutants would be the result of adjustment to N demand, which was not higher than for wild types. This is not in contradiction with the hypothesis that C costs associated with excess nodule growth limit their apparent efficiency as hypernodulation also negatively affected shoot growth, resulting in turn in limiting N demand (Fig. 5). Therefore, like Van Kessel and Hartley (2000), we also believe that improvement of ‘the strength of the sink for N’ that determines N demand would also be an effective way to increase the total amount of N accumulated by legume crops. This could be achieved through better genotypic adaptation and/or crop management, principally in regard to climate stresses (shortage of water, high or low temperatures), time of sowing, pests and disease infestations, soil structure and soil fertility (Peoples et al., 1995; Van Kessel and Hartley, 2000). Moreover, to an environmentally friendly point of view, various balances between symbiotic fixation and nitrate root absorption that are likely to be modified either through genetic improvement or crop management must be engineered with the aim of limiting fossil N inputs and mineral N losses both at the field and at the cropping system scales (Peoples et al., 1995).
ACKNOWLEDGEMENTS
Our grateful thanks are due to H. de Larembergue, H. Houtin, P. Mathey, V. Durey, D. Contour, N. Blanc, B. Monier and P. Mangin for their help in the field work, B. Roy and O. Delfosse for the laboratory analyses and D. Meunier-Beillard for root image and data analysis. The experiment was carried out in a field of Jean-Luc Calabre at Labruyère (Côte-d'Or, France). This work was funded by the Regional Council of Burgundy. We also thank Dr R. Thompson for carefully reading the manuscript.
LITERATURE CITED
- Biedermannova E, Novak K, Vondrys J. Pea mutant Risnod27 as reference line for field assessment of impact of symbiotic nitrogen fixation. Journal of Plant Nutrition. 2002;25:2051–2066. [Google Scholar]
- Bourion V, Laguerre G, Depret G, Voisin AS, Salon C, Duc G. Genetic variability in nodulation and root growth affects nitrogen fixation and accumulation in pea. Annals of Botany. 2007;100:589–598. doi: 10.1093/aob/mcm147. [DOI] [PMC free article] [PubMed] [Google Scholar]
- Catano-Anollès G, Gresshof PM. Early induction of feedback regulatory responses governing nodulation in soybean. Plant Science. 1990;71:69–81. [Google Scholar]
- Catano-Anollès G, Gresshof PM. Plant genetic control of nodulation. Annunal Review of Microbiology. 1991;45:345–382. doi: 10.1146/annurev.mi.45.100191.002021. [DOI] [PubMed] [Google Scholar]
- Doré T. France: Institut National Agronomique Paris-Grignon; 1992. Analyse, par voie d'enquête, de la variabilité des rendements et des effets précédents du pois protéagineux de printemps (Pisum sativum L.) PhD Thesis. [Google Scholar]
- Duc G, Mariott A, Amarger N. Measurements of genetic variability for symbiotic dinitrogen fixation in field-grown fababean (Vicia faba L.) using a low level 15N-tracer technique. Plant and Soil. 1988;106:269–276. [Google Scholar]
- Duc G, Cros-Arteil S, Journet EP, Morandi D, Ochatt S, Prado-Vivant E. Supernodulation mutants of Pisum sativum and Medicago truncatula: characterization of the mutants and their symbiosis with Rhizobium and arbuscular mycorrhizal fungi. In: Parniske M, editor. EuroConference. Molecular Genetics of Model Legumes: Impact for Legume Biology and Breeding; 25–28 June 2000; Norwich, UK. 2000. [Google Scholar]
- Fischinger SA, Drevion JJ, Claassen N, Schulez J. Nitrogen from senescing leaves of commom bean is re-translocated to nodules and might be involved in a N-feedback mechanism regulation of nitrogen fixation. Journal of Plant Physiology. 2006;163:987–995. doi: 10.1016/j.jplph.2006.03.017. [DOI] [PubMed] [Google Scholar]
- Gastal F, Lemaire G. N uptake and distribution in crops: an agronomical and ecophysiological perspective. Journal of Experimental Botany. 2002;53:789–799. doi: 10.1093/jexbot/53.370.789. [DOI] [PubMed] [Google Scholar]
- Greenwood DJ, Gastal F, Lemaire G, Draycott A, Millard P, Neeteson JJ. Growth rate and %N of field grown crops: theory and experiments. Annals of Botany. 1991;67:181–190. [Google Scholar]
- Hacin JI, Bohlool BB, Singleton PW. Partitioning of 14C-labelled photosynthate to developing nodules and roots of soybean (Glycine max) New Phytologist. 1997;137:257–265. doi: 10.1046/j.1469-8137.1997.00812.x. [DOI] [PubMed] [Google Scholar]
- Hamblin A, Tennant D. Root length and water uptake in cereals and grain legumes: how well are they correlated? Australian Journal of Agricultural Research. 1987;38:513–527. [Google Scholar]
- Herridge D, Rose I. Breeding for enhanced nitrogen fixation in crop legumes. Field Crop Research. 2000;65:229–248. [Google Scholar]
- Jensen ES. Seasonnal patterns of growth and nitrogen fixation in field-grown pea. Plant and Soil. 1987;101:29–37. [Google Scholar]
- Jensen ES, Hauggaard-Nielsen H. How can increased use of biological N2 fixation in agriculture benefit the environment? Plant and Soil. 2003;252:177–186. [Google Scholar]
- Jeuffroy MH, Warembourg FR. Carbon transfer and partitioning between vegetative and reproductive organs in Pisum stivum L. Plant Physiology. 1991;97:440–448. doi: 10.1104/pp.97.1.440. [DOI] [PMC free article] [PubMed] [Google Scholar]
- Kosslak RM, Bolhool B. Suppression of nodule development of one side of split-root system of soybeans caused by prior inoculation of the other side. Plant Physiology. 1984;75:125–130. doi: 10.1104/pp.75.1.125. [DOI] [PMC free article] [PubMed] [Google Scholar]
- Lawlor DW. Carbon and nitrogen assimilation in relation to yield: mechanisms are the key to understanding production systems. Journal of experimental Botany. 2002;53:773–787. [PubMed] [Google Scholar]
- Layzell DB, Hunt S, Palmer GR. Mechanism of nitrogenase inhibition in soybean nodules. Pulse-modulated spectroscopy indicates that nitrogenase activity is limited by O2. Plant Physiology. 1990;92:1101–1107. doi: 10.1104/pp.92.4.1101. [DOI] [PMC free article] [PubMed] [Google Scholar]
- Ledgard SF. Nutrition, moisture and rhizobial strain influence isotopic fractionation during N2 fixation in pasture legumes. Soil Biology and Biochemistry. 1989;21:65–68. [Google Scholar]
- Lemaire G, Gastal F, Plenet D, Le Bot J. Le prélèvement d'azote par les peuplements végétaux et la production des cultures. In: Lemaire G, Nicolardot B, editors. Maîtrise de l'azote dans les agrosystèmes. Paris: INRA Editions; 1997. pp. 121–139. [Google Scholar]
- Malagoli P, Lainé P, Le Deunff E, Rossato L, Ney B, Ourry A. Modelling nitrogen uptake in oilseed rape cv capitol during a growth cycle using influx kinetics of root nitrate transport systems and field experimental data. Plant Physiology. 2004;134:388–400. doi: 10.1104/pp.103.029538. [DOI] [PMC free article] [PubMed] [Google Scholar]
- Mariotti A, Mariotti F, Amarger N, Pizelle G, Ngambi JM, Champigny ML, et al. Fractionnements isotopiques de l'azote lors des processus d'absorption des nitrates et de fixation de l'azote atmosphérique par les plantes. Physiologie Végétale. 1980;18:163–181. [Google Scholar]
- Mariotti A, Mariotti F, Amarger N. Nuclear technique in improving pasture management. Vienne: International Atomic Energy Agency; 1983. Use of 15N abundance in the measurement of symbiotic fixation; pp. 61–77. [Google Scholar]
- Mengel K. Symbiotic dinitrogen fixation: its dependance on plant nutrition and its ecophysiological impact. Zeitschrift für Pflanzenernährung und Bodenkunde. 1994;157:233–241. [Google Scholar]
- Muller B, Touraine B. Inhibition of NO3− uptake by various phloem translocated amino acids in soybean seedlings. Journal of Experimental Botany. 1992;43:617–623. [Google Scholar]
- Munier-Jolain NG, Carrouée B. Quelle place pour le pois dans une agriculture respectueuse de l'environnement: argumentaire agri-environnemental. Les Cahiers de l'Agriculture. 2003;12:111–120. [Google Scholar]
- Neo HH, Layzell DB. Phloem glutamine and the regulation of O2 diffusion in legume nodules. Plant Physiology. 1997;113:259–267. doi: 10.1104/pp.113.1.259. [DOI] [PMC free article] [PubMed] [Google Scholar]
- Ney B, Doré T, Sagan M. The nitrogen requirement of major agricultural crops: grain legumes. In: Lemaire G, editor. Diagnosis of the nitrogen status in crops. Heigelberg: Springer-Verlag; 1997. pp. 107–118. [Google Scholar]
- Oka-Kira E, Kawagashi M. Long distance signalling to control nodule number. Current opinion in Plant Biology. 2006;9:496–502. doi: 10.1016/j.pbi.2006.07.012. [DOI] [PubMed] [Google Scholar]
- Parsons R, Stanforth A, Raven JA, Sprent JI. Nodule growth and activity may be regulated by a feedback mechanism involving phloem nitrogen. Plant, Cell and Environment. 1993;16:125–136. [Google Scholar]
- Pate JS. Physiology of pea – a comparison with other legumes in terms of economy of carbon and nitrogen in whole-plant and organ functioning. In: Hebblethwaite PD, Heath MC, Dawkins TCK, editors. The pea crop. London: Butterworths; 1985. pp. 279–296. [Google Scholar]
- Pate JS, Flinn AM. Carbon and nitrogen transfer from vegetative organs to ripening seed of field pea (Pisum arvense L.) Journal of Experimental Botany. 1973;24:1090–1099. [Google Scholar]
- Peoples MB, Ladha JK, Herridgre DF. Enhancing legume N2 fixation through plant and soil management. Plant and Soil. 1995;174:83–101. [Google Scholar]
- Postma JG, Jacobsen E, Feenstra WJ. Three pea mutants with an altered nodulation studied by genetic analysis and grafting. Journal of Plant Physiology. 1988;132:424–430. [Google Scholar]
- Sagan M, Duc G. Sym28 and Sym29, two new genes involved in regulation of nodulation in pea (Pisum sativum L.) Symbiosis. 1996;20:229–245. [Google Scholar]
- Salon C, Munier-Jolain NG, Duc G, Voisin AS, Grandgirard D, Larmure A, et al. Grain legume seed filling in relation to nitrogen acquisition: a review and prospects with particular reference to pea. Agronomie. 2001;21:539–552. [Google Scholar]
- Schubert KR. Nitrogen assimilation by legumes – process and ecological limitations. Fertilizer Research. 1995;42:99–107. [Google Scholar]
- Schulze J. How are nitrogen fixation rates regulated in legumes? Journal of Plant Nutrition and Soil Science. 2004;167:125–137. [Google Scholar]
- Schulze J, Adgo E, Schilling G. The influence of N2-fixation on the carbon balance of leguminous plants. Experientia. 1994;50:906–916. [Google Scholar]
- Schulze J, Adgo E, Merbach W. Carbon costs associated with N2 fixation in Vicia faba L. and Pisum sativum L. over a 14-day period. Plant Biology. 1999;1:625–631. [Google Scholar]
- Sinclair TR, Horie T. Leaf nitrogen, photosynthesis, and crop radiation use efficiency: a review. Crop Science. 1989;29:90–98. [Google Scholar]
- Sinclair TR, de Witt CT. Photosynthate and nitrogen requirements for seed production by various crops. Science. 1975;189:565–567. doi: 10.1126/science.189.4202.565. [DOI] [PubMed] [Google Scholar]
- Sinclair TR, de Witt CT. Analysis of the carbon and nitrogen limitations to soybean yield. Agronomy Journal. 1976;68:319–324. [Google Scholar]
- Soussana JF, Hartwig UA. The effect of elevated CO2 on symbiotic N2 fixation: a link between the carbon and nitrogen cycles in grassland ecosystems. Plant and Soil. 1996;187:321–332. [Google Scholar]
- Sprent JI, Stephens JH, Rupela OP. Environmental effects on nitrogen fixation. In: Sumerfield RJ, editor. World crops: cool season food legumes. Dordrecht: Kluwer Academic Publishers; 1988. pp. 801–810. [Google Scholar]
- Tardieu F. Virtual plants: modelling as a tool for the genomics of tolerance to water deficit. Trends in Plant Science. 2003;8:9–14. doi: 10.1016/s1360-1385(02)00008-0. [DOI] [PubMed] [Google Scholar]
- Ulrich A. Physiological bases for assessing the nutritional requirements of plants. Annual Review of Plant Physiology. 1952;3:207–228. [Google Scholar]
- Unkovich MJ, Pate JS, Sanford P, Armstrong EL. Potential precision of the 15N natural abundance method in field estimates of nitrogen fixation by crop and pasture legumes in south-west Australia. Australian Journal of Agricultural Research. 1994;45:119–132. [Google Scholar]
- Vance CP, Heichel GH. Carbon in N2 fixation: limitation or exquisite adaptation. Annual Review of Plant Physiology and Plant Molecular Biology. 1991;42:373–392. [Google Scholar]
- Van Kessel C, Hartley C. Agricultural management of grain legumes: has it led to an increase in nitrogen fixation. Field Crop Research. 2000;65:165–181. [Google Scholar]
- Vocanson A, Munier-Jolain NG, Voisin AS, Ney B. Courbe de dilution. In: Munier-Jolain NG, et al., editors. Agrophysiologie du pois protéagineux. INRA Editions. 2005. pp. 81–86. [Google Scholar]
- Voisin AS, Salon C, Munier-Jolain NG, Ney B. Effect of mineral nitrogen on nitrogen nutrition and dry matter partitioning between the shoot and the roots of pea (Pisum sativum L.) Plant and Soil. 2002;242:251–262. [Google Scholar]
- Voisin AS, Salon C, Jeudy C, Warembourg FR. Seasonal patterns of 13C partitioning between shoots and nodulated roots of N2- or nitrate-fed Pisum sativum L. Annals of Botany. 2003;a 91:539–546. doi: 10.1093/aob/mcg055. [DOI] [PMC free article] [PubMed] [Google Scholar]
- Voisin AS, Salon C, Jeudy C, Warembourg FR. Root and nodule growth in Pisum sativum L. in relation to photosynthesis: analysis using 13C labelling. Annals of Botany. 2003;b 92:557–563. doi: 10.1093/aob/mcg174. [DOI] [PMC free article] [PubMed] [Google Scholar]
- Voisin AS, Salon C, Jeudy C, Warembourg FR. Symbiotic N2 fixation activity in relation to C economy of Pisum sativum L. as a function of plant phenology. Journal of Experimental Botany. 2003;c 54:2733–2744. doi: 10.1093/jxb/erg290. [DOI] [PubMed] [Google Scholar]
- Wu S, Harper JE. Dinitrogen fixation potential and yield of hypernodulating soybean mutants: a field evaluation. Crop Science. 1991;31:1233–1240. [Google Scholar]