

Abstract
Background and Aims
Hieracium sub-genus Pilosella (hawkweeds) is a taxonomically complicated group of vascular plants, the structure of which is substantially influenced by frequent interspecific hybridization and polyploidization. Two kinds of species, ‘basic’ and ‘intermediate’ (i.e. hybridogenous), are usually recognized. In this study, genome size variation was investigated in a representative set of Central European hawkweeds in order to assess the value of such a data set for species delineation and inference of evolutionary relationships.
Methods
Holoploid and monoploid genome sizes (C- and Cx-values) were determined using propidium iodide flow cytometry for 376 homogeneously cultivated individuals of Hieracium sub-genus Pilosella, including 24 species (271 individuals), five recent natural hybrids (seven individuals) and experimental F1 hybrids from four parental combinations (98 individuals). Chromosome counts were available for more than half of the plant accessions. Base composition (proportion of AT/GC bases) was cytometrically estimated in 73 individuals.
Key Results
Seven different ploidy levels (2x–8x) were detected, with intraspecific ploidy polymorphism (up to four different cytotypes) occurring in 11 wild species. Mean 2C-values varied approx. 4·3-fold from 3·53 pg in diploid H. hoppeanum to 15·30 pg in octoploid H. brachiatum. 1Cx-values ranged from 1·72 pg in H. pilosella to 2·16 pg in H. echioides (1·26-fold). The DNA content of (high) polyploids was usually proportional to the DNA values of their diploid/low polyploid counterparts, indicating lack of processes altering genome size (i.e. genome down-sizing). Most species showed constant nuclear DNA amounts, exceptions being three hybridogenous taxa, in which introgressive hybridization was suggested as a presumable trigger for genome size variation. Monoploid genome sizes of hybridogenous species were always between the corresponding values of their putative parents. In addition, there was a good congruency between actual DNA estimates and theoretical values inferred from putative parental combinations and between DNA values of experimental F1 hybrids and corresponding established hybridogenous taxa.
Conclusions
Significant differences in genome size between hawkweed species from hybridogenous lineages involving the small-genome H. pilosella document the usefulness of nuclear DNA content as a supportive marker for reliable delineation of several of the most problematic taxa in Hieracium sub-genus Pilosella (including classification of borderline morphotypes). In addition, genome size data were shown to have a good predictive value for inferring evolutionary relationships and genome constitution (i.e. putative parental combinations) in hybridogenous species.
Key words: Agamic complex, AT/GC base ratio, DNA C-value, flow cytometry, genome composition, genome size, hawkweeds, Hieracium sub-genus Pilosella, hybridization, nuclear DNA content, polyploidy, taxonomy
INTRODUCTION
Hieracium sub-genus Pilosella ranks taxonomically among the most challenging groups of vascular plants in the European flora. Its complexity is primarily governed by frequent hybridization, accompanied by polyploidization and subsequent stabilization of novel forms by agamospermous reproduction and/or clonal growth (reviewed in Krahulcová et al., 2000). This complicated structure has led to the recognition of a large number of morphotypes (e.g. Zahn, 1922–1930) and has triggered continuous dispute concerning boundaries between the taxa and their evolutionary relationships.
Members of the subgenus show extensive variation in ploidy levels, ranging from diploid to octoploid, based on x = 9. Earlier surveys indicated that about half of the taxa grown in natural conditions comprised two or more cytotypes (Schuhwerk, 1996; Krahulcová et al., 2000), and more recent karyological studies revealed an even higher frequency of incidence of intraspecific ploidy polymorphism (Vladimirov and Szeląg, 2001; Rotreklová et al., 2002, 2005; Schuhwerk and Lippert, 2002; Krahulec et al., 2004; Rotreklová, 2004). In addition, different cytotypes and/or species can often grow together at the same locality (Schuhwerk, 1996; Jenkins and Jong, 1997; Schuhwerk and Lippert, 1997, 2002; Krahulcová and Krahulec, 1999; Krahulcová et al., 2001; Krahulec et al., 2004). In contrast to the common occurrence of aneuploids among progeny of certain experimental heteroploid crosses (Gadella, 1987, 1991a; Krahulcová and Krahulec, 2000), aneuploid individuals have only rarely been recorded in the wild in Europe, possibly because of their inferior viability (reviewed in Krahulcová et al., 2000). Nevertheless, they occur more frequently in introduced populations in New Zealand (Chapman and Lambie, 1999, but compare Morgan-Richards et al., 2004).
In a number of species, both sexual and agamospermous reproduction has been detected (Krahulcová et al., 2000). Agamospermy (autonomous apospory) in hawkweeds is facultative and, as a result, sexual and asexual reproductive pathways can be combined within one capitulum of a maternal plant (Koltunow et al., 1998; Krahulcová et al., 2004) or even within one ovule (polyembryony; Bicknell et al., 2003). In addition, autonomous (parthenogenetic) development of a reduced (meiotic) egg cell and fertilization of unreduced gametes have been observed in some polyploid species (Bicknell et al., 2003; Krahulcová et al., 2004).
Variation in ploidy levels and modes of reproduction is accompanied by tremendous morphological polymorphism, largely generated by frequent hybridization. Most species hybridize readily when they occur sympatrically, and intercytotype crosses within the same species are also common (Gadella, 1987, 1991b). Not only sexual plants but also their agamospermous counterparts can be involved in hybridization, either as male or as female parents (Krahulcová et al., 2000; Krahulec et al., 2004). Moreover, primary hybrids may backcross with their parental species, giving rise to complex hybrid swarms or a set of distinct morphotypes, either apomictic or sexual. Hybridization-driven polymorphism may be further multiplied by polyploidization via the unreduced gametes involved in crosses (Gadella, 1988; Bicknell et al., 2003; Krahulcová et al., 2004; Krahulec et al., 2004). Recent molecular studies have documented that the same hybrid product can arise repeatedly at different spatial and temporal scales (Fehrer et al., 2005). Consequently, both stabilized and recent hybrids, putatively of the same origin, can be recorded in the wild (Krahulcová et al., 2000; Krahulec et al., 2004; Fehrer et al., 2005, 2007b).
Enormous phenotypic variation encountered in the sub-genus Pilosella led to the description of a large number of taxa at specific and lower taxonomic ranks (e.g. Zahn, 1922–1930), a circumscription of which mirrored the taxonomic concept adopted (for a review, see Krahulec and Krahulcová, 2006). Basically, two groups of species are recognized according to their putative origin (Nägeli and Peter, 1885; Zahn, 1922–1930): (1) the so-called ‘basic species’ (‘Hauptarten’ according to the original German literature); and (2) the ‘intermediate species’ (‘Zwischenarten’), which are regarded as stabilized hybrids between the basic species. Complex evolutionary relationships between the species are usually expressed in the form of network diagrams, which show the position of a particular hybridogenous taxon with respect to its putative parents and whether it is intermediate or closer to one of the parents (see Schuhwerk and Fischer, 2003; Krahulec et al., 2004). Although the network diagrams use discrete categories, intermediate species often interconnect with their basic counterparts almost continuously, leading to vague between-species boundaries.
Over the last decade, flow cytometry (FCM), a method for rapid estimation of genome size in either relative or absolute units, has been successfully applied to gain deeper insights into the structure and evolutionary dynamics of Hieracium sub-genus Pilosella. For example, Chapman et al. (2003) used FCM to determine DNA ploidy levels in H. pilosella and trace the origin of sexual progeny which arose from crosses between two facultatively apomictic parents. The same approach was applied to determine and quantify reproductive pathways in progeny of H. rubrum (Krahulcová et al., 2004). The authors observed a strong selection against certain ploidy categories during germination and early stages of seedling development (see also Krahulec et al., 2006). Mating interactions between diploid, triploid and tetraploid cytotypes of H. echioides were studied by Peckert and Chrtek (2006), and interspecific hybridization among introduced species was assessed in New Zealand (Morgan-Richards et al., 2004). In addition, FCM has proved useful in screening DNA ploidy levels of several European species (Rotreklová et al., 2005). However, all these surveys used the fluorochrome DAPI (4′,6-diamidino-2-phenylindole) to stain the DNA, which binds preferentially to AT-rich regions, and therefore does not provide absolute measures of nuclear DNA content (in DNA picograms or base pairs). The only study focused on absolute genome size estimation in sub-genus Pilosella was published more than a decade ago by Bräutigam and Bräutigam (1996). Recording fluorescence intensities of propidium iodide-stained nuclei, the authors determined the ratios between peak positions of the internal reference standard (diploid H. lactucella) and eight Hieracium taxa co-existing at a species-rich locality in Lower Saxony, Germany. Hieracium pilosella, a widespread basic species and putative parent of many hybridogenous types (including stabilized intermediate species), was shown to possess a significantly smaller monoploid genome than the remaining taxa subjected to FCM analyses. The values collected by Bräutigam and Bräutigam were later converted to absolute units by comparison of H. lactucella with chicken red blood cells (Bennett et al., 2000).
Despite this pioneering work, there is still a dearth of genome size data in Hieracium sub-genus Pilosella, and targeted investigation of their use with respect to contemporary taxonomic and evolutionary concepts is needed. An ever-increasing number of pages have documented that genome size is a fundamental biological character involved in scaling of living organisms and affecting many characters at the sub-cellular, cellular, tissue and organismal levels, such as nuclear and cell volumes, duration of mitotic and meiotic cycles, and seed weight (Leitch and Bennett, 2007). In addition, variation in plant phenology (Grime et al., 1985), sensitivity to frost (MacGillivray and Grime, 1995) and ecological sorting according to water availability (Bottini et al., 2000) may all be related to genome size. In plant taxonomy, genome size data have facilitated taxon delimitation at specific (e.g. Mishiba et al., 2000), sub-specific (Dimitrova et al., 1999) and sectional levels (Zonneveld, 2001; Matzk et al., 2003; Záveský et al., 2005). Identification of both heteroploid and homoploid hybrids is also feasible in many plant groups (Jeschke et al., 2003; Mahelka et al., 2005). Another application concerns assessment of genome constitution in allopolyploid taxa, e.g. in triploid and tetraploid bananas (Lysák et al., 1999).
To fill the gap in our knowledge of genome size differentiation in sub-genus Pilosella and to assess the usefulness of such information for taxonomic purposes, nuclear DNA contents were estimated in a representative set of predominantly Central European taxa, including both basic and intermediate species and natural and experimental hybrids. The following questions were addressed: (a) What is the level of interspecific variation in holoploid and monoploid genome sizes? (b) What is the level of intraspecific genome size variation? Do basic and intermediate species differ in this respect? (c) Is there any divergence in genome size between recent crosses and established hybridogenous taxa of the same putative parentage? (d) Can genome size data be helpful in taxon delineation and/or clarification of species relationships?
MATERIALS AND METHODS
Plant material
Plants of Hieracium sub-genus Pilosella (Hill) S. F. Gray were collected in the field during 1995–2005 and grown under homogenous conditions in the Experimental Garden of the Institute of Botany, Academy of Sciences, Průhonice, Czech Republic [49°59′30″N, 14°34′00″E, approx. 320 metres above sea level (asl)]. The area sampled covered Austria, Bulgaria, the Czech Republic, Germany, Hungary, Poland, Romania and Slovakia, spanning the geographic range 41°38′–52°52′N and 7°28′–25°26′E, and elevational range 150–1900 m asl (see Supplementary Information, available online). Two hundred and seventy-eight wild-collected samples were available, comprising ten basic species (23 cytotypes and 184 individuals), 14 intermediate (=hybridogenous) species (23 cytotypes and 87 individuals) and five recent natural hybrids (five cytotypes and seven individuals). In addition, 98 F1 individuals (nine cytotypes) from experimental hybridization of four parental combinations (see Krahulcová and Krahulec, 2000; Krahulcová et al., 2004 for details on crossing experiments) were included in the study. Recent hybrids excluded, the ploidy composition in wild plants was as follows: diploids – six taxa, 63 individuals; triploids – two taxa, 12 individuals; tetraploids – 16 taxa, 118 individuals; pentaploids – 12 taxa, 47 individuals; hexaploids – five taxa, 22 individuals; heptaploids – four taxa, seven individuals; and octoploids – one taxon, two individuals. Multiple accessions (2–19) were available for 36 cytotypes/species, and the remaining ten cytotypes/species were represented by one accession only. Nearly half of the established species (11 out of 24) showed ploidy polymorphism. Genome size was determined in 376 individuals from 24 species and nine recent hybrids (both natural and artificial). Seventy-three individuals (six basic species + one experimental hybrid, 11 cytotypes) were used for estimation of AT/GC base ratios (Table 1).
Table 1.
Ploidy level(s), putative genomic constitution(s) of intermediate (hybridogenous) species together with inferred monoploid genome size(s), mean 2C-values with standard errors and DNA ranges, intracytotype variation in holoploid genome size (%), 1Cx-values (means and ranges), proportion of AT base pairs, internal standard used and the number of analysed accessions for 60 cytotypes belonging to 24 species (both basic and hybridogenous) and nine recent crosses (both field and experimental)
| Species/crosses | Ploidy level* | No. of samples† | Putative constitution of intermediate species/crosses‡ | Theoretical Cx-value (pg DNA)‡ | Mean 2C-value ± s.e. (pg DNA)¶ | 2C-value range (pg DNA) | Variation (max/min, %) | Mean Cx-value (2C-value/ploidy level, pg DNA) | Cx-value range (pg DNA) | Mean AT ± s.e. (%)¶ | Internal standard$ |
|---|---|---|---|---|---|---|---|---|---|---|---|
| Basic species | |||||||||||
| H. aurantiacum L. (AU) | 4x | 18/5 | 7·79 ± 0·04 ST | 7·75–7·89 | 1·8 | 1·95 | 1·94–1·97 | 59·3 ± 0·1 DE | Z | ||
| 5x | 6/1 | 9·51 ± 0·06 L | 9·42–9·63 | 2·2 | 1·90 | 1·88–1·93 | 59·4 D | Z | |||
| H. bauhinii Besser (BA) | 4x | 2 | 8·27 ± 0·02 OP | 8·25–8·29 | 0·6 | 2·07 | 2·06–2·07 | Z | |||
| 5x | 9 | 10·07 ± 0·10 K | 9·96–10·29 | 3·3 | 2·01 | 1·99–2·06 | P | ||||
| 6x | 3 | 11·40 ± 0·17 E | 11·27–11·64 | 3·3 | 1·90 | 1·88–1·94 | P | ||||
| 7x | 1 | 13·86 B | – | – | 1·98 | – | P | ||||
| H. caespitosum Dumort. (CE) | 4x | 8/5 | 8·22 ± 0·04 PQ | 8·16–8·29 | 1·6 | 2·05 | 2·04–2·07 | 59·5 ± 0·0 BCD | Z | ||
| 5x (FCM) | 1 | 10·10 JK | – | – | 2·02 | – | P | ||||
| H. cymosum L. (CY) | 2x | 17/16 | 4·15 ± 0·03 ZØ | 4·11–4·20 | 2·2 | 2·07 | 2·05–2·10 | 59·7 ± 0·1 AB | Z | ||
| 4x | 3/2 | 7·92 ± 0·07 QRS | 7·87–8·03 | 2·0 | 1·98 | 1·97–2·01 | 59·1 ± 0·0 E | Z | |||
| ssp. cymigerum Reichenb. | 5x | 1 | 10·06 K | – | – | 2·01 | – | P | |||
| H. echioides L. (EC) | 2x | 16 | 4·31 ± 0·03 Z | 4·25–4·36 | 2·7 | 2·16 | 2·13–2·18 | Z | |||
| 3x | 10 | 6·48 ± 0·04 W | 6·41–6·55 | 2·1 | 2·16 | 2·14–2·18 | Z | ||||
| 4x | 12 | 8·56 ± 0·07 NO | 8·45–8·67 | 2·7 | 2·14 | 2·11–2·17 | Z | ||||
| 5x | 4 | 10·55 ± 0·02 H | 10·53–10·58 | 0·5 | 2·11 | 2·11–2·12 | Z | ||||
| H. hoppeanum Schultes (HO) (incl. subsp. testimoniale Nägeli ex Peter) | 2x | 5 | 3·53 ± 0·02 β | 3·49–3·56 | 1·8 | 1·76 | 1·75–1·78 | Z | |||
| H. lactucella Wallr. (LA) | 2x | 19/13 | 4·07 ± 0·03 ZØ | 4·01–4·12 | 2·9 | 2·03 | 2·00–2·06 | 59·8 ± 0·1 A | Z | ||
| H. onegense (Norrl.) Norrl. (ON) | 2x | 5/5 | 4·23 ± 0·04 Z | 4·18–4·30 | 2·7 | 2·12 | 2·09–2·15 | 59·6 ± 0·1 ABC | Z | ||
| H. pavichii Heuffel (PAV) | 2x (FCM) | 1 | 3·93 Ø | – | – | 1·96 | – | ||||
| H. pilosella L. (PI) | 4x | 26/17 | 6·89 ± 0·04 W | 6·83–7·00 | 2·4 | 1·72 | 1·71–1·75 | 59·4 ± 0·1 D | Z | ||
| 5x | 7/5 | 8·62 ± 0·07 N | 8·52–8·76 | 2·7 | 1·72 | 1·70–1·75 | 59·3 ± 0·1 DE | Z | |||
| 6x | 9/3 | 10·43 ± 0·08 HI | 10·33–10·59 | 2·6 | 1·74 | 1·72–1·77 | 59·4 ± 0·2 DC | P | |||
| 7x | 1 | 12·11 D | – | – | 1·73 | – | P | ||||
| Intermediate species** | |||||||||||
| H. bifurcum M. Bieb. (BI = EC < PI) | 5x | 1 | 1/2 EC (2x) + PI (4x) | 1·81 | 9·23 LM | – | – | 1·85 | – | Z | |
| H. blyttianum Fries (BL = AU ≤ LA) | 4x | 2 | 3/5AU (5x) + 1/2 LA (2x) | 1·94 | 7·72 ± 0·01 STU | 7·71–7·73 | 0·3 | 1·93 | 1·93–1·93 | Z | |
| 1/2 AU (4x) + LA (2x) | 1·99 | ||||||||||
| H. brachiatum Bertol. ex DC. (BRA = PI > BA) | 4x | 3 | 1/2 PI (4x) + 1/2 BA (4x) | 1·88 | 7·52 ± 0·19 TUV | 7·32–7·77 | 6·1 | 1·88 | 1·83–1·94 | Z | |
| 1/2 PI (4x) + 2/5 BA (5x) | 1·87 | ||||||||||
| 5x | 2 | 3/5 PI (5x) + 1/2 BA (4x) | 1·84 | 9·26 ± 0·21 LM | 9·04–9·47 | 4·7 | 1·85 | 1·81–1·89 | Z | ||
| 7x | 4 | BRA (5x) + 1/2 PI (4x)# | 1·84 | 13·19 ± 0·14 C | 12·95–13·29 | 2·6 | 1·88 | 1·85–1·90 | P | ||
| PI (5x) + 1/2 BA (4x) | 1·82 | ||||||||||
| PI (5x) + 2/5 BA (5x) | 1·81 | ||||||||||
| BRA (5x) + 1/2 BRA (4x)# | 1·80 | ||||||||||
| 8x | 2 | PI (4x) + BA (4x) | 1·88 | 15·30 A | 15·14–15·47 | 2·2 | 1·91 | 1·89–1·93 | P | ||
| BRA (5x) + 3/5 BRA (5x)# | 1·85 | ||||||||||
| PI (6x) +1/2 BA (4x) | 1·82 | ||||||||||
| PI (6x) + 2/5 BA (5x) | 1·81 | ||||||||||
| BRA (4x) + PI (4x)# | 1·80 | ||||||||||
| H. floribundum Wimm. et Grab. (FL = CE > LA) | 4x | 10 | 1/2 CE (4x) + LA (2x) | 2·04 | 8·20 ± 0·08 PQ | 8·08–8·33 | 3·0 | 2·05 | 2·02–2·08 | Z | |
| 5x (FCM) | 2 | CE (4x) + 1/2 LA (2x) | 2·05 | 10·40 ± 0·11 HIJ | 10·29–10·51 | 2·1 | 2·08 | 2·06–2·10 | P | ||
| 3/5 CE (5x) + LA (2x) | 2·02 | ||||||||||
| H. glomeratum Froel. (GL = CE – CY) | 4x | 1 | 1/2 CE (4x) + CY (2x) | 2·06 | 8·26 P | – | – | 2·06 | – | Z | |
| 1/2 CE (4x) + 1/2 CY (4x) | 2·04 | ||||||||||
| 5x | 6 | GL (4x) + 1/2 CY (2x)# | 2·06 | 10·20 ± 0·04 IJK | 10·14–10·26 | 1·2 | 2·04 | 2·03–2·05 | P | ||
| CE (4x) + 1/2 CY (2x) | 2·05 | ||||||||||
| H. iseranum Uechtr. (IS = FL > PI) | 4x | 7 | 1/2 FL (4x) + 1/2 PF (4x)# | 1·97 | 7·87 ± 0·06 RS | 7·76–7·97 | 2·7 | 1·97 | 1·94–1·99 | Z | |
| 1/2 FL (4x) + 1/2 PI (4x)# | 1·89 | ||||||||||
| H. leptophyton Nägeli et Peter (LEP = PI < BA) | 7x | 1 | BA (5x) + 1/2 PI (4x) | 1·93 | 13·66 B | – | – | 1·95 | – | P | |
| H. macrostolonum G. Schneider (MA = CE < PI or ON < PI) | 6x (FCM) | 1 | 1/2 CE (4x) + PI (4x) | 1·84 | 10·98 FG | – | – | 1·83 | – | P | |
| 1/2 ON (2x) + PI (5x) | 1·79 | ||||||||||
| CE (4x) + 1/2 PI (4x) | 1·95 | ||||||||||
| H. piloselliflorum Nägeli et Peter (PF = FL < PI) (incl. H. apatelium Nägeli et Peter) | 4x | 8 | 1/2 FL (4x) + 1/2 PI (4x)# | 1·89 | 7·53 ± 0·10 TUV | 7·36–7·67 | 4·2 | 1·88 | 1·84–1·92 | Z | |
| 1/2 IS (4x) + 1/2 PI (4x)# | 1·85 | ||||||||||
| 5x | 5 | 1/2 PF (4x) + 1/2 PF (6x)# | 1·82 | 9·00 ± 0·23 M | 8·80–9·46 | 7·4 | 1·80 | 1·76–1·89 | Z | ||
| 6x | 3 | PI (4x) + 1/2 IS (4x)# | 1·80 | 10·69 ± 0·04 GH | 10·63–10·73 | 0·2 | 1·78 | 1·77–1·79 | P | ||
| 1/2 FL (4x) + PI (4x)# | 1·84 | ||||||||||
| PF (4x) + 1/2 PF (4x)# | 1·88 | ||||||||||
| IS (4x) + 1/2 PI (4x)# | 1·94 | ||||||||||
| H. rothianum Wallr. (RO = EC > PI) | 4x | 7 | 1/2 EC (4x) + 1/2 PI (4x) | 1·93 | 8·14 ± 0·07 PQR | 7·99–8·20 | 2·6 | 2·03 | 2·00–2·05 | Z | |
| 1/2 EC (4x) + 2/5 PI (5x) | 1·93 | ||||||||||
| H. rubrum Peter (RU = AU > PI) | 6x | 6 | AU (4x) + 1/2 PI (4x) | 1·87 | 11·05 ± 0·04 F | 10·98–11·11 | 1·2 | 1·84 | 1·83–1·85 | P | |
| H. scandinavicum Dahlst. (SCA = FL – GL) | 4x (FCM) | 2 | 1/2 FL (4x) + 1/2 GL (4x)# | 2·06 | 8·15 ± 0·00 PQR | 8·15–8·15 | 0·0 | 2·04 | 2·04–2·04 | Z | |
| H. schultesii F.W. Schultz (SC = LA – PI) | 3x (FCM) | 2 | 1/2 LA (2x) + 1/2 PI (4x) | 1·83 | 5·54 ± 0·00 Y | 5·54–5·54 | 0·0 | 1·85 | 1·85–1·85 | P | |
| 4x | 6 | LA (2x) + 1/2 PI (4x) | 1·88 | 7·46 ± 0·15 UV | 7·21–7·63 | 5·7 | 1·86 | 1·80–1·91 | Z | ||
| 5x | 3 | 1/2 LA (2x) + PI (4x) | 1·79 | 9·18 ± 0·19 M | 8·91–9·37 | 5·1 | 1·84 | 1·78–1·87 | Z | ||
| 1/2 LA (2x) + SC (4x)# | 1·90 | ||||||||||
| H. stoloniflorum Waldst. et Kit. (SF = AU ≤ PI) | 4x | 3 | 1/2 AU (4x) + 1/2 PI (4x) | 1·84 | 7·25 ± 0·07 V | 7·17–7·33 | 2·3 | 1·81 | 1·79–1·83 | Z | |
| Primary field crosses | |||||||||||
| AU (4x) × LA (2x) [∼BL] | 3x | 1 | 1/2 AU (4x) + 1/2 LA (2x) | 1·98 | 6·04 | – | – | 2·01 | – | P | |
| AU (4x) × RU (6x) | 7x | 1 | AU (4x) + 1/2 RU (6x) | 1·90 | 13·24 | – | – | 1·89 | – | P | |
| FL (4x) × PI (4x) [∼IS or PF] | 6x | 2 | FL (4x) + 1/2 PI (4x) | 1·94 | 11·56 ± 0·06 | 11·49–11·62 | 1·1 | 1·93 | 1·92–1·94 | P | |
| 1/2 FL (4x) + PI (4x) | 1·84 | ||||||||||
| LA (2x) × ON (2x) [∼FL or CE] | 2x | 2/1 | 1/2 LA (2x) + 1/2 ON (2x) | 2·07 | 4·19 ± 0·01 | 4·19–4·20 | 0·4 | 2·10 | 2·09–2·10 | 59·7 | Z |
| PI (4x) × RU (6x) [∼SF] | 5x | 1 | 1/2 PI (4x) + 1/2 RU (6x) | 1·79 | 8·89 | – | – | 1·78 | – | Z | |
| Experimental crosses | |||||||||||
| BA (6x) ×PI (4x) [∼BRA or LEP] | 3x | 1 | 1/2 BA (6x) = trihaploid BA | 1·89 | 5·78 | – | – | 1·93 | – | P | |
| 5x | 5 | 1/2 BA (6x) + 1/2 PI (4x) | 1·83 | 9·14 ± 0·06 | 9·01–9·20 | 2·1 | 1·83 | 1·80–1·84 | Z | ||
| PI (4x) × AU (4x) [∼SF or RU] | 4x | 8 | 1/2 PI (4x) + 1/2 AU (4x) | 1·84 | 7·35 ± 0·06 | 7·25–7·46 | 2·9 | 1·84 | 1·81–1·86 | Z | |
| 6x | 3 | 1/2 PI (4x) + AU (4x) | 1·87 | 11·09 ± 0·01 | 11·08–11·10 | 0·2 | 1·85 | 1·85–1·85 | P | ||
| PI (4x) + 1/2 AU (4x) | 1·80 | ||||||||||
| PI (4x) × LA (2x) [∼SC] | 3x | 3 | 1/2 PI (4x) + 1/2 LA (2x) | 1·83 | 5·46 ± 0·02 | 5·43–5·48 | 0·9 | 1·82 | 1·81–1·83 | P | |
| RU (6x) × PI (4x) [∼SF] | 3x (!) | 25 | 1/2 RU (6x) = trihaploid RU | 1·84 | 5·68 ± 0·10 | 5·38–5·91 | 9·9 | 1·89 | 1·79–1·97 | P | |
| 5x ! | 31 | 1/2 RU (6x) + 1/2 PI (4x) | 1·79 | 8·98 ± 0·18 | 8·61–9·39 | 9·1 | 1·80 | 1·72–1·88 | Z | ||
| 7x | 3 | 1/2 RU (6x) + PI (4x) | 1·78 | 12·80 ± 0·10 | 12·66–12·91 | 1·9 | 1·83 | 1·81–1·84 | P | ||
| 8x | 19 | RU (6x) + 1/2 PI (4x) | 1·81 | 14·32 ± 0·10 | 14·08–14·44 | 2·5 | 1·79 | 1·76–1·80 | P |
* Ploidy levels were mostly determined from chromosome numbers (see Supplementary Information), considering x = 9. FCM denotes plants for which no counts were available and (DNA) ploidy was inferred from flow cytometric analyses. An exclamation mark in experimental F1 crosses indicates occurrence of aneuploid individuals.
† Number of individuals used for genome size estimation/number of individuals used for AT/GC ratio estimation. If only one number is present, no AT/GC analyses were performed.
‡ Putative genome constitution of intermediate (hybridogenous) species and recent crosses (possible backcrossing or multiple crossing of basic species is indicated by #). If more alternatives are presented, they are arranged in order of decreasing correspondence with estimated Cx-values. Only alternatives matching phenotypes of hybridogenous taxa were considered.
§ Expected monoploid genome size (Cx-value in DNA picograms) of intermediate species and crosses inferred from their putative genome constitution.
¶ Letters indicate groups of taxa/cytotypes that are not significantly different at α = 0·05.
$ P = Pisum sativum ‘Ctirad’ (2C = 8·85 pg, AT = 61·5 %); Z = Zea mays ‘CE-777’ (2C = 5·43 pg, AT = 52·8 %).
** Putative origin of intermediate (i.e. hybridogenous) species together with relative contribution of basic (i.e. parental) species is indicated in parentheses: –, equal contribution of both parents (intermediate phenotype); > and <, higher and lower influence of a particular parental species, respectively, due to backcrossing and/or involvement of unreduced gametes.
The genomic origin of intermediate species was mainly determined on the basis of (a) detailed knowledge of the morphology of particular species; and (b) direct synthesis of the respective morphotypes by experimental hybridization. Despite the usefulness of molecular data for resolving some hybridogenous complexes (e.g. Hegarty and Hiscock, 2005), our experience (J. Fehrer et al., unpubl. res.) shows that any straightforward use of molecular markers for taxon delimitation in Hieracium sub-genus Pilosella is problematic due to a complex pattern of hybridization, including marked between-region differences. To guarantee accurate species determination, numerous plant accessions were revised by hawkweed specialists using both original herbarium vouchers and cultivated individuals (see Supplementary Information available online). A list of full taxa names (including authors' combination) is provided in Table 1. Herbarium vouchers are kept in the PRA.
Genome size and base ratio determination
Genome size and AT/GC base ratio were determined by flow cytometry using Partec CyFlow and PA II instruments (Partec GmbH, Münster, Germany) equipped with a green (532 nm) solid state laser and an air-cooled 488 nm argon-ion laser + HBO mercury arc lamp for UV excitation, respectively. The analyses were performed during 2001–2005. Sample preparation followed the two-step procedure originally described by Otto (1990). Zea mays ‘CE-777’ (2C = 5·43 pg, Lysák and Doležel, 1998; AT = 52·8 %, Barow and Meister, 2002) was chosen as an appropriate primary reference standard (with close but not overlapping genome size for most Hieracium accessions). Pisum sativum ‘Ctirad’ served as a secondary reference standard; its 2C-value and AT ratio (2C = 8·85 pg, AT = 61·5 %) were calibrated against Z. mays (ten replicates on different days). Intact leaf tissues of the analysed Hieracium plant (approx. 1 cm2) and an appropriate quantity of the internal standard were chopped with a sharp razor blade in a Petri dish containing 1 mL of ice-cold Otto I buffer (0·1 m citric acid, 0·5 % Tween-20). The suspension was filtered through a 42 µm nylon mesh and centrifuged (150 g for 5 min). The supernatant was removed and the pellet was resuspended in 100 µL of fresh ice-cold Otto I buffer. Samples were incubated for 20 min at room temperature, and stained with 1 mL of Otto II buffer (0·4 m Na2HPO4·12 H2O) supplemented with β-mercaptoethanol (2 µL mL−1) and a fluorochrome. Propidium iodide (PI) + RNase IIA (both at concentrations of 50 µL mL−1) were used for determination of genome size in absolute units (DNA picograms); DAPI at a concentration of 4 µL mL−1 was used in assays aimed at estimating the base ratio (proportion of AT/GC bases). Samples were stained for 20 min at room temperature and analysed with the flow cytometer. Isolated nuclei were excited either by a laser (for propidium iodide staining) or by a mercury arc lamp (for DAPI staining), and the fluorescence intensity of 5000 particles was recorded. Only histograms with both peaks of similar height were considered (with the smaller peak at least 70 % the height of the higher peak). The threshold for accepting the analyses was set as follows: coefficients of variation (CVs) of G0/G1 peaks of both sample and standard below 5·0 and 3·0 % for PI and DAPI staining, respectively. Each plant was re-estimated at least three times on different days to minimize potential random instrumental drift. If a between-day variation exceeded 2 %, the value showing the greatest deviation was discarded and the sample re-analysed. Accessions with intraspecific genome size variation above 3·5 % were run simultaneously to confirm the divergence. The proportion of AT/GC bases was estimated according to the formula of Godelle et al. (1993), assuming four consecutive AT bases to bind a DAPI molecule. The genome size terminology follows Greilhuber et al. (2005).
Chromosome numbers and DNA ploidy levels
Chromosome counts were available for 61·2 % of individuals collected in the wild (see Supplementary Information available online). Ninety-four counts were published elsewhere (Krahulcová and Krahulec, 1999; Krahulcová et al., 2001; Rotreklová et al., 2002, 2005) and 76 were determined in the present study following the methodology of Krahulcová and Krahulec (1999). For 108 samples, exact chromosome numbers were lacking. Nonetheless, their DNA ploidy levels were separately determined using DAPI flow cytometry (Krahulcová et al., 2004) prior to genome size measurements. Karyologically confirmed internal standards (either the same species or a putative parental taxon in the case of hybrids) were used as reference points. Altogether, at least one individual was counted for each cytotype per taxon, except H. caespitosum (5x), H. floribundum (5x), H. macrostolonum (6x), H. pavichii (2x), H. scandinavicum (4x) and H. schultesii (3x).
Statistical analyses
Data were analysed using the statistical package SAS 8·1 (SAS Institute, Cary, NC, USA). A General Linear Model (procedure GLM) was used to test differences in genome size and base pair ratio among species, and Tukey's grouping was applied to compare mean values. The GLM procedure involves models relating one or several continuous dependent variables to one or several independent variables. Among others, this procedure is useful for analysis of variance, especially for unbalanced data (it is more flexible than ANOVA).
RESULTS
Flow cytometric analyses yielded high-resolution histograms (Fig. 1) with CVs of G0/G1 peaks for Hieracium samples ranging from 1·31 to 4·87 % (mean 2·66 %) and from 1·00 to 2·94 % (mean 1·59 %) in acquisitions with PI and DAPI, respectively. The values for internal reference standards were 1·55–4·90 % (mean 2·58 %) and 0·92–2·52 % (mean 1·39 %) for PI and DAPI, respectively. Generally, CVs of diploid cytotypes were lower than those of polyploid counterparts.
Fig. 1.
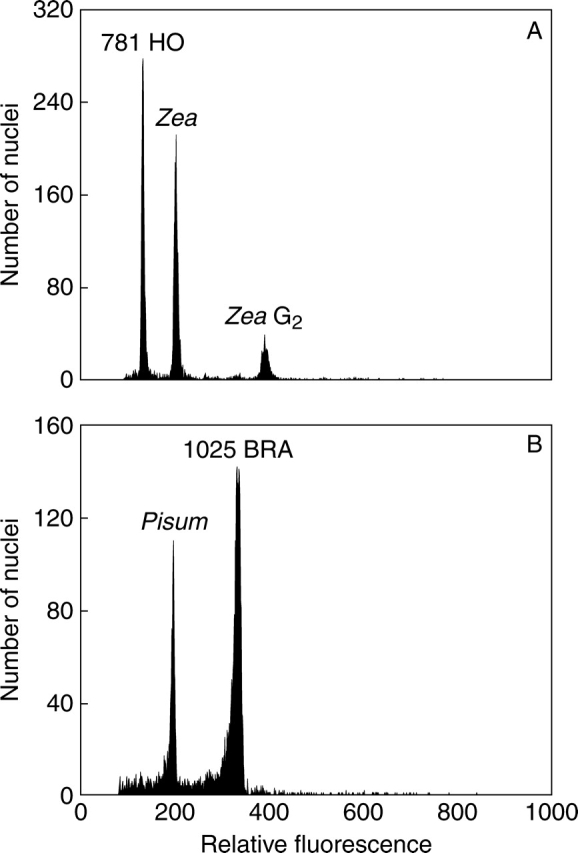
Genome size determination in Hieracium sub-genus Pilosella species with the smallest and the largest C-values. (A) Diploid H. hoppeanum (accession 781 HO) + Zea mays as an internal reference standard (mean sample 1C-value = 1·77 pg; peak ratio, 1·529; CVs, 2·08 and 2·01 %). (B) Octoploid H. brachiatum (accession 1025 BRA) + Pisum sativum as an internal reference standard (mean sample 1C-value = 7·53 pg; peak ratio, 1·698; CVs, 2·28 and 2·09 %). Nuclei of the analysed species and internal standard were isolated, stained with propidium iodide and measured simultaneously.
Table 1 gives ploidy level(s), putative genomic constitution(s) of intermediate (hybridogenous) species and inferred monoploid genome size(s), mean values with standard errors and ranges for 2C and 1Cx genome sizes (expressed in DNA picograms), proportion of AT base pairs and the number of analysed accessions for 60 cytotypes belonging to 24 species (both basic and intermediate) and nine recent hybrids (both natural and experimental). The 2C-values ranged from 3·53 pg in diploid H. hoppeanum to 15·30 pg in octoploid H. brachiatum, representing an approx. 4·3-fold difference. The 1Cx-values (monoploid genome size, in polyploids averaged) varied from 1·72 pg (in 4x and 5x cytotypes of H. pilosella) to 2·16 pg (in 2x and 3x cytotypes of H. echioides), a 1·26-fold difference. At a particular ploidy level, the Cx-value divergence ranged from 8 % in hexaploids to 24 % in tetraploids (Fig. 2). In multiploid species, there was usually a more or less proportional increase in nuclear DNA content with increasing ploidy. Genome downsizing exceeding a 2 % threshold between two successive cytotypes was observed in five cases, namely 4x/5x cytotypes of H. aurantiacum (2·6 %), 4x/5x and 5x/6x cytotypes of H. bauhinii (3·0 and 5·8 %, respectively), 2x/4x cytotypes of H. cymosum (4·5 %) and 4x/5x cytotypes of H. piloselliflorum (4·4 %). The opposite phenomenon occurred only in H. bauhinii, in which a single analysed 7x plant possessed an approx. 4·2 % larger monoploid genome size than its 6x counterparts.
Fig. 2.

2C-value variation in 46 cytotypes belonging to 24 species of Hieracium sub-genus Pilosella. Arrows indicate basic (non-hybridogenous) species.
Variation in C-values at tetraploid to hexaploid levels was more or less continuous, and no gap allowing clear cytotype separation was found (Fig. 2); pentaploids in H. echioides had slightly larger amounts of nuclear DNA than hexaploid individuals of H. pilosella. Extreme C-values (both minima and maxima) per ploidy level always referred to basic species, whereas genome sizes of their hybridogenous counterparts were intermediate. Out of 46 cytotypes belonging to established natural species, only six (=13 %) possessed unique C-values (Table 1). Nevertheless, significant between-species differences were detected in the majority of hybridogenous lineages (two basic species interconnected by one or more intermediate species), indicating that genome size may be used as a supportive taxonomic marker. Representative examples are taxonomically intricate species complexes H. pilosella–H. brachiatum–H. leptophyton–H. bauhinii and H. pilosella–H. piloselliflorum–H. iseranum–H. floribundum. Relationships among investigated species inferred from their phenotypes together with corresponding Cx-values for individual ploidy levels are presented in Fig. 3. Once again, there is an obvious trend in decreasing monoploid genome sizes from marginal basic species through intermediate species towards the central H. pilosella, which has the smallest genome and plays a pivotal role in the genesis of numerous hybridogenous taxa.
Fig. 3.
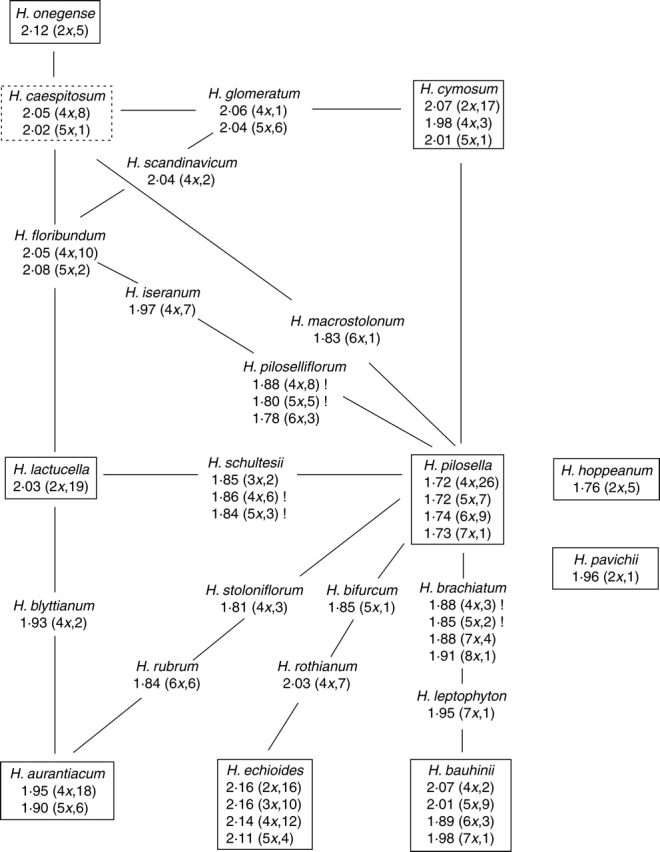
Evolutionary relationships among the studied Hieracium sub-genus Pilosella species inferred from their phenotypes (according to Schuhwerk and Fischer, 2003; corrected) together with corresponding Cx-values (in DNA picograms). The number of plants analysed for each ploidy level is given in parentheses. Basic species are displayed in solid boxes, intermediate species on interconnecting lines; dashed box denotes uncertain species classification. Exclamation marks indicate intraspecific variation in genome size (>3·5 %). The central taxon, H. pilosella, possesses the smallest genome.
Most species showed little intraspecific variation in genome size per ploidy level, not exceeding 3·5%. Exceptions included 4x and 5x cytotypes of H. brachiatum, H. piloselliflorum and H. schultesii. Interestingly, all species were of hybridogenous origin and closely related to H. pilosella (see Fig. 3). The genome size heterogeneity was independently confirmed in simultaneous FCM analyses, which yielded two distinct peaks (Fig. 4).
Fig. 4.

Flow cytometric histogram documenting intraspecific variation in genome size between two tetraploid accessions of H. brachiatum (BRA 642 and BRA 495). Peak ratio 1 : 1·040; CV 1·25 and 1·02 %, respectively. Nuclei of both accessions were isolated, stained with DAPI and analysed simultaneously.
Estimated Cx-values in hybridogenous taxa and recent, both natural and experimental, crosses (37 cytotypes) were compared with theoretical genome sizes inferred from putative parental composition (if more alternatives were available, the nearest value was considered). In most cases, there was good congruence between both data sets (absolute differences <3 %), with only one species passing this threshold (H. rothianum – absolute difference 5·2 %, actual Cx-values higher). The number of cytotypes in which theoretical Cx-values were underestimated (16) matched the number of overestimated counterparts (16); identical values were observed in five cases. Nevertheless, a group of cytotypes with higher actual DNA values showed a more obvious discrepancy (mean absolute divergence 1·9 %) than cytotypes in which actual DNA values were lower than the theoretical amounts (mean absolute divergence 0·9 %); both data sets were significantly different (P < 0·01, n = 32). The level of congruence between Cx-values of recent crosses, either natural or experimental, and established hybridogenous species was highly comparable (mean absolute divergences 1·3 and 1·4 %, respectively). The Cx-values of experimental F1 hybrids corresponded well to DNA values estimated in established natural species of the same putative parentage.
Low variation among analysed species was observed in base pair ratios, with AT proportions ranging from 59·1 to 59·8 % (Table 1), which was of no value for taxonomic purposes. Nevertheless, diploids possessed significantly higher (P < 0·001, n = 11) AT ratios (59·6–59·8 %) than their polyploid counterparts (59·1–59·5 %).
DISCUSSION
Interspecific variation in genome size and base composition
Hawkweed taxa involved in the present study differed 4·33-fold in holoploid genome sizes (2C = 3·53–15·30 pg). This range is higher than ‘average’ infrageneric variation (mean and median values 3·28 and 1·72, respectively) calculated for 434 genera with two or more species included in the Plant DNA C-values database (Bennett and Leitch, 2005). Clearly, the divergence in Hieracium sub-genus Pilosella C-values was primarily driven by considerable ploidy variation (2x–8x) in this group. As a whole, genome sizes of Hieracium sub-genus Pilosella (mean 2C-value 8·76 pg, median 8·56 pg) may be considered typical for Asteraceae (mean 2C-value 9·46 pg, median 7·06 pg).
More than 88 % of our nuclear DNA values represent prime estimates. Previously, only 11 genome sizes for eight hawkweed species (nine cytotypes) had been gathered (Bennett and Leitch, 2005); all but two were determined using flow cytometry and accompanied by chromosome counts [originally measured in relative terms by Bräutigam and Bräutigam (1996) and later converted into absolute units by Bennett et al. (2000)]. Genome sizes for seven cytotypes in common indicated that there was a good agreement between the data sets. The estimates of Bräutigam and Bräutigam were routinely smaller (by 12 % on average), perhaps due to different protocols and/or non-identical reference standards, but the species order with respect to genome size as well as relative between-species differences showed a high level of congruence. The original 1C-value = 1·08 pg determined for H. piloselloides by Feulgen densitometry (K. Bachmann and co-workers, 1975, pers. comm.; Bennett and Leitch, 2005) is suspicious and should be discarded [compare 1C = 3·68 pg calculated for a tetraploid cytotype of this species by Bennett et al. (2000), on the basis of FCM data of Bräutigam and Bräutigam (1996)].
Variation in nuclear DNA C-values in established (both basic and hybridogenous) species was more or less continuous (Fig. 2), especially at tetraploid to hexaploid levels. Differences between two successive C-values exceeding a 10 % threshold were encountered in no more than four cases, and the 5 % threshold was passed in another five cases only. The major discontinuity, amounting to 28·5 %, occurred between diploid and triploid cytotypes (Fig. 2). Small differences in nuclear DNA amounts indicate that FCM alone may not always facilitate reliable ploidy level determination, as well documented by pentaploid H. echioides and hexaploid H. pilosella with reverse 2C-values (Table 1). To guarantee the accuracy of ploidy estimates, FCM data should be calibrated using a karyologically confirmed plant of the same species and ideally accompanied by chromosome counts.
Monoploid genome sizes (or 1Cx-values) varied 1·26-fold from 1·72 pg in H. pilosella to 2·16 pg in H. echioides. Once again, this variation was more or less continuous. Slightly separated from the bulk of species were the taxa with the smallest (H. pilosella and H. hoppeanum) and the largest (H. onegense and H. echioides) Cx-values. The species with the largest Cx-values are unrelated, but H. pilosella and H. hoppeanum belong to section Pilosellina, which may possibly be defined by low monoploid genome sizes. Taxa from section Pilosellina were also clearly segregated from H. onegense and H. echioides in molecular phylogenetic trees based on nuclear and plastid data (Fehrer et al., 2007a).
Intraspecific genome size variation
The majority of wild cytotypes/species with multiple accessions possessed constant nuclear DNA amounts (variation in fluorescence intensity <3·5 %). Whereas this applied routinely to basic species, genome size divergence beyond artefactual fluctuation was observed in six cytotypes belonging to three intermediate species (H. brachiatum, up to 6·1 %; H. piloselliflorum, up to 7·4 %; and H. schultesii, up to 5·7 % variation). Along with the hybridogenous origin of these taxa, another feature in common was a close affinity for H. pilosella (Fig. 3). Two other species closely related to H. pilosella (H. bifurcum and H. macrostolonum) were each represented by a single accession only, and thus any intraspecific divergence in nuclear DNA amount remains to be determined for these species. Genome size variation in H. brachiatum, H. piloselliflorum and H. schultesii was coupled with a conspicuous diversity in several other characters such as morphology, breeding systems, isozyme phenotypes and plastid DNA haplotypes (Krahulec et al., 2004; Fehrer et al., 2005, 2007b). These results indicate that the intermediate species surrounding H. pilosella most probably encompass several biotypes with different evolutionary history (they were formed recurrently from different populations of parental taxa, and are possibly undergoing backcrossing with sexual H. pilosella). Consequently, a complex hybrid group will arise, with particular plants differing in the proportion of parental genomes, and thus in genome size, but phenotypically all belonging to the same hybridogenous taxon; further splitting that would reflect the actual genome composition is not possible unless molecular markers are employed. Nonetheless, it is obvious that genome size, as determined by flow cytometry, may be used as an indication of evolutionary history and a helpful character for taxonomic decision making in moot cases (e.g. when backcrossing is suspected).
Higher levels of intraspecific genome size variation (up to 9·9 %) were found among offspring of F1 experimental crosses of H. rubrum (6x) and H. pilosella (4x). In these particular cases, aneuploidy was largely responsible for the observed pattern. Out of 27 pentaploid hybrids in which chromosomes were counted, 14 were euploid (2n = 45), two hyperaneuploid (2n = 46) and 11 hypoaneuploid (2n = 43–44, including three somatic mosaics such as 41/42/43). If only euploid individuals were considered, intracytotype variation shrank from 9·1 to 1·7%. No karyological data are yet available for triploid offspring (i.e. trihaploids of H. rubrum), but it is assumed that a difference in chromosome number is the cause of genome size variation.
Although numerous early reports of genome size variation below species level were dismissed by subsequent investigations using the best practice methodology (Greilhuber, 2005), we are convinced that the divergence observed in selected Hieracium sub-genus Pilosella taxa is genuine. Low CVs were always achieved, disproving a potential effect of inhibitory secondary metabolites. In addition, highly comparable DNA estimates were obtained when the same plant was re-analysed in different years. Finally, joint runs of both DAPI- and PI-stained samples with different genome sizes yielded two distinct peaks or, at least, a bifurcated peak (Fig. 4). As argued by Greilhuber et al. (2007), the appearance of separate peaks in simultaneous analysis is the most straightforward evidence for true differences in the amount of nuclear DNA.
Genome size as a supportive taxonomic marker
Recent years have seen numerous attempts to gain deeper insights into the organization of diversity in Hieracium sub-genus Pilosella, including reliable species delineation. These investigations have been coupled with an increase in data for molecular, reproductive, karyological and morphological traits on which taxonomic concepts can be evaluated (Krahulcová et al., 2001, 2004; Fehrer et al., 2005, 2007a, b; Peckert et al., 2005). Although genome size has been repeatedly found to be a useful taxonomic marker at various ranks and in various plant groups (e.g. Dimitrova et al., 1999; Zonneveld, 2001; Jeschke et al., 2003; Mahelka et al., 2005; Suda et al., 2007), it has been largely neglected in hawkweeds. Pioneering FCM assays by Bräutigam and Bräutigam (1996) did not find immediate favour with researchers, although these authors first documented nearly intermediate fluorescence intensities of two hybridogenous species (H. brachiatum = H. pilosella > H. piloselloides and H. leptophyton = H. pilosella < H. bauhinii) with respect to their putative parents. Only recently, Morgan-Richards et al. (2004) took advantage of the small monoploid genome size in H. pilosella, inferring the genome composition in natural H. pilosella × H. prealtum hybrids in New Zealand.
In this study, the usefulness of genome size as a supportive marker for species circumscription and inferring evolutionary relationships based on a representative set of primarily Central European hawkweeds was assessed. Of basic species native to Central Europe (Gottschlich, 1987), only H. alpicola (occurring in the Alps and the Carpathians), H. angustifolium (occurring in the Alps), H. peletierianum (occurring rarely in the western part of Central Europe) and H. piloselloides were not included. Special attention was paid to hybridogenous species closely related to H. pilosella. This taxon is particularly liable to interspecific hybridization, giving rise to both primary crosses with more or less intermediate phenotypes between putative parents and backcrosses, the positions of which are not strictly intermediate (Schuhwerk and Fischer, 2003; Krahulec et al., 2004). Such plants then blur between-species boundaries, and their taxonomic status can often not be determined with certainty.
Despite only a few species/cytotype-specific genome sizes being detected (2x H. hoppeanum, 6x H. bauhinii and 7x H. pilosella among basic species, and 3x H. schultesii and 7x + 8x H. brachiatum among intermediate species), nuclear DNA content can nevertheless guide taxonomic decisions in several species alliances with morphological similarities. In total, nine hybrid lineages (two basic species connected with one or more established hybridogenous taxa) were surveyed (Fig. 3), six of which involved H. pilosella. All these six lineages showed a remarkably uniform pattern of interspecific genome size variation, with monoploid genome sizes gradually increasing from H. pilosella through stabilized hybrid(s) to the second putative parental taxon, and, if more hybridogenous taxa were involved, those closely related to H. pilosella invariably possessed smaller genomes than their more distant counterparts (Fig. 3). In addition, except for 7x cytotypes of H. leptophyton and H. bauhinii, and, to a lesser extent, 6x cytotypes of H. pilosella and H. piloselliflorum, all other plants forming a particular hybrid lineage had significantly different genome sizes (Table 1). This finding clearly documents the usefulness of genome size as a supportive marker for identification of several of the most problematic hawkweed species, perhaps even in the vegetative (non-flowering) state. The possibility of being able to assess the relative proportion of H. pilosella in genomes of different hybridogenous species, based on FCM estimates of nuclear DNA content, may have important taxonomic and evolutionary implications (e.g. more reliable inference of among-species relationships and classification of borderline morphotypes). Unlike lineages involving the small-genome H. pilosella, three other hybridogenous lineages with different parental combinations showed little discontinuity in nuclear DNA content, and C-values of the respective intermediate taxa (H. blyttianum, H. floribundum and H. glomeratum) overlapped with one or both putative parents (of the same ploidy level).
Genome size in hybridogenous species and recent crosses: actual vs. theoretical values
Monoploid genome sizes estimated for 14 established hybridogenous species (23 cytotypes) were highly comparable with theoretical DNA values inferred from their putative genome constitution (average absolute difference 1·4 %). Out of 23 cytotypes, 19 and ten showed absolute divergences below 2 and 1 %, respectively, indicating the predictive value of genome size data. However, it should be noted that the actual origin of intermediate species/cytotypes (i.e. whether a simple hybrid or a backcross and/or whether reduced or unreduced gametes were involved) is often difficult, if not impossible, to determine with certainty. Two or more alternative pathways, compatible with plant phenotypes, were therefore proposed for more than half of hybridogenous cytotypes in the species set (see, for example, high polyploids of H. brachiatum and H. piloselliflorum in Table 1). Only straightforward evolutionary scenarios were considered, for the sake of simplicity, although some studies showed that this is not always the case (e.g. Krahulcová et al., 2000). Naturally, complex evolutionary history can have important consequences on genome size and perhaps may elucidate the discrepancy between theoretical and actual Cx-values observed in H. rothianum (H. echioides > H. pilosella). In addition, it is possible that genome down-sizing observed in polyploid cytotypes of some species may, at least partly, be caused by ‘hidden’ backcrossing with a phenotypically similar taxon with a smaller genome size; polyploids of H. bauhinii (influenced by H. brachiatum) and H. piloselliflorum (influenced by H. pilosella) are among the potential candidates.
The parentage of natural crosses is usually easier to infer because such recent hybrids generally co-occur with putative parental species at the same locality (unlike established hybridogenous taxa that often have their own distribution ranges). On this account and also because of their short evolutionary history, it is perhaps not surprising that recent crosses showed even higher conformity between theoretical and actual genome sizes (mean absolute divergence only 0·9 %) than established hybridogenous taxa. In contrast, mean absolute divergence in F1 experimental hybrids (1·5 %, aneuploids excluded) was comparable with the values observed in established natural taxa, despite their parental combination being known explicitly.
Do established hybridogenous species differ in genome size from recent crosses of the same parental combination?
Because genome size data of established hybridogenous taxa were supplemented by DNA values of recent experimental F1 crosses, investigations were possible into potential changes in nuclear DNA content following hybridization. Despite the rather small sample size, remarkable conformity was found between Cx-values of recent hybrids and established hybridogenous taxa of the same parentage (Table 1). This indicates the apparent lack of processes altering nuclear DNA amount (e.g. extensive DNA loss or gain; Bennetzen et al., 2005) in the evolutionary history of selected hawkweed species. The knowledge that the genome size of hybrids is (virtually) not subject to post-hybridization changes and accurately reflects nuclear DNA values of parental taxa is of importance in reliable interpretation of species relationships and opens up new perspectives for better understanding of microevolutionary processes that shape the organization of the diversity in the sub-genus Pilosella. Collectively, the present results document the usefulness of FCM for resolving taxonomic complexities in hybridogenous plant groups, and an increasing use of this technique in the study of hybrid speciation is anticipated.
SUPPLEMENTARY INFORMATION
Supplementary information is available online at http://aob.oxfordjournals.org giving details of sample localities together with chromosome numbers and breeding systems of the species analysed.
ACKNOWLEDGEMENTS
We are indebted to all colleagues who collected plant samples and revised the Hieracium material (see Supplementary Information), F. Schuhwerk and S. Bräutigam in particular. This study was supported by the Grant Agency of the Charles University (149/2002/B-BIO/PřF to J.S.) and partly by the Czech Science Foundation (grant no. 206/07/0059 to A.K.), Ministry of Education, Youth and Sports of the Czech Republic (MSM 0021620828), and Academy of Sciences of the Czech Republic (AV0Z60050516).
LITERATURE CITED
- Barow M, Meister A. Lack of correlation between AT frequency and genome size in higher plants and the effect of nonrandomness of base sequences on dye binding. Cytometry. 2002;47:1–7. doi: 10.1002/cyto.10030. [DOI] [PubMed] [Google Scholar]
- Bennett MD, Leitch IJ. Plant DNA C-values Database (release 4·0, October 2005) 2005. [Accessed 19 February 2007]. http://www.kew.org/cval/homepage.html .
- Bennett MD, Bhandol P, Leitch IJ. Nuclear DNA amounts in angiosperms and their modern uses – 807 new estimates. Annals of Botany. 2000;86:859–909. [Google Scholar]
- Bennetzen J, Ma J, Devos KM. Mechanisms of recent genome size variation in flowering plants. Annals of Botany. 2005;95:127–132. doi: 10.1093/aob/mci008. [DOI] [PMC free article] [PubMed] [Google Scholar]
- Bicknell RA, Lambie SC, Butler RC. Quantification of progeny classes in two facultatively apomictic accessions of Hieracium. Hereditas. 2003;138:11–20. doi: 10.1034/j.1601-5223.2003.01624.x. [DOI] [PubMed] [Google Scholar]
- Bottini MCJ, Greizerstein EJ, Aulicino MB, Poggio L. Relationships among genome size, environmental conditions and geographical distribution in natural populations of NW Patagonian species of Berberis L. (Berberidaceae) Annals of Botany. 2000;86:565–573. [Google Scholar]
- Bräutigam S, Bräutigam E. Determination of the ploidy level in the genus Hieracium subgenus Pilosella (Hill) S.F. Gray by flow cytometric DNA analysis. Folia Geobotanica et Phytotaxonomica. 1996;31:315–321. [Google Scholar]
- Chapman H, Lambie S. Stace CA, editor. [Reports] International Organization of Plant Biosystematics Newsletter. 1999;31:12. IOPB chromosome data 15. [Google Scholar]
- Chapman H, Houliston GJ, Robson B, Illine I. A case of reversal: the evolution and maintenance of sexuals from parthenogenetic clones in Hieracium pilosella. International Journal of Plant Sciences. 2003;164:719–728. [Google Scholar]
- Dimitrova D, Ebert I, Greilhuber J, Kozhuharov S. Karyotype constancy and genome size variation in Bulgarian Crepis foetida s.l. (Asteraceae) Plant Systematics and Evolution. 1999;217:245–257. [Google Scholar]
- Fehrer J, Šimek R, Krahulcová A, Krahulec F, Chrtek J, Bräutigam E, Bräutigam S. Evolution, hybridization, and clonal distribution of apo- and amphimictic species of Hieracium L. subgen. Pilosella (Hill) Gray in a Central European mountain range. In: Bakker FT, Chatrou LW, Gravendeel B, Pelser PB, editors. Plant species-level systematics: patterns, processes and new applications. Königstein, Koeltz: Regnum Vegetabile; 2005. pp. 175–201. [Google Scholar]
- Fehrer J, Gemeinholzer B, Chrtek J, Jr, Bräutigam S. Incongruent plastid and nuclear DNA phylogenies reveal ancient intergeneric hybridization in Pilosella hawkweeds (Hieracium, Cichorieae, Asteraceae) Molecular Phylogenetics and Evolution. 2007;a 42:347–361. doi: 10.1016/j.ympev.2006.07.004. [DOI] [PubMed] [Google Scholar]
- Fehrer J, Krahulcová A, Krahulec F, Chrtek J, Jr, Rosenbaumová R, Bräutigam S. Evolutionary aspects in Hieracium subgenus Pilosella. In: Grossniklaus U, Hörandl E, Sharbel T, van Dijk P, editors. Apomixis: Evolution, Mechanisms and Perspectives. b. Königstein, Koeltz: Regnum Vegetabile; 2007. pp. 359–390. [Google Scholar]
- Gadella TWJ. Sexual tetraploid and apomictic pentaploid populations of Hieracium pilosella (Compositae) Plant Systematics and Evolution. 1987;157:219–246. [Google Scholar]
- Gadella TWJ. Some notes on the origin of polyploidy in Hieracium pilosella aggr. Acta Botanica Neerlandica. 1988;37:515–522. [Google Scholar]
- Gadella TWJ. Variation, hybridization and reproductive biology of Hieracium pilosella L. Proceedings of the Koninklijke Nederlandse Akademie van Wetenschappen. 1991;a 94:455–488. [Google Scholar]
- Gadella TWJ. Reproduction, variation and interspecific hybridization in three species of Hieracium section Pilosellina (Compositae) Polish Botanical Studies. 1991;b 2:85–103. [Google Scholar]
- Godelle B, Cartier D, Marie D, Brown SC, Siljak-Yakovlev S. Heterochromatin study demonstrating the non-linearity of fluorimetry useful for calculating genomic base composition. Cytometry. 1993;14:618–626. doi: 10.1002/cyto.990140606. [DOI] [PubMed] [Google Scholar]
- Gottschlich G. Hieracium L. In: Hegi G, Wagenitz G, editors. Illustrierte Flora von Mitteleuropa VI/2. Berlin: Verlag P. Parey; 1987. pp. 1437–1452. [Google Scholar]
- Greilhuber J. Intraspecific variation in genome size in angiosperms: identifying its existence. Annals of Botany. 2005;95:91–98. doi: 10.1093/aob/mci004. [DOI] [PMC free article] [PubMed] [Google Scholar]
- Greilhuber J, Doležel J, Lysák MA, Bennett MD. The origin, evolution and proposed stabilization of the terms ‘genome size’ and ‘C-value’ to describe nuclear DNA contents. Annals of Botany. 2005;95:255–260. doi: 10.1093/aob/mci019. [DOI] [PMC free article] [PubMed] [Google Scholar]
- Greilhuber J, Temsch EM, Loureiro JCM. Nuclear DNA content measurement. In: Doležel J, Greilhuber J, Suda J, editors. Flow cytometry with plant cells: analysis of genes, chromosomes and genomes. Weinheim: Wiley-VCH; 2007. pp. 67–101. [Google Scholar]
- Grime JP, Shacklock JML, Band SR. Nuclear DNA contents, shoot phenology and species co-existence in a limestone grassland community. New Phytologist. 1985;100:434–445. [Google Scholar]
- Hegarty MJ, Hiscock SJ. Hybrid speciation in plants: new insights from molecular studies. New Phytologist. 2005;165:411–423. doi: 10.1111/j.1469-8137.2004.01253.x. [DOI] [PubMed] [Google Scholar]
- Jenkins TA, Jong K. Significance of polyploid variation in New Zealand Pilosella and Hieracium (Asteraceae) Botanical Journal of Scotland. 1997;49:75–87. [Google Scholar]
- Jeschke MR, Tranel PJ, Rayburn AL. DNA content analysis of smooth pigweed (Amaranthus hybridus) and tall waterhemp (A. tuberculatus): implications for hybrid detection. Weed Science. 2003;51:1–3. [Google Scholar]
- Koltunow AM, Johnson SD, Bicknell RA. Sexual and apomictic development in Hieracium. Sexual Plant Reproduction. 1998;11:213–230. [Google Scholar]
- Krahulcová A, Krahulec F. Chromosome numbers and reproductive systems in selected representatives of Hieracium subgen. Pilosella in the Krkonoše Mts (the Sudeten Mts) Preslia. 1999;71:217–234. [Google Scholar]
- Krahulcová A, Krahulec F. Offspring diversity in Hieracium subgen. Pilosella (Asteraceae): new cytotypes from hybridization experiments and from open pollination. Fragmenta Floristica et Geobotanica. 2000;45:239–255. [Google Scholar]
- Krahulcová A, Krahulec F, Chapman HM. Variation in Hieracium subgen Pilosella (Asteraceae): what do we know about its sources? Folia Geobotanica. 2000;35:319–338. [Google Scholar]
- Krahulcová A, Krahulec F, Chrtek J., Jr Chromosome numbers and reproductive systems in selected representatives of Hieracium subgen. Pilosella in the Krkonoše Mts (the Sudeten Mts) – 2. Preslia. 2001;73:193–211. [Google Scholar]
- Krahulcová A, Papoušková S, Krahulec F. Reproduction mode in the allopolyploid facultatively apomictic hawkweed Hieracium rubrum (Asteraceae, H. subgen. Pilosella) Hereditas. 2004;141:19–30. doi: 10.1111/j.1601-5223.2004.01845.x. [DOI] [PubMed] [Google Scholar]
- Krahulec F, Krahulcová A. Population based approaches in the study of Pilosella Hill (Asteraceae): a new view of its taxonomy? In: Bailey J, Ellis RG, editors. Current taxonomic research on the British & European flora. London: BSBI; 2006. pp. 15–25. [Google Scholar]
- Krahulec F, Krahulcová A, Fehrer J, Bräutigam S, Plačková I, Chrtek J., Jr The Sudetic group of Hieracium subgen. Pilosella from the Krkonoše Mts: a synthetic view. Preslia. 2004;76:223–243. [Google Scholar]
- Krahulec F, Krahulcová A, Papoušková S. Ploidy level selection during germination and early stage of seedling growth in the progeny of allohexaploid facultative apomict, Hieracium rubrum (Asteraceae) Folia Geobotanica. 2006;41:407–416. [Google Scholar]
- Leitch IJ, Bennett MD. Genome size and its uses: the impact of flow cytometry. In: Doležel J, Greilhuber J, Suda J, editors. Flow cytometry with plant cells: analysis of genes, chromosomes and genomes. Weinheim: Wiley-VCH; 2007. pp. 153–176. [Google Scholar]
- Lysák MA, Doležel J. Estimation of nuclear DNA content in Sesleria (Poaceae) Caryologia. 1998;51:123–132. [Google Scholar]
- Lysák MA, Doleželová M, Horry JP, Swennen R, Doležel J. Flow cytometric analysis of nuclear DNA content in Musa. Theoretical and Applied Genetics. 1999;98:1344–1350. [Google Scholar]
- MacGillivray CW, Grime JP. Genome size predicts frost-resistance in British herbaceous plants – implications for rates of vegetation response to global warming. Functional Ecology. 1995;9:320–325. [Google Scholar]
- Mahelka V, Suda J, Jarolímová V, Trávníček P, Krahulec F. Genome size discriminates between closely related taxa Elytrigia repens and E. intermedia (Poaceae: Triticeae) and their hybrid. Folia Geobotanica. 2005;40:367–384. [Google Scholar]
- Matzk F, Hammer K, Schubert I. Coevolution of apomixis and genome size within the genus Hypericum. Sexual Plant Reproduction. 2003;16:51–58. [Google Scholar]
- Mishiba KI, Ando T, Mii M, Watanabe H, Kokubun H, Hashimoto G, Marchesi E. Nuclear DNA content as an index character discriminating taxa in the genus Petunia sensu Jussieu (Solanaceae) Annals of Botany. 2000;85:665–673. [Google Scholar]
- Morgan-Richards M, Trewick SA, Chapman HM, Krahulcová A. Interspecific hybridization among Hieracium species in New Zealand: evidence from flow cytometry. Heredity. 2004;93:34–42. doi: 10.1038/sj.hdy.6800476. [DOI] [PubMed] [Google Scholar]
- Nägeli C, Peter A. Die Hieracien Mittel-Europas. Monographische Bearbeitung der Piloselloiden mit besonderer Berücksichtigung der mitteleuropäischen Sippen. Munich: R. Olderburg; 1885. [Google Scholar]
- Otto F. DAPI staining of fixed cells for high-resolution flow cytometry of nuclear DNA. Methods in Cell Biology. 1990;33:105–110. doi: 10.1016/s0091-679x(08)60516-6. [DOI] [PubMed] [Google Scholar]
- Peckert T, Chrtek J. Mating interactions between coexisting diploid, triploid and tetraploid cytotypes of Hieracium echioides (Asteraceae) Folia Geobotanica. 2006;41:323–334. [Google Scholar]
- Peckert T, Chrtek J, Plačková I. Genetic variation in agamospermous populations of Hieracium echioides in southern Slovakia and northern Hungary (Danube Basin) Preslia. 2005;77:307–315. [Google Scholar]
- Rotreklová O. Hieracium bauhinii group in Central Europe: chromosome numbers and breeding systems. Preslia. 2004;76:313–330. [Google Scholar]
- Rotreklová O, Krahulcová A, Vaňková D, Peckert T, Mráz P. Chromosome numbers and breeding systems in some species of Hieracium subgen. Pilosella from Central Europe. Preslia. 2002;74:27–44. [Google Scholar]
- Rotreklová O, Krahulcová A, Mráz P, Mrázová V, Mártonfiová L, Peckert T, Šingliarová B. Chromosome numbers and breeding systems in some species of Hieracium subgen Pilosella from Europe. Preslia. 2005;77:177–195. [Google Scholar]
- Schuhwerk F. Published chromosome counts in Hieracium. 1996. [(Accessed 19 February 2007]. http://www.botanik.biologie.uni-muenchen.de/botsamml/projects/chrzlit.html .
- Schuhwerk F, Fischer MA. Bestimmungsschlüssel der Untergattung Hieracium subg. Pilosella in Österreich und Südtirol. Neilreichia. 2003;2–3:13–58. [Google Scholar]
- Schuhwerk F, Lippert W. Chromosomenzahlen von Hieracium (Compositae, Lactuceae) Teil 1. Sendtnera. 1997;4:181–206. [Google Scholar]
- Schuhwerk F, Lippert W. Chromosomenzahlen von Hieracium (Compositae, Lactuceae) Teil 4. Sendtnera. 2002;8:167–194. [Google Scholar]
- Suda J, Kron P, Husband BC, Trávníček P. Flow cytometry and ploidy: applications in plant systematics, ecology and evolutionary biology. In: Doležel J, Greilhuber J, Suda J, editors. Flow cytometry with plant cells: analysis of genes, chromosomes and genomes. Weinheim: Wiley-VCH; 2007. pp. 103–130. [Google Scholar]
- Vladimirov V, Szeląg Z. Chromosome numbers in selected species of Hieracium subgenus Pilosella (Asteraceae) from Bulgaria. Polish Botanical Journal. 2001;46:269–273. [Google Scholar]
- Zahn KH. In: Synopsis der mitteleuropäischen Flora 12 (1). Ascherson P, Graebner P, editors. Leipzig: Gebrüder Borntraeger; Hieracium. 1922–1930. [Google Scholar]
- Záveský L, Jarolímová V, Štěpánek J. Nuclear DNA content variation within the genus Taraxacum (Asteraceae) Folia Geobotanica. 2005;40:91–104. [Google Scholar]
- Zonneveld BJM. Nuclear DNA contents of all species of Helleborus (Ranunculaceae) discriminate between species and sectional divisions. Plant Systematics and Evolution. 2001;229:125–130. [Google Scholar]