Abstract
Purpose
To demonstrate the feasibility of acquiring high resolution, isotropic 3D-sodium MR images of the whole knee joint in vivo at ultra high field strength (7.0T) via a 3D-radial acquisition with ultra short echo times and clinically acceptable acquisition times.
Materials and Methods
Five healthy controls (4 males, 1 female; mean ± standard deviation (SD) age 28.7 ± 4.8 years) and five patients with osteoarthritis (OA) (3 males, 2 females; mean ± SD age 52.4 ± 5.6 years) underwent 23Na–MRI on a 7T, multi-nuclei equipped whole body scanner. A quadrature 23Na knee coil and a 3D-gradient echo (GRE) imaging sequence with a radial acquisition were utilized. Cartilage sodium concentration was measured and compared between the healthy controls and OA patients.
Results
The average signal-to-noise ratio (SNR) for different spatial resolutions (1.2 mm – 4 mm) varied from ∼14 – 120, respectively. The mean sodium concentration of healthy subjects ranged from ∼240 ± 28 mM/L – 280 ± 22 mM/L. However, in OA patients the sodium concentrations were reduced, significantly by ∼30 – 60%, depending upon the degree of cartilage degeneration.
Conclusion
The preliminary results suggest that sodium imaging at 7T may be a feasible potential alternative for physiologic OA imaging and clinical diagnosis.
Keywords: sodium, MRI, arthritis, cartilage
Introduction
The loss of proteoglycan (PG) is an initiating event in the osteoarthritic cascade. This is then followed by microscopic changes in collagen and later by morphologic changes in cartilage and adjacent medullary and cortical bone (1-5). State-of-the-art MR techniques for studying pre-morphologic osteoarthritis (OA) include the application of proton imaging with exogenous contrast agents (6, 7), T1rho relaxation mapping (3), T2 mapping (7), and chemical exchange saturation transfer (gagCEST) (8). Sodium MRI is an alternative method that takes advantage of the fact that PGs are negatively charged molecules, and it is possible to measure PG changes in cartilage both in-vivo and in-vitro (5, 9-19). In normal cartilage, because of the fixed charged density (FCD), [Na] is proportional to the [PG], thus a decrease in PG content during the early stages of OA would result in lower [Na] (9). By monitoring the sodium concentration in tissues via sodium MR imaging, the integrity of the cartilage tissue can be analyzed in vivo, which in turn can provide a noninvasive means of OA diagnosis and disease evaluation (10).
The in vivo 23Na NMR signal is ∼22,000 times smaller than that of 1H (including the differences in concentration), therefore the resultant low signal to noise ratio (SNR) can make it technically difficult to achieve clinically tolerable scan times (20-23). A part pf the SNR can be regained by using very short TR times due to the very short T1 of sodium. The advantages of sodium MRI have been described by previous investigations (5, 10, 12), which have demonstrated the sensitivity and specificity of sodium for detecting small variations in PG content compared to proton density and 1H-T1, T2 relaxation contrast.
Both spin-lattice (T1) and spin-spin (T2) relaxation are biexponential for the 23Na spin. In order to detect both T2 components in tissue, as well as to accurately quantitate the total sodium concentration, ultrashort echo-time (UTE) imaging techniques with echo times (TE) on the order of only a few hundred microseconds are required (22). UTE imaging can be performed using a 3D technique that employs a nonselective radio-frequency (RF) excitation with 3D radial free induction decay (FID) sampling to produce image data with isotropic spatial resolution (22, 23). Using this method, the RF excitation is more robust and of shorter duration, and the T2 decay during excitation is minimized. Therefore, tissues with short-T2 signal do not decay significantly during readout, minimizing blurring and loss of signal amplitude.
Previous work in sodium MR imaging of human cartilage has been performed mostly at standard clinical field strength (1.5T/3.0T). Although sodium MRI has been shown to correlate with glycosaminoglycan (GAG) concentration (5, 9, 12, 19), it poses major challenges at clinical magnetic field strengths in terms of low SNR, poor spatial resolution, and long acquisition times due to the low natural abundance of sodium, and rapid bi-exponential T2 signal decay when compared to proton MRI. High and ultra high field systems (4.0T-9.4T) with improved gradient hardware and pulse sequences have potential in improving the spatial-temporal resolution of sodium MRI of the knee in vivo in clinically acceptable scan times. To the best of our knowledge, there have been no related reports of in vivo sodium MR imaging of human cartilage performed at whole body ultra high field MR systems before. Therefore, in the current study, we demonstrate for the first time the feasibility of acquiring high resolution, isotropic 3D-sodium MRI of the whole knee joint in less than 15 minutes at 7T via 3D-radial acquisition with ultra short echo times.
Materials and Methods
Sequence Design
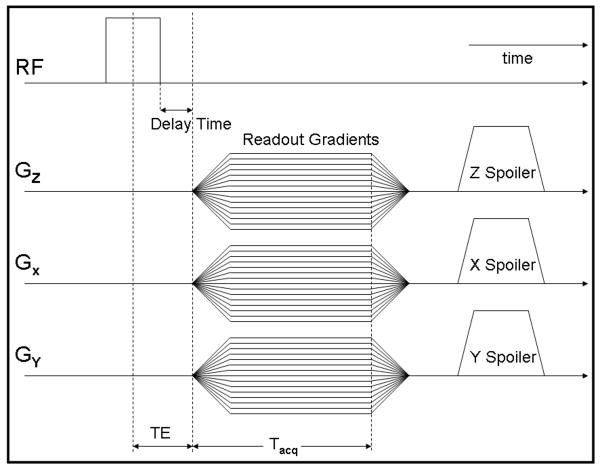
The 23Na-3D radial MRI pulse sequence was implemented on the 7T and 3T whole body scanners both equipped with multi-nuclei options (Siemens Medical Solutions, Erlangen, Germany). The MRI experiments were performed using two different quadrature 23Na knee coils with the same size (∼18 cm in inner diameter) tuned to 32.6 MHz at 3T and 78.6 MHz at 7T, respectively (Rapid MR International, LLC, OH) and a 3D-GRE pulse sequence with radial k-space acquisition was implemented utilizing the manufacturer-provided pulse sequence development environment (IDEA). K-space was filled from the center to the periphery of a sphere, following cones from north to south of the sphere (17, 22, 23). The use of a 3D acquisition technique provides the advantage that the echo time can be reduced further via the use of non-selective RF pulses. In this sequence, a non-selective RF pulse sequence with a duration of 200 μs was used and the signal was sampled during ramp-up of the readout gradient with a delay time of 60 μs (Fig. 1). The resulting effective TE was TE = τRF/2+τDelay = 200/2+60 = 160 μs. The signal was finally spoiled via the use of both RF spoiling (phase cycling) and gradient spoiling in the three directions (x, y, z) with the amplitude of the gradient spoilers aligned in the same direction as the readout gradients (22, 23).
Fig. 1.
3D radial projection sequence timing diagram. After a 200-μs RF pulse and a delay of 60 μs, the signal is sampled during the readout gradient ramp-up time, resulting in an extremely short TE of 160 μs.
For image reconstruction of the radially acquired data set, raw data were regridded online using a gridding algorithm (22) in the standard image reconstruction environment of the scanner (Image Calculation Environment (ICE); Siemens Medical Solutions, Erlangen, Germany). The nonuniform sampling in the radial direction during gradient ramp-up was pre-compensated using a rho-filter (22). After regridding a three-dimensional fast Fourier transform (3D FFT) was applied to the Cartesian raw data to generate the final 3D isotropic data set (22, 23).
Simulations
Computer simulations were conducted to calculate the point spread function (PSF) and signal-to-noise ratio (SNR) as functions of the undersampling factor. Raw projection data were generated in k-space. For PSF calculation, it is 1 from central k-space to outer k-space; for SNR calculation, it is 1 in central k-space and 0 in outer k-space with the white Gaussian noise added to both real and imaginary channels. Then a bi-exponential decay was imposed to every line of the projection data. Density compensation along projections, regridding with Kaiser Bessel kernel, and inverse Fourier transform were applied consecutively to reconstruct the 3D images. Full width at half maximum (FWHM) and SNR were calculated accordingly.
Agarose and Calibration Phantoms
A 4% agarose gel phantom filled with 300 mM//L NaCl was kept at room temperature and was imaged three times with the 3D GRE UTE sequence with radial acquisition on three consecutive days. To compare the signal-to-noise ratio (SNR) variation at clinical field (3T) and ultra high field (7T) strengths, the agarose phantom was scanned at 3T (TE = 160 μs, TR = 40, 70, 100, 125, 150, 200, and 500 ms, and TR = 80 ms, TE = 160, 200, 300, 500, 1000, 3000, and 5000 μs, BW = 130 Hz/pixel, Averages = 2) and at 7T (TE = 160 μs, TR = 51.5, 70, 100, 125, 150, 200, and 500 ms, and TR = 80 ms, TE = 160, 200, 300, 500, 1000, 3000, and 5000 μs, BW = 130 Hz/pixel, Averages = 2), respectively. To assess the B1 inhomogeneity of the sodium coil at 7T, the agarose phantom was scanned with the 3D GRE UTE sequence with radial acquisition using the standard double-flip angle method (24-27) in order to evaluate the distribution of the flip angle at 7T field strength.
Sodium concentration quantitation was performed by simultaneously imaging the in vivo human cartilage with saline/agarose calibration phantoms as described previously (11). These calibration phantoms consisted of 5 small cylindrical test tubes filled with physiological saline doped with 10% agarose at different concentrations of 100, 150, 200, 250, and 300 mM/L.
Human Subjects
Approval for the study was obtained from the local institutional review board (IRB) and informed consent was obtained from all the recruited subjects. Five asymptomatic subjects (4 males, 1 female; mean ± SD age 28.7 ± 4.8 years) and five clinically diagnosed osteoarthritis (OA) subjects (3 males, 2 females; mean ± SD age 52.4 ± 5.6 years), by American College of Rheumatology (ACR) criteria (28), were evaluated. To limit patient motion during acquisitions, the knee was fixed with straps and foam padding.
The sodium MRI data acquisition was performed using a 3D-GRE imaging sequence with radial acquisition (TR/TE = 80 ms/0.160 ms, BW = 130 Hz/pixel, signal averages = 5-10, isotropic voxel dimensions = 1.2, 1.5, 2, 3, 4 mm, radial projections = 512 - 1024; sampling points = 128; acquisition times = ∼3:25 - 13:42 minutes). The five cylindrical calibration phantoms consisting of known sodium concentrations were simultaneously imaged in order to obtain the calibration data to calculate the cartilage [Na] concentration as previously described (9-11). B1 mapping was also performed on two subjects with the 3D GRE-UTE sequence with radial acquisition using the standard double flip angle method at 7T (24-27). Representative proton images from an asymptomatic subject and an OA subject were acquired at 7T as an anatomical reference and cartilage localization for sodium images. Acquisition parameters: 3D-FLASH, fat suppression, TR/TE = 20 ms/4.3 ms, Flip Angle = 100, Averages = 1, Bandwidth = 130 Hz/pixel, thickness = 1 mm, FOV = 100 mm × 100 mm, Matrix = 512 × 512.
Data Analysis and Processing
All the data analysis and processing were performed using the built-in functions of MATLAB (version 7.1, The Mathworks, Natick, MA, USA). For the analysis of sodium concentration of different phantoms, a region of interest (ROI) was manually drawn for each phantom using custom software written in MATLAB. All ROIs were drawn by L.W. and the size of ROIs was based on the actual visible contour of the corresponding cartilage. Sodium concentration in three compartments (patellar cartilage, medial femoral-tibial joint, and lateral femoral-tibial joint) was measured separately in healthy and OA subjects. The previously described double-angle method (24-27) was used to calculate the distribution of the flip angle for the phantom and human imaging at 7T. The measurement for the average SNR of the three cartilage regions of medial and lateral femoral-tibial joint compartments and the patellar cartilage compartment uses the previous method described in Ref. (3). The Student's t-test was calculated to determine the statistical difference in sodium concentration between healthy subjects and OA patients. The coefficients of variation (CVs) characterizing the reproducibility of the three regions of interest measurements were assessed on two healthy controls based on two repeated scans obtained on consecutive weeks.
Results
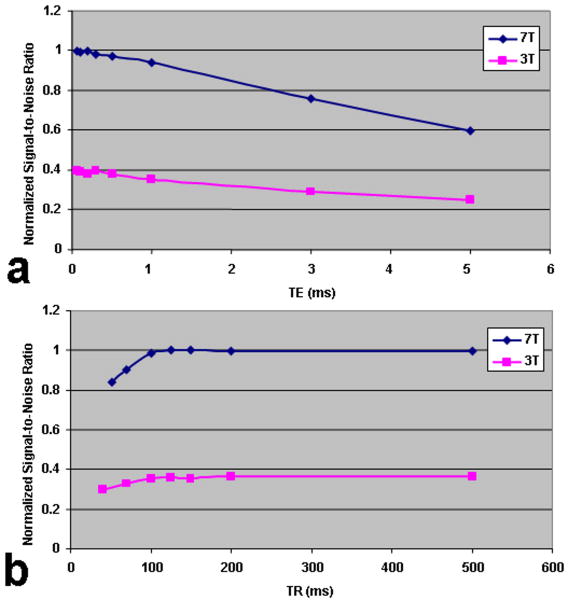
The computed CVs for the three cartilage regions (patellar cartilage, medial-tibial-femoral cartilage and lateral-tibial-femoral cartilage) show good measurement reproducibility (< 4.3%). Sodium MR imaging of the agarose phantoms demonstrates that with a fixed TR of 80 ms, the normalized SNR decreases very gradually when the TE is increased from 0.160 to 5 ms at either 3T or 7T (Fig. 2 (a)). The sodium image signal decays at almost the same rate at both field strengths when the TE is less than 1 ms. On the other hand, the sodium image signal decays more rapidly at 7T than at 3T in the case of a very short TE (≥1 ms).
Fig. 2.
(a) Normalized signal-to-noise ratio (SNR) as a function of TE, and (b) TR at 3T and 7T for the sodium MR imaging of agarose phantom. TR = 80 ms (a), TE = 0.160 ms (b) were fixed, respectively.
Sodium MR imaging of the agarose phantom demonstrates fast T1 relaxation with an increase in TR (fixed TE) at either 3T or 7T. Starting with a TE of 0.160 ms, the normalized SNR increases rapidly as the TR is increased from 40 ms to 500 ms at either field strength as shown in Fig. 2 (b), with the sodium signal relaxation reaching a plateau at approximately TR = 100-150 ms. The signals reach the respective plateaus quicker at 7T in comparison with 3T. The phantom experiment cannot completely simulate in vivo conditions. The fitted T1 values at 3T and 7T were ∼24 ± 2 ms (R-Square = 0.91145) and ∼28 ± 1 ms (R-Square = 0.96789), respectively.
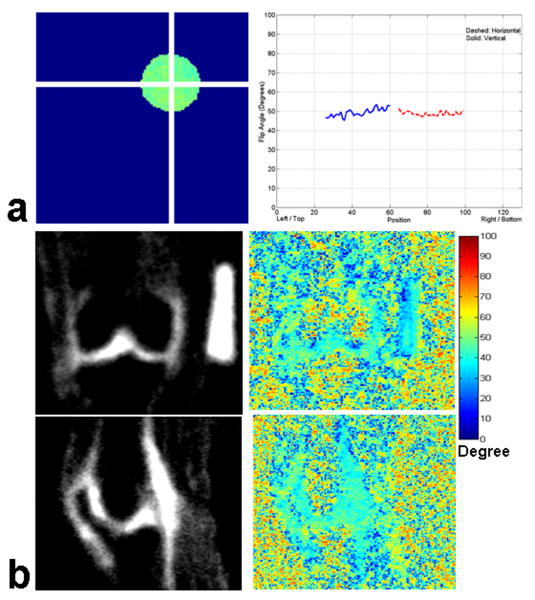
Fig. 3 shows the representative flip angle map of the agarose phantom (Fig. 3 (a)) and human knee images in coronal and sagittal orientations (Fig. 3 (b)), respectively. The profile plots of the flip angle variation along the horizontal and vertical axes are shown in the right column of Fig. 3 (a), with the dashed line showing the flip angle variation along the horizontal axis and the solid line showing the flip angle variation along the vertical axis in the left column of Fig. 3 (a), respectively. There is less than ∼5% variation in flip angle distribution across the whole region of the agarose phantom at 7T. Likewise, the first and second rows of Fig. 3 (b) show the representative coronal and sagittal knee images, and the corresponding flip angle distribution in the human cartilage region with the background noise and artifacts in the periphery, respectively. The right-side barscale shows the variation range of flip angle in degrees. There is a variation in flip angle of ∼2 – 4% across the cartilage regions of interest at 7T.
Fig. 3.
(a) Representative flip angle maps of the 4% agarose gel phantom filled with 300 mM/L NaCl and profile plots of the flip angle along the horizontal and vertical directions, and (b) human knee in the coronal and sagittal orientations, respectively. There is less than a 5% variation in flip angle distribution for the agarose phantom and human knee sodium MR imaging at 7T.
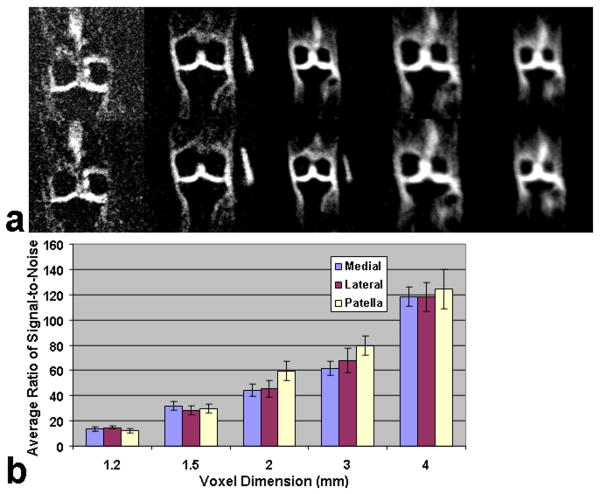
Representative sodium images in the coronal plane with a variable resolution from 1.2 mm to 4 mm are shown in Fig. 4 (a). Fig. 4 (b) shows the corresponding barcharts of the measured average signal-to-noise ratio (SNR) as a function of voxel dimension for the three sub-regions of medial and lateral femoral-tibial joint compartments and the patellar cartilage compartment. The average SNR demonstrated an apparently increase with an increase in voxel dimension from 1.2 mm to 4 mm for all three sub-regions of human cartilage. All the five acquisitions had the same parameters of TR/TE = 80 ms/0.160 ms. The numbers of averages were 10, 10, 10, 10, and 5, respectively. The numbers of projections were 1024, 1024, 1024, 512, and 512 and the isotropic voxel dimensions were 1.2 mm, 1.5 mm, 2 mm, 3 mm, and 4 mm, respectively. The acquisition time (TA) varied with the spatial resolution, i.e. TA = 13:42 min, 13:42 min, 13:42 min, 6:50 min, and 3:25 min, respectively. As is shown in Fig. 4 (b), the measured average SNR had the values of ∼14, ∼30, ∼50, ∼70, and ∼120 for the voxel dimensions of 1.2 mm, 1.5 mm, 2 mm, 3 mm, and 4 mm for all three sub-regions of human cartilage, respectively. Error bars show the standard deviations (SD) of measurement. Further, the variation in sodium image resolution can also be discerned visually in Fig. 4 (a).
Fig. 4.
(a) Representative sodium images in the coronal orientation at 7T with variable resolution from 1.2 mm to 4 mm. The numbers of averages were 10, 10, 10, 10, and 5, respectively. (b) Corresponding bar charts of measured average SNR as a function of voxel dimension within the three sub-regions of medial-lateral femoral tibial cartilage, and patellar cartilage of human cartilage. Error bars show the standard deviation (SD) of measurement.
Fig. 5 shows the representative sodium images at 7T in three orthogonal planes (axial, coronal, and sagittal) with the isotropic resolution of 1.5mm×1.5mm×1.5mm. The sodium images show very good sodium signal contrast of the human knee cartilage regions in all three directions. Furthermore, the averaged SNR in the axial, coronal, and sagittal directions was approximately 30, and the acquisition time for the isotropic 1.5 mm resolution is within a clinically acceptable range of 13:42 min. The top-left side in the four axial sodium images shows the five small calibration phantoms (100 mM/L, 150 mM/L, 200 mM/L, 250 mM/L, and 300 mM/L) used for the computation of the sodium concentration in vivo.
Fig. 5.
Representative sodium images at 7T in three orthogonal planes of axial (top), coronal (middle), and sagittal (bottom) with isotropic resolution of 1.5 mm.
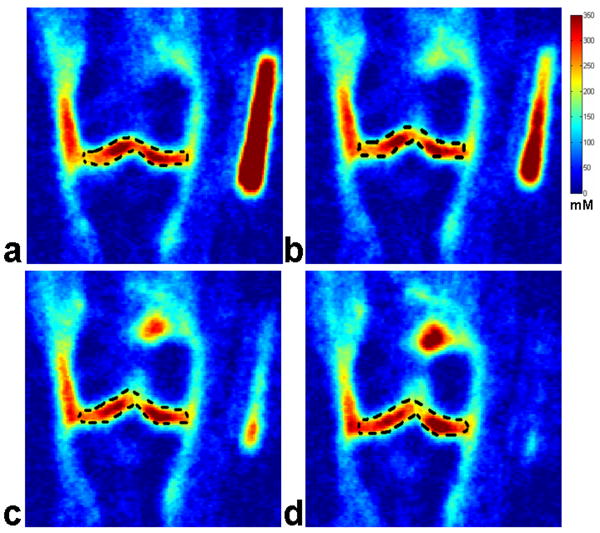
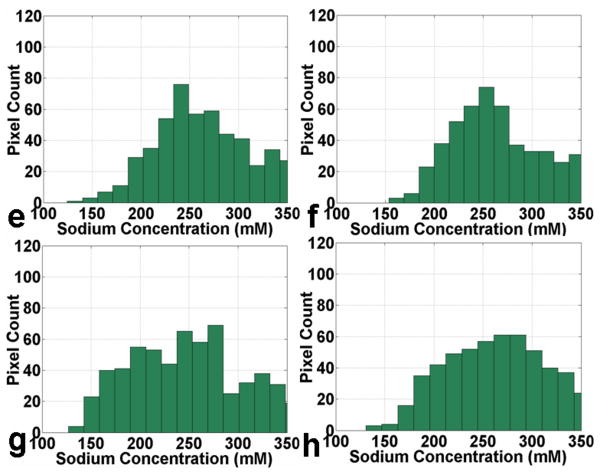
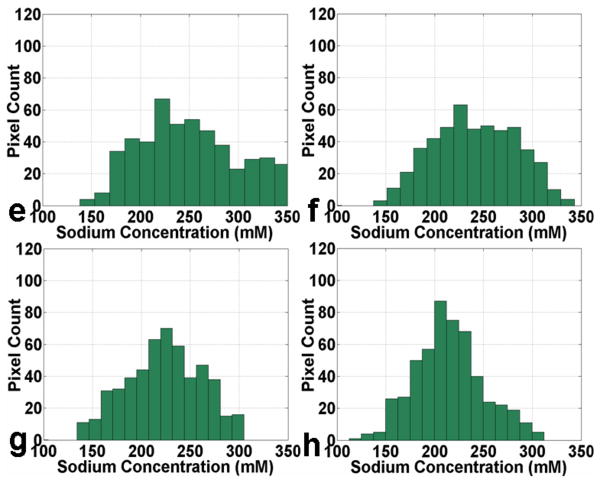
Fig. 6(A) shows four representative consecutive sodium concentration maps of human cartilage from a healthy subject at 7T with an isotropic resolution of 1.5 mm. The corresponding histograms of pixel concentration in the medial femoral-tibial and lateral femoral-tibial sub-regions of cartilage as depicted in the manually drawn region of interest (ROI) using a dark dashed contour on the sodium image are shown in Fig. 6(B). It can be seen that most of the pixel concentrations in the ROIs of the medial femoral-tibial and lateral femoral-tibial sub-regions for the healthy control reside in the range of 250 mM/L – 300 mM/L concentration, taking on a distribution in the proximity of the 250 mM/L sodium concentration as a whole. The corresponding measured average sodium concentrations of the four ROIs are: 258 ± 46, 253 ± 50, 252 ± 52, and 261 ± 48 mM/L, respectively.
Fig. 6.
Fig. 6(A): Four representative consecutive sodium concentration maps (a - d) of human cartilage in coronal plane at 7T with isotropic resolution of 1.5 mm from a healthy control.
Fig. 6(B): The corresponding histograms (e - h) of pixel concentration in the femoral-tibial medial and femoral-tibial lateral sub-regions of cartilage as depicted in the manually drawn regions of interest (ROIs) using a dark dashed contour on the sodium images in Fig. 6(A) (a - d).
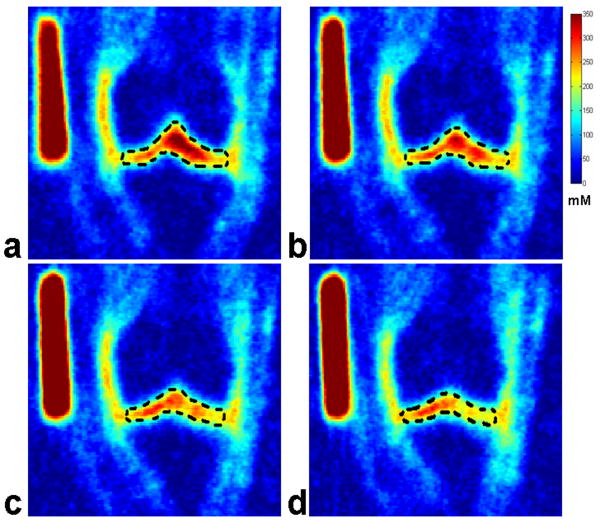
Fig. 7(A) shows four representative consecutive sodium concentration maps of human cartilage in the coronal plane at 7T with an isotropic resolution of 1.5 mm from an OA subject. The corresponding histograms of pixel concentration in the medial femoral-tibial and lateral femoral-tibial sub-regions of cartilage as depicted in the manually drawn ROI using a dark dashed contour on the sodium image are shown in Fig. 7(B). It can be seen that most of the pixel concentrations in ROIs of the femoral-tibial medial and femoral-tibial lateral sub-regions for the OA subject reside in the range of 200 mM/L – 250 mM/L concentration, taking on a distribution in the proximity of the 200 mM/L sodium concentration as a whole. The corresponding measured average sodium concentrations of the four ROIs are: 239 ± 50, 228 ± 47, 218 ± 41, and 212 ± 37 mM/L, respectively. It is apparent from the sodium concentration maps and the corresponding pixel concentration histograms that the sodium concentration has a relatively lower distribution in the OA cartilage regions in comparison with the healthy controls.
Fig. 7.
Fig. 7(A): Four representative consecutive sodium concentration maps (a - d) of human cartilage in coronal plane at 7T with isotropic resolution of 1.5 mm from an OA patient.
Fig. 7(B): The corresponding histograms (e - h) of pixel concentration in the femoral-tibial medial and femoral-tibial lateral sub-regions of cartilage as depicted in the manually drawn ROIs using a dark dashed contour on the sodium images in Fig. 7(A) (a - d).
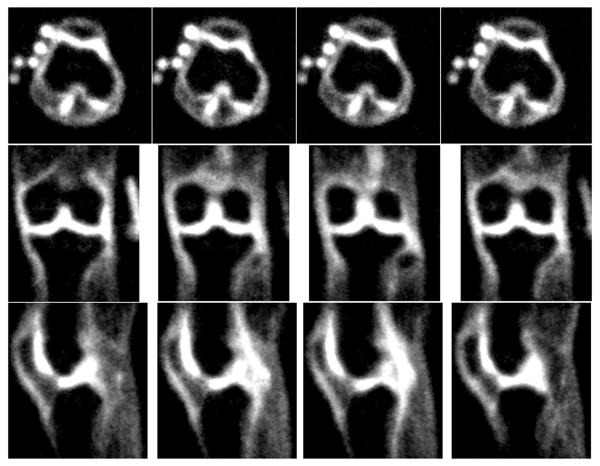
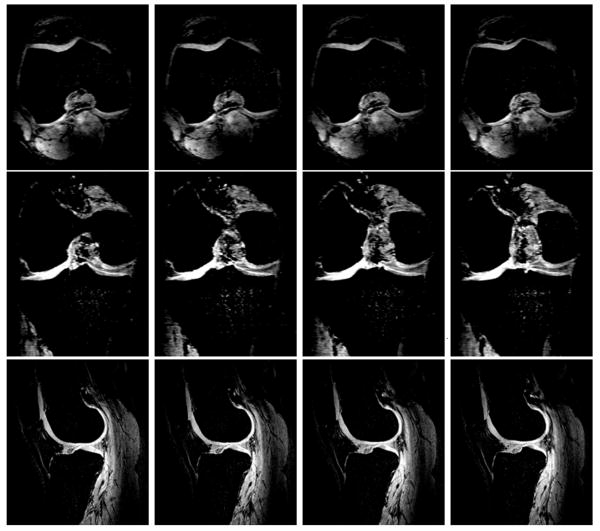
Fig. 8 shows four representative consecutive proton T1-weighted images of human cartilage from a healthy control in three orthogonal directions of axial (top), coronal (middle), and sagittal (bottom) at 7T, respectively for healthy human cartilage anatomical reference and cartilage localization.
Fig. 8.
Four representative consecutive proton T1-weighted images of human cartilage from a healthy control in three orthogonal directions of axial (top), coronal (middle), and sagittal (bottom) at 7T, respectively. Acquisition parameters: 3D-FLASH, fat suppression, TR/TE = 20 ms/4.3 ms, Flip Angle = 100, Averages = 1, Bandwidth = 130 Hz/pixel, thickness = 1 mm, FOV = 100 mm × 100 mm, Matrix = 512 × 512.
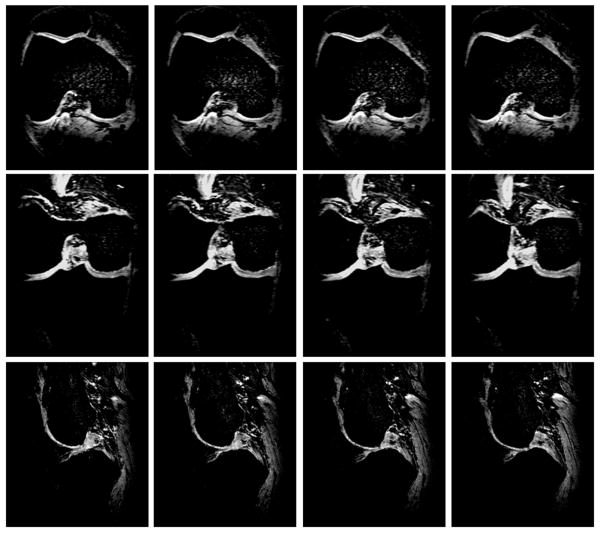
Fig. 9 shows four representative consecutive proton T1-weighted images of human cartilage from an OA subject in three orthogonal directions of axial (top), coronal (middle), and sagittal (bottom) at 7T, respectively for OA human cartilage anatomical reference and cartilage localization.
Fig. 9.
Four representative consecutive proton T1-weighted images of human cartilage from an OA subject in three orthogonal directions of axial (top), coronal (middle), and sagittal (bottom) at 7T, respectively. Acquisition parameters: 3D-FLASH, fat suppression, TR/TE = 20 ms/4.3 ms, Flip Angle = 100, Averages = 1, Bandwidth = 130 Hz/pixel, thickness = 1 mm, FOV = 100 mm × 100 mm, Matrix = 512 × 512.
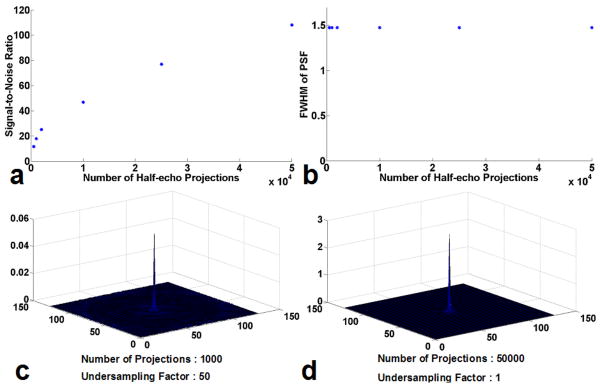
The SNR, PSF and related FWHM obtained from computer simulations are shown in Figure 10 as functions of the undersampling factor. The measured SNR that correspond to different numbers of projections are demonstrated in Fig. 10 (a). As expected, the SNR increases with the number of projections (as well as data acquisition time). The measured FWHM that correspond to different numbers of projections are shown in Fig. 10 (b). It can be seen that FWHM stays constant despite of the variation of the number of projections. The central slice of reconstructed 3D PSF are illustrated in Fig. 10 (c) and Fig. 10 (d), with a full sampling that satisfies the Nyquist criteria shown in Fig. 10 (d) and an undersampling with an undersampling factor of 50 as used in the experiments shown in Fig. 10 (c). It is noted that the peak signal intensity in the undersampling case is much lower than that in the full sampling case, which indicates the leakage of energy as a result of undersampling artifacts. While it is desirable to limit this leakage, the images presented in this work achieve a practical compromise between imaging time and image quality.
Fig. 10.
(a) and (b), the simulated results about the SNR and PSF as a function of half-echo projections number, respectively. (c) and (d), the calculated signal intensity (arbitrary unit of the same scale) as functions of the half-echo projections number and the undersampling factor, respectively with (c) projections number 1000, undersampling factor 50 and (d) projections number 50000, undersampling factor 1, respectively, biexponential decay, resolution: 128 × 128.
Discussion
The main objective of this study was to demonstrate the feasibility of acquiring high resolution, isotropic 3D-sodium MR images of the whole knee joint with clinically acceptable scan times at 7T, via a 3D-radial acquisition and with an ultra short echo time. 23Na NMR spectroscopy has been used extensively to study PG-depleted cartilage. Many of theses studies have demonstrated clear alterations in relaxation times of the 23Na nuclei in degraded cartilage, with the signal intensity of the 23Na MR image being reduced in the degraded cartilage (5, 9, 11). Furthermore, other investigators (5) have demonstrated a progressive loss of the sodium NMR signal associated with PG degradation. These investigations have shown that trypsin-depleted PG in cartilage decreases the sodium signal intensity in 23Na MR images, concluding that 23Na MRI and MR spectroscopy (MRS) are feasible techniques to detect cartilage degradation (5, 9-13). Sodium MRI has been proposed and well validated in previous literature as a means for in vivo monitoring of changes in cartilage sodium concentration associated with various types of pathology (9-13). However, sodium ion exhibits very fast bi-exponential transverse relaxation decay in biological tissues, necessitating the use of ultra-short TE sequences (17, 20-23). Sodium MR imaging with clinically acceptable SNR and spatial resolution acquired with short TE has been demonstrated in the brain by previous investigators at clinical field strengths (22). In these studies, short TEs were realized via the use of 3D projection imaging (3D-PI). Although the 3D-PI is extremely effective for imaging nuclear species with fast T2* decay, it requires long data acquisition times. The 3D constant sampling density trajectories provide a fast and reliable means to obtain sodium images with acceptable SNR and spatial resolution in short data acquisition times (17, 22-23).
In the current study, a 3D-GRE imaging sequence with a radial acquisition technique was utilized for sodium MR image acquisition at 7T. Other investigators have verified that ultra-high-field (UHF, 7T and above) MR imaging systems can provide high intrinsic SNR and improved image contrast (29). On the other hand, in a radial acquisition, where phase encoding is eliminated and each projection begins at the k space center, UTE imaging is facilitated, which is crucial for performing short-T2* sodium imaging of cartilage. In addition, radial acquisition has advantages over conventional Cartesian imaging in terms of SNR (22). Further, in radial acquisitions, the spatial resolution is predominately determined by the readout resolution, and weakly related to the number of projections. Angularly undersampled radial acquisition can provide higher spatial resolution per unit time than Cartesian with tolerable artifacts (30). In contrast, radial acquisitions with non-uniform k-space density are expected to have lower SNR than Cartesian imaging with a uniformed density. The relative SNR efficiency of a trajectory, which describes the loss in SNR as compared to a uniform density sampling, can be calculated using the method in Ref. (31). On the other hand, the elimination of phase encoding reduces the total readout time for a given spatial resolution, which increases SNR per unit time. As shown in Fig. 10 (a), it can be seen that the SNR increases with the number of projections (as well as data acquisition time). On the other hand, the FWHM stays constant despite the variation of the number of projections (Fig. 10 (b)). In addition, the peak signal intensity in the undersampling case (undersampling factor: 50) is much lower than the full sampling case (undersampling factor: 1) resulting from the leakage of energy due to undersampling artifacts.
Although ultra high field proton imaging at 7T and above poses specific challenges such as homogeneous radio frequency (RF) coil design, increased chemical shift and susceptibility artifacts, RF power deposition, and changes in relaxation times in comparison with lower field clinical MR scanners, these problems are comparatively minor for low-gamma nuclei, such as 23Na. Moreover, unlike proton T1, which increases with the field strength, the field dependence of sodium T1 is weaker. Hence, rapid averaging in sodium MRI is possible even at high field strengths.
On the other hand, although T2* decay is a major concern in any field strength equal to and higher than 3T, in our current study, as is shown in Fig. 2 (a, b), the normalized SNR as a function of TE for the sodium MR imaging of the agarose phantom does not decrease very quickly within the relatively shorter range of TEs at both field strengths (Fig. 2 (a)). Meanwhile, the normalized SNR as a function of TR for the sodium MR images of the agarose phantom reaches a plateau very quickly. The sodium signal relaxation almost remains constant for TR > 100 ms both at 3T and 7T except for a relatively quick relaxation in the TR range between 40 ms and 150 ms (Fig. 2 (b)). However, since the SNR of sodium is proportional to , sodium MRI will be particularly advantageous in quantitative imaging of human cartilage integrity with the improved SNR and higher image spatial resolution afforded at 7T and higher field strengths (10). The results of the current work confirm that sodium MR imaging is relatively insensitive to B1 at 7T, although B1 inhomogeneity, susceptibility and chemical shift artifacts are all major concerns at higher field strengths in the case of 1H MRI as indicated by other investigators (6). In addition, we also recognize that human knee imaging is a relatively favorable case with regard to B1 inhomogeneity. As shown in Fig. 3 (a) for the agarose phantom and Fig. 3(b) for the human cartilage with B1 maps, there are no significant variations of flip angles along the horizontal and vertical lines in Fig. 3(a). Likewise, the variations of flip angle distribution in the regions of human cartilage in the coronal and sagittal directions are also all smaller than ∼4% for the regions of interest (Fig. 3 (b)). We believe that the proposed 3D sodium MRI of the human knee joint in vivo in combination with flip angle mapping may provide a way to further improve cartilage sodium concentration measurement and minimize the adverse effect of T2* decay.
The measured average SNR for sodium MR imaging of human cartilage across the three compartments shows an increase with decrease in image spatial resolution from 1.2 mm to 4 mm (Fig. 4 (b)). It should be noted that the minimum SNR (∼14) at the 1.2 mm resolution is near clinically acceptability. Further, the SNR in 4 mm resolution is as high as ∼120, which is almost impossible at lower field strengths (5, 9-11, 17). Generally speaking, judging from the corresponding representative sodium images of human cartilage in the coronal plane at 7T starting from the left column of 1.2 mm to the right column of 4 mm consecutively (Fig. 4 (a)), the average SNR for the sodium MR imaging of human cartilage across the two sub-regions in the coronal direction visually shows obvious improvement with the decrease in spatial resolution from 1.2 mm to 4 mm. In addition, the acquisition times (TA) among all these isotropic sodium images of different voxel dimension are still under the clinical threshold of 15 minutes.
The proposed 3D sodium MR imaging method at ultra high field (7T) in this study has comparable advantages over previous investigations at clinical field strengths (10, 13, 17) with regards to image SNR and acquisition times (TA). Likewise, based on the four representative isotropic 1.5 mm resolution sodium images of human cartilage at 7T in the axial, coronal, and sagittal directions, respectively, it is clear that all the three-orthogonal sodium images at 1.5 mm resolution displayed the sodium signal distribution with excellent image contrast across the human cartilage region. In summary, all these results strongly support the feasibility of rapidly acquiring isotropic 3D sodium MR images of the human knee joint with a minimum SNR of ∼14 and as low as 1.2 mm isotropic resolution using a 7T MR imaging system.
In our current study, five small sodium calibration phantoms were imaged simultaneously with knee to quantitate the sodium distribution in human cartilage using methods described previously (5, 9, 10). Four representative coronal sodium images of in vivo cartilage from a healthy volunteer and the corresponding histograms of pixel count in the femoral-tibial cartilage region as a function of sodium concentrations are shown in Fig. 6 (A)(a, b, c, d). In these images, the lightness and depth in color red correspond to the variation of sodium concentrations in the cartilage region. Based on the fixed negative charge density calculations (5, 9), sodium concentration in healthy controls ranges from ∼100 mM/L to 300 mM/L with the maximum pixel count of sodium concentration residing in the range between 250 mM/L and 300 mM/L. On the other hand, although the sodium concentration in the OA patents has almost the same range as those of the healthy control, the maximum pixel count of sodium concentration for the OA patient centers around the range between 200 mM/L and 250 mM/L as is shown in Fig. 7(A)(a, b, c, d). The quantitative analysis for the sodium concentration in the corresponding cartilage region also further shows that the mean sodium concentration of healthy subjects ranges from ∼240 to 280 mM/L. However, in OA patients the sodium concentrations were reduced to ∼30 - 60% depending upon the degree of cartilage degeneration. This difference in sodium concentration between healthy subjects and OA patients was statistically significant (P < 0.05). Our results are in excellent agreement with previous reports describing decreased sodium content in the cartilage of OA patients (5, 9, 10). The results demonstrate that sodium imaging at 7T can detect the variations associated with the loss of PG from human cartilage.
Future studies may include the overall quantitative analysis of sodium concentration on in vivo human femur, tibia and patella cartilages at 7T with larger numbers of individuals evaluated. Furthermore, a combination with contrast modification techniques, based on either quadrupolar contrast or inversion recovery may lead to an enhanced demarcation and characterization of the tissue (32). The thin layers of human cartilage, typically on the order of 3-5 mm, in association with increased sodium signal intensity from the peripheral synovial fluid and ligaments may require additional techniques to suppress the synovial fluid and separate the cartilage (33-35), and the inversion recovery experiment may prove to be particularly advantageous for this purpose.
In summary, these preliminary results demonstrate the feasibility of acquiring high resolution, isotropic 3D-sodium images of the whole knee joint in vivo with clinically acceptable scan times via 3D-radial acquisition and UTE using a 7T MR imaging system. This is the first study to demonstrate the feasibility of acquiring high resolution, isotropic 3D-sodium knee images of healthy and OA patients at 7T in less than 15 minutes. The preliminary results suggest that sodium imaging at 7T may be a viable alternative for OA imaging, lesion localization, and clinical diagnosis.
Acknowledgments
This work was supported by the grants from National Institute of Arthritis and Musculoskeletal and Skin Diseases (NIAMS), Grant Nos: RO1-AR053133-0A2, 1R21AR054002-01A1.
References
- 1.Trattnig S, Mlynarik V, Huber M, Ba-Ssalamah A, Puig S, Imhof H. Magnetic resonance imaging of articular cartilage and evaluation of cartilage disease. Invest Radiol. 2000;35:595–601. doi: 10.1097/00004424-200010000-00006. [DOI] [PubMed] [Google Scholar]
- 2.Burstein D, Bashir A, Gray ML. MRI techniques in early stages of cartilage disease. Invest Radiol. 2000;35:622–638. doi: 10.1097/00004424-200010000-00008. [DOI] [PubMed] [Google Scholar]
- 3.Pakin KS, Jian Xu, Schweitzer ME, Regatte RR. Rapid 3D-T1ρ Mapping of the Knee Joint at 3.0T with Parallel Imaging. Magn Reson Med. 2006;56:563–571. doi: 10.1002/mrm.20982. [DOI] [PubMed] [Google Scholar]
- 4.Huber M, Trattnig S, Lintner F. Anatomy, biochemistry, and physiology of articular cartilage. Invest Radiol. 2000;35:573–580. doi: 10.1097/00004424-200010000-00003. [DOI] [PubMed] [Google Scholar]
- 5.Reddy R, Insko EK, Noyszewski EA, Dandora R, Kneeland JB, Leigh JS. Sodium MRI of human articular cartilage in vivo. Magn Reson Med. 1998;39:697–701. doi: 10.1002/mrm.1910390505. [DOI] [PubMed] [Google Scholar]
- 6.Wang L, Schweitzer ME, Padua A, Regatte RR. Rapid 3D-T(1) mapping of cartilage with variable flip angle and parallel imaging at 3.0T. J Magn Reson Imaging. 2008;27(1):154–161. doi: 10.1002/jmri.21109. [DOI] [PubMed] [Google Scholar]
- 7.Bashir A, Gray ML, Burnstein D. Gd-DTPA2- as a measure of cartilage degeneration. Magn Reson Med. 1996;36:665–673. doi: 10.1002/mrm.1910360504. [DOI] [PubMed] [Google Scholar]
- 8.Ling W, Regatte RR, Navon G, Jerschow A. Assessment of glycosaminoglycan concentration in vivo by chemical exchange-dependent saturation transfer (gagCEST) Proc Natl Acad Sci U S A. 2008;105(7):2266–2270. doi: 10.1073/pnas.0707666105. [DOI] [PMC free article] [PubMed] [Google Scholar]
- 9.Shapiro EM, Borthakur A, Dandora R, Kriss A, Leigh JS, Reddy R. Sodium visibility and quantitation in intact bovine articular cartilage using high field (23)Na MRI and MRS. J Magn Reson. 2000;142(1):24–31. doi: 10.1006/jmre.1999.1932. [DOI] [PubMed] [Google Scholar]
- 10.Borthakur A, Mellon E, Niyogi S, Witschey W, Kneeland JB, Reddy R. Sodium and T1rho MRI for molecular and diagnostic imaging of articular cartilage. NMR Biomed. 2006;19(7):781–821. doi: 10.1002/nbm.1102. [DOI] [PMC free article] [PubMed] [Google Scholar]
- 11.Shapiro EM, Borthakur A, Gougoutas A, Reddy R. 23Na MRI accurately measures fixed charge density in articular cartilage. Magn Reson Med. 2002;47(2):284–291. doi: 10.1002/mrm.10054. [DOI] [PMC free article] [PubMed] [Google Scholar]
- 12.Reddy R, Li S, Noyszewski EA, Kneeland JB, Leigh JS. In vivo sodium multiple quantum spectroscopy of human articular cartilage. Magn Reson Med. 1997;38(2):207–214. doi: 10.1002/mrm.1910380208. [DOI] [PubMed] [Google Scholar]
- 13.Borthakur A, Hancu I, Boada FE, Shen GX, Shapiro EM, Reddy R. In vivo triple quantum filtered twisted projection sodium MRI of human articular cartilage. J Magn Reson. 1999;141(2):286–290. doi: 10.1006/jmre.1999.1923. [DOI] [PubMed] [Google Scholar]
- 14.Perman WH, Turski PA, Houston LW, Glover GH, Hayes CE. Methodology of in vivo human sodium MR imaging at 1.5 T. Radiology. 1986;160(3):811–820. doi: 10.1148/radiology.160.3.3737922. [DOI] [PubMed] [Google Scholar]
- 15.Parrish TB, Fieno DS, Fitzgerald SW, Judd RM. Theoretical basis for sodium and potassium MRI of the human heart at 1.5 T. Magn Reson Med. 1997;38(4):653–661. doi: 10.1002/mrm.1910380420. [DOI] [PubMed] [Google Scholar]
- 16.Stobbe R, Beaulieu C. Sodium imaging optimization under specific absorption rate constraint. Magn Reson Med. 2008;59(2):345–355. doi: 10.1002/mrm.21468. [DOI] [PubMed] [Google Scholar]
- 17.Boada FE, Gillen JS, Shen GX, Chang SY, Thulborn KR. Fast three dimensional sodium imaging. Magn Reson Med. 1997;37(5):706–715. doi: 10.1002/mrm.1910370512. [DOI] [PubMed] [Google Scholar]
- 18.Rooney WD, Springer CS., Jr A comprehensive approach to the analysis and interpretation of the resonances of spins 3/2 from living systems. NMR Biomed. 1991;4(5):209–226. doi: 10.1002/nbm.1940040502. [DOI] [PubMed] [Google Scholar]
- 19.Bashir A, Gray ML, Hartke J, Burstein D. Nondestructive imaging of human cartilage glycosaminoglycan concentration by MRI. Magn Reson Med. 1999;41(5):857–865. doi: 10.1002/(sici)1522-2594(199905)41:5<857::aid-mrm1>3.0.co;2-e. [DOI] [PubMed] [Google Scholar]
- 20.Pabst T, Sandstede J, Beer M, Kenn W, Neubauer S, Hahn D. Sodium T2* relaxation times in human heart muscle. J Magn Reson Imaging. 2002;15(2):215–218. doi: 10.1002/jmri.10046. [DOI] [PubMed] [Google Scholar]
- 21.Rahmer J, Bornert P, Groen J, Bos C. Three-dimensional radial ultrashort echo-time imaging with T2 adapted sampling. Magn Reson Med. 2006;55(5):1075–1082. doi: 10.1002/mrm.20868. [DOI] [PubMed] [Google Scholar]
- 22.Nielles-Vallespin S, Weber MA, Bock M, Bongers A, Speier P, Combs SE, Wohrle J, Lehmann-Horn F, Essig M, Schad LR. 3D radial projection technique with ultrashort echo times for sodium MRI: clinical applications in human brain and skeletal muscle. Magn Reson Med. 2007;57(1):74–81. doi: 10.1002/mrm.21104. [DOI] [PubMed] [Google Scholar]
- 23.Jerecic R, Bock M, Nielles-Vallespin S, Wacker C, Bauer W, Schad LR. ECG-gated 23Na-MRI of the human heart using a 3D-radial projection technique with ultra-short echo times. Magma. 2004;16(6):297–302. doi: 10.1007/s10334-004-0038-8. [DOI] [PubMed] [Google Scholar]
- 24.Thulborn KR, Ackerman JJH. Absolute molar concentrations by NMR inhomogeneous B1. A scheme for analysis of in vivo metabolites. J Magn Reson. 1983;55:357–371. [Google Scholar]
- 25.Cunningham CH, Pauly JM, Nayak KS. Saturated double-angle method for rapid B1+ mapping. Magn Reson Med. 2006;55(6):1326–1333. doi: 10.1002/mrm.20896. [DOI] [PubMed] [Google Scholar]
- 26.Alecci M, Collins CM, Smith MB, Jezzard P. Radio frequency magnetic field mapping of a 3 Tesla birdcage coil: experimental and theoretical dependence on sample properties. Magn Reson Med. 2001;46(2):379–385. doi: 10.1002/mrm.1201. [DOI] [PubMed] [Google Scholar]
- 27.Insko EK, Bolinger L. Mapping of the radiofrequency field. J Magn Reson. 1993;103:82–85. [Google Scholar]
- 28.Kellgren JH, Lawrence JS. Radiological assessment of osteo-arthrosis. Ann Rheum Dis. 1957;16:494–502. doi: 10.1136/ard.16.4.494. [DOI] [PMC free article] [PubMed] [Google Scholar]
- 29.Regatte RR, Schweitzer ME. Ultra-high-field MRI of the musculoskeletal system at 7.0T. J Magn Reson Imaging. 2007;25(2):262–269. doi: 10.1002/jmri.20814. [DOI] [PubMed] [Google Scholar]
- 30.Peters DC, Korosec FR, Grist TM, Block WF, Holden JE, Vigen KK, Mistretta CA. Undersampled projection reconstruction applied to MR angiography. Magn Reson Med. 2000;43(1):91–101. doi: 10.1002/(sici)1522-2594(200001)43:1<91::aid-mrm11>3.0.co;2-4. [DOI] [PubMed] [Google Scholar]
- 31.Tsai CM, Nishimura DG. Reduced aliasing artifacts using variable-density k-space sampling trajectories. Magn Reson Med. 2000;43(3):452–458. doi: 10.1002/(sici)1522-2594(200003)43:3<452::aid-mrm18>3.0.co;2-b. [DOI] [PubMed] [Google Scholar]
- 32.Constantinides CD, Gillen JS, Boada FE, Pomper MG, Bottomley PA. Human skeletal muscle: sodium MR imaging and quantification-potential applications in exercise and disease. Radiology. 2000;216(2):559–568. doi: 10.1148/radiology.216.2.r00jl46559. [DOI] [PubMed] [Google Scholar]
- 33.Rong P, Regatte RR, Jerschow A. Clean demarcation of cartilage tissue (23)Na by inversion recovery. J Magn Reson. 2008;193(2):207–209. doi: 10.1016/j.jmr.2008.04.036. [DOI] [PMC free article] [PubMed] [Google Scholar]
- 34.Ling W, Regatte RR, Schweitzer ME, Jerschow A. Behavior of ordered sodium in enzymatically depleted cartilage tissue. Magn Reson Med. 2006;56(5):1151–1155. doi: 10.1002/mrm.21062. [DOI] [PubMed] [Google Scholar]
- 35.Choy J, Ling W, Jerschow A. Selective detection of ordered sodium signals via the central transition. J Magn Reson. 2006;180(1):105–109. doi: 10.1016/j.jmr.2006.01.011. [DOI] [PubMed] [Google Scholar]


