

Abstract
Methods and advances for monitoring neurotransmitters in vivo or for tissue analysis of neurotransmitters over the last five years are reviewed. The review is organized primarily by neurotransmitter type. Transmitter and related compounds may be monitored by either in vivo sampling coupled to analytical methods or implanted sensors. Sampling is primarily performed using microdialysis, but low-flow push-pull perfusion may offer advantages of spatial resolution while minimizing the tissue disruption associated with higher flow rates. Analytical techniques coupled to these sampling methods include liquid chromatography, capillary electrophoresis, enzyme assays, sensors, and mass spectrometry. Methods for the detection of amino acid, monoamine, neuropeptide, acetylcholine, nucleoside, and soluable gas neurotransmitters have been developed and improved upon. Advances in the speed and sensitivity of these methods have enabled improvements in temporal resolution and increased the number of compounds detectable. Similar advances have enabled improved detection at tissue samples, with a substantial emphasis on single cell and other small samples. Sensors provide excellent temporal and spatial resolution for in vivo monitoring. Advances in application to catecholamines, indoleamines, and amino acids have been prominent. Improvements in stability, sensitivity, and selectivity of the sensors have been of paramount interest.
Keywords: neurotransmitter, biosensor, microdialysis
1. Introduction
In recent decades, neurochemical measurements have led to many improvements in our understanding of the relationship between chemistry in the central nervous system (CNS) and the behavioral, cognitive, and emotional state of an organism. Abnormal neurotransmission has been linked to a wide range of conditions, including depression,[1] drug dependence,[2] schizophrenia,[3] and degenerative diseases[4] among many others. Measurement of the in vivo dynamics of neurotransmitters in the extracellular space of the CNS has been an important tool for these studies. Making such measurements are fraught with difficulty related to the complex and delicate tissue, requirements for stable measurements with high selectivity, temporal resolution, and spatial resolution, and difficult interpretations of data. While progress has been made in such measurements, the techniques used to measure these neural messengers are still limited in their ability to measure accurately the rapid and heterogeneous changes that occur in the extracellular space of the CNS.[5] Neurotransmitter content and release are also studied in vitro through analysis of cells in culture and ex vivo tissue preparations such as brain slices. Again, many challenges exist such as the complexity of samples, obtaining good temporal resolution, and working at miniaturized sample preparations such as single neurons.
Techniques most commonly used for the measurement of neurotransmitters include microelectrodes, biosensors, liquid chromatography (LC) and capillary electrophoresis (CE) separations, and mass spectrometry (MS). For measuring the CNS dynamics of transmitters, microelectrodes and biosensors may be directly used or sampling methods such as microdialysis or low flow push pull perfusion (LFPP) may be coupled to analytical techniques. For such measurements, microelectrodes and biosensors can exhibit high temporal and spatial resolution; however, a minority of neurotransmitters can be detected by direct redox acitivity at an electrode.[6] Measurement of those that are electroactive is complicated by interference from other electroactive neurotransmitters, the relatively high concentration of electroactive metabolites such as ascorbic acid, and electrode fouling. These electrochemical detection (EC) techniques may experience background drift or require long periods for sample to accumulate on the sensor, both of which limit the length and frequency of their monitoring periods. Additionally, relatively few biosensor or microelectrode methods offer the ability to detect more than one analyte at a time. Sampling techniques, of which microdialysis is the most commonly used, enable multi-analyte detection and long term measurements. The temporal resolution of sampling techniques is limited by the detection limits of the analytical method to which they are coupled. In some instances, data have been measured in frequencies as small as 11 seconds,[7] but more commonly, fractions are collected in 10 to 15 minute intervals. Microdialysis cannot match the spatial resolution achieved by in vivo electrochemical monitoring, although LFPP can sample from a similarly small region.
This review aims to present efforts to address and minimize the limitations of these common techniques for monitoring neurotransmitters. This review consists of a comprehensive gathering of method developments for in vivo measurements, excluding positron emission topography, which have been published in the last five years. While the emphasis is on in vivo monitoring applications, we also cite techniques used for tissue analysis in cases where recent novel developments have been reported. The review is organized by category of neurotransmitter.
2. Neuroactive amino acids
The amino acids glutamate (Glu), γ-aminobutyric acid (GABA), glycine (Gly), aspartate (Asp), taurine (Tau), and D-serine (Ser) are neurotransmitters or neuromodulators. Glu and Asp are the primary excitatory neurotransmitters in the CNS while GABA and Gly are the primary inhibitory transmitters. D-Asp appears to serve a neuromodulatory role aside from the excitatory transmission possible with both enantiomers. Tau and D-Ser both play inhibitory roles as neuromodulators on Glu and GABA receptors.[8–10] Most recent work developing new detection methods has focused on the detection of multiple neuroactive amino acids and on the detection of Glu alone. Multiple analyte detection of neuroactive amino acids is attractive given the ability of a stimulus to alter more than one of them at a time. Much work has focused on Glu due to its role as a major excitatory neurotransmitter and the relative availability of good enzymes for its detection. Comparatively little work as been done in detecting the other neuroactive amino acids singly and no new methods for the detection of Asp alone were published in the last five years. This trend speaks to the importance of simultaneous detection of neurotransmitters for applied neuroscience.
In the selection of assay method, an important consideration are the limits of detection (LODs) for the methods and the expected concentration of the analyte. Many of multi-analyte methods focused on amino acids seemed to have been designed with the intent of applying them for in vivo measurement as the reported LODs (Table 1) were usually less than the basal concentrations summarized in Table 2. About half of these multi-analyte methods were applied for in vivo monitoring. In contrast, several papers describing single analyte detection had LODs above the basal concentrations for that analyte (Table 2). Further development would be required for these techniques to be applied to in vivo applications.
Table 1.
Abrreviations and their definitions
| Abbreviation | Full name |
|---|---|
| 5HT | serotonin |
| α-MSH | α-melanocyte-stimulating-hormone |
| ACC | anterior cingulate cortex |
| Ach | acetylcholine |
| ADP | adenosine diphosphate |
| ALiPHAT | augmented limits of detection for peptides with hydrophobic alkyl tags |
| AMP | adenosine monophosphate |
| Ang | angiotensins |
| Ang IV | angiotensin IV |
| AP | anterior pituitary |
| Asp | aspartate |
| ATP | adenosine triphosphate |
| BBMEC | bovine brain microvessel endothelial cell |
| BE | β-endorphin |
| CCK | chrolecystokinin |
| CCK-4 | chrolecystokinin-4 |
| CE | capillary electrophoresis |
| CEC | capillary electrochromatography |
| CGRP | calcitonin gene-related peptide |
| CNS | central nervous system |
| CRH | corticotropin releasing hormone |
| CSF | cerebral spinal fluid |
| DA | dopamine |
| DAACP | D-amino acid containing peptides |
| DAFs | diaminofluoresceins |
| Dyn | dynorphins |
| Dyn A and B | dynorphin A and B |
| Dyn A1-8 | dynorphin A1-8 |
| EC | electrochemical detection |
| EIA | enzyme immunoassay |
| EM | endomorphins |
| EM1 and EM2 | endomorphin 1 and 2 |
| EOF | electroosmotic flow |
| EP | epinephrine |
| ESI | electrospray ionization |
| FIA | flow injection analysis |
| FLD | fluorescence detection |
| FSCV | fast scan cyclic voltammetry |
| GABA | γ-aminobutyric acid |
| GHRH | growth hormone releasing hormone |
| Glu | glutamate |
| Gly | glycine |
| Hcrt | hypocretins |
| Hcrt-1 and Hcrt-2 | hypocretin-1 and hypocretin-2 |
| HEPES | 4-(2-Hydroxyethyl)piperazine-1-ethanesulfonic acid |
| HPLC | high performance liquid chromatography |
| LC | liquid chromatography |
| LE | leucine-enkephalin |
| LED-IF | light emitting diode induced fluorescence |
| LFPP | low flow push pull perfusion |
| LIF | laser induced fluorescence |
| LOD | limit of detection |
| MALDI | matrix assisted laser desorption ionization |
| ME | methionine-enkephalin |
| MS | mass spectrometry |
| MWCNT | multiwall carbon nanotubes |
| NDA | naphthalene-2,3-dicarboxaldehyde |
| NE | norepinephrine |
| NKA and NKB | neurokinin α and β |
| NMDA | N-methyl D-aspartate |
| NO | nitric oxide |
| N/OFQ | nociceptin/orphanin FQ |
| NPY | neuropeptide tyrosine |
| NT | neurotensin |
| NT8-13 | neurotensin8-13 |
| OXT | oxytocin |
| PFET | photoluminescence following electron transfer |
| pseudo-tITP | transient pseudo-isotachophoresis |
| PVN | paraventricular nucleus |
| RIA | radio immunoassay |
| SIA | sequential injection analysis |
| SOM | somatostatin |
| SP | substance P |
| SPE | solid phase extraction |
| Tau | taurine |
| TOF | time of flight |
| TRH | thyrotropin releasing hormone |
| UV | ultraviolet |
| VIP | vasoactive intestinal polypeptide |
| VP | vasopressin |
Table 2.
Summary of amino acid neurotransmitter detection methods and their LODs.
| Analytes | Experiment Type | Detection method | Sampling technique (if applicable) | LOD | Reference |
|---|---|---|---|---|---|
| GABA, Gly, Tau, Glu, Asp | Method development | CE-LIF | 0.1–0.2 nM | [11] | |
| GABA, Tau, Gly, L-Ser, D-Ser, Glu | Method development w/in vivo testing | CE-LIF | Microdialysis | GABA: 5.1 nM Tau: 19.5 nM Gly: 18.0 nM L-Ser: 57.0 nM D-Ser: 57.0 nM Glu: 85.0 nM |
[13] |
| D-Ser, L-Ser, Glu, Asp, GABA, Tau | Method development w/in vivo testing | CE-LIF | Microdialysis | Glu: 0.14 μM GABA: 0.05 μM D-Ser: 0.06 μM L-Ser: 0.06 μM |
[14] |
| Glu, Asp | Method development | CE-LIF | Glu: 0.070–0.71 nM 0.12 Asp: 0.12–83 nM |
[15, 16] | |
| Glu, Asp | Method development | CE-LED-IF | 47 nM | [26] | |
| Glu, Tau, GABA, Gly | Method development | CE-LIF | Glu: 1.2 nM Tau: 0.5 nM GABA: 0.7 nM Gly: 0.5 nM |
[17] | |
| Glu, Asp, GABA | Method development w/in vivo and pharmacological manipulation | CE-LIF | Microdialysis | Glu: 0.4 nM Asp: 0.4 nM GABA: 3 nM |
[18] |
| GABA, Gly, Tau, Glu, Asp | Method development w/ex vivo sample testing | CE-LIF | Tau: 0.06 nM Gly: 0.08 nM Others: 0.1 nM |
[19] | |
| Glu, Asp, Gly | Method development w/in vivo sample testing | CE-LIF | Microdialysis | Glu: 70 nM Asp: 94 nM Gly: 11 nM |
[20] |
| D-Glu, L- Glu, D-Asp, L-Asp, D- Ser, L-Ser | Method development w/in vivo testing | CE-LIF | Microdialysis | D-Glu: 41.2 nM L-Glu: 32.3 nM D-Asp: 57.1 nM L-Asp: 40.3 nM D-Ser: 43.8 nM |
[21] |
| D-Ser, L-Ser, Tau, Glu, GABA | Method development w/ex vivo sample testing | CE-LIF | Microdialysis | D-Ser: 0.38μM⋄ L-Ser: 3.4μM⋄ Tau: 6.2μM⋄ Glu: 1.1μM⋄ GABA: 0.28μM⋄ |
[22] |
| Glu, Asp | Method development w/ex vivo sample testing | CE-LED-IF | Glu: 20.9 nM Asp: 23.1 nM |
[27] | |
| GABA, Glu, Asp, Tau | Method development w/in vivo testing | CE-LIF | Microdialysis | GABA: 8 nM Glu: 110 nm Asp: 25 nM Tau: 21 nM |
[23] |
| Asp, Glu, Ser, Gly, Tau, GABA, | Method development w/in vivo testing | LC-FLD | Microdialysis | Asp: 3 nM Glu: 3 nM Ser: 10 nM Gly: 10 nM Tau: 30 nM GABA: 10 nM |
[28] |
| Asp, Ser, Glu, Gly | Method development w/in vivo testing | LC-FLD | Microdialysis | < 5 nM | [29] |
| Ser, Gly, GABA, Glu | Method development w/in vivo testing | LC/MS/MS | microdialysis | 0.5–5 nM | [31] |
| Glu, Asp, GABA, Ser, Gly | Method development | Segmented flow-CE-LIF | Not reported | [24] | |
| Glu, Asp, Tau, Ser, Gly | Method development w/in vivo testing | CE-LIF | LFPP | Glu: 60 nM Asp: 57 nM Others: < 0.6μM* |
[25] |
| L-Glu, D- Glu, L-Asp, D-Asp, L- Ser, D-Ser | Method development w/testing of ex vivo samples | cLC-MS/MS | Glu: 0.65μM Ser: 0.96μM Asp: 1.9μM* |
[32] | |
| L-Glu, D- Glu, L-Asp, D-Asp, L- Ser, D-Ser | Method development | HPLC- MS/MS | Glu: 0.1 μM Asp: 0.2 μM Ser: 0.5 μM* |
[33] | |
| Glu, GABA | Method development w/testing of ex vivo samples | HPLC-FLD | Glu 6.8 μM* GABA 0.97μM* |
[30] | |
| Glu | Method development | Enzyme- modified biosensor | 0.1–20 μM | [34–43] | |
| Glu | Method development | Enzyme- modified biosensor | 10–20 nM | [44–46, 52] | |
| Glu | Method development w/in vivo testing | Micro- electrode array | 1 μM | [50, 51] | |
| Glu | Method development w/in vivo testing and pharmacological manipulation | Enzyme- modified biosensor | 0.1 μM | [47] | |
| Glu | Method development | Enzyme- modified biosensor | 50–100 μM* | [48, 49] | |
| Glu | in vivo testing w/pharmacological manipulation | Enzyme- modified biosensor | 5–18 μM⋄ | [71, 72] | |
| Glu | in vivo testing w/pharmacological manipulation | Micro- electrode array | 0.9 μM | [73] | |
| Glu | Method development | μ-fab flow cell for EC detection | Microdialysis | 5 μM* | [53] |
| Glu | Method development w/in vivo testing and pharmacological manipulation | FIA-EC | Microdialysis | 2.5 μM* | [54] |
| Glu | Method development w/in vivo testing | FIA-EC | Microdialysis | 30 nM | [55] |
| Glu | Method development w/testing on cultured cells | Enzyme- catalyzed luminescence | 10 nM | [56] | |
| Glu | Pharmacological manipulation of cultured cells | Enzyme- catalyzed luminescence | 10 nM | [57] | |
| Glu | Method development w/testing on ex vivo slices | Imaging of enzyme catalyzed luminescence | 50 μM* | [58] | |
| Glu | Method development w/testing on cultured cells | Enzyme- modified biosensor | 5 μM | [59] | |
| GABA | Method development w/testing of ex vivo samples | HPLC | 9.7 nM | [60] | |
| GABA | Method development w/testing of ex vivo samples | LC-MS | 48 nM | [61] | |
| Gly | Method development | CE w/dual LED-IF and EC | 0.8–2.5 μM | [62] | |
| Tau | Method development w/testing of ex vivo samples | CE w/on column derivatization | Direct sampling | 10 μM* | [63] |
| L-Ser, D-Ser | Method development | CE w/on column derivatization | 3 μM | [64] | |
| L-Ser, D-Ser | Method development w/in vivo testing | HPLC-FLD | Microdialysis | 2.5 μM* | [65] |
| L-Ser, D-Ser | Method development w/in vivo testing | LC/MS/MS | Microdialysis | 98 nM* | [66] |
| D-Ser | Method development w/in vivo testing | Enzyme- modified biosensor | 16 nM | [67] | |
| L-Ser, D-Ser | Method development w/testing of ex vivo samples | CE-LIF | 0.3 μM | [68] | |
| L-Ser, D-Ser | Method development w/testing of ex vivo samples | CE-LED-IF | 23–26 nM | [69] |
indicates lowest detected concentration.
indicates lowest concentration detected in vivo.
2.1 Multi-analyte detection
All the multi-analyte detection methods utilized at least one dimension of separation to resolve the sampled components of the extracellular space. In vivo detection would be performed by coupling to microdialysis or other sampling method. CE with fluorescence has emerged as a powerful method for detecting and monitoring neuroactive amino acids collected from in vivo sampling probes. The feasibility of rapid separations (<60 s) on small samples allows relatively high temporal resolution for monitoring. Many variations on CE have been published in the past few years. CE coupled to laser[11–25] or light emitting diode[26, 27] induced fluorescence (LIF or LED-IF) were the most commonly used techniques, taking advantage of the small volume of sample needed for CE injections and the high sensitivity of induced fluorescence. The researchers who chose LED-IF detection took advantage of low cost and relatively high power LEDs now available.[26, 27] The LODs reported by these researchers are comparable to those found with LIF. The purpose of many of these techniques was to develop new separations with improved LODs[15, 16, 23] or new, and more efficient, fluorophores.[11, 17, 19] These new fluorophores were 6-oxy-(N-succinimidyl acetate)9-( 2′-methoxycarbonyl) fluorescein,[11] o-phthaldialdehyde reacted with 5-((2-(and-3)-S-(acetylmercapto)succinoyl)amino)fluorescein,[17] and N-Hydroxysuccinimidyl fluorescein-O-acetate.[19] Sandlin et al. reported the detection of Glu and Asp on a microfluidic device which incorporated a precolumn reactor for derivatization with o-phthaldialdehyde, a flow-gated injector, and a separation channel.[12] Conventionally, the L enantiomer of the amino acids was assumed to be the only biologically active isomer; although, recently more researchers have explored the role of the D enantiomers. This new-found interest in the biological importance of D enantiomers resulted in research aimed at developing new methods for chiral separation of one or more amino acids.[13, 14, 21, 22] Benturquia et al.[18] developed a separation to detect Glu, Asp, GABA, and the anti-epileptic drug vigabatrin so that the pharmaco-kinetic effects of the drug on amino acid neurotransmitters could be measured. The desire to study the pharmacology of established or potential therapeutics was a motivator in the development of several multi-analyte methods discussed elsewhere in this review.
Although CE offers many advantages, research continues into applying and developing high performance liquid chromatography (HPLC) methods for monitoring in vivo samples. Several papers used LC coupled to fluorescence detection (FLD)[28–30] or MS[31–33] to resolve mixtures of amino acid neurotransmitters. LC systems are widely commercially available and can be very robust. Moreover, unlike the electroosmotic flow (EOF) of CE, which is dependent on the specific surface chemistry of the capillary and can be disrupted by coating of the surface during analysis of a series of samples, the pressure-driven hydrodynamic flow of LC occurs independent of the surface chemistry of the column, making it more stable than EOF and giving rise to more consistent retention times; although, run times for a single LC separation can be long. Therefore, reduction of separation time was a goal expressed by several authors[28–30] with the shortest reported by Silva et al.[30] who resolved GABA and Glu in 9 minutes. Two sets of authors sacrificed rapid separations in exchange for chiral separation of amino acid neurotransmitters,[32, 33] while Uutela et al.[31] improved LODs for LC/MS/MS by derivatization of either the amine or carboxyl group. However, smaller sample volumns and shorter term changes may be observed through the use of micro- or nano- scale LC as addressed in the neuropeptide section of this review.
LC is well suited to situations when sample volumes are not limited, as in the analysis of tissue homogenates.[30, 32] Sample volume requirements can place limitations on how LC can be used for in vivo neurotransmitter analysis. The column diameter and mass sensitivity of the detector conventionally mandate injection volumes on the order of 10–20 μL, meaning that 10–20 minute fractions must be collected for offline analysis and that only long term neurotransmitter changes can be observed.[28, 29, 31]
2.2 Glutamate
A majority of methods for the detection of Glu alone used EC by enzyme modified biosensors[34–49] or microelectrode arrays,[50, 51] that could be implanted for direct detection in vivo. Several sensors with LODs sufficient for in vivo monitoring were reported. These methods typically immobilize glutamate oxidase or glutamate dehydrogenase to the surface of a microelectrode. The hydrogen peroxide produced by the reaction of Glu with the glutamate oxidase or the downstream oxygen consumption caused by the dehydrogenation of Glu is detected by the electrode. A concern when using such a biosensor is detection of other electroactive species such as ascorbic acid, whose concentration in the extracellular fluid (~200 μM) is much greater than the concentration of Glu. Many authors sought to minimize such undesired interference through the use of electrode coatings like overoxidized polypyrrole,[41, 50, 52] Teflon,[42] thionine,[44] Nafion with polypyrrole,[51] and polyethyleneimine[47] and the development and characterization of new coating materials.[35] While they effectively exclude ascorbic acid and other electroactive species from the electrode, these coatings slow the diffusion the electroactive products of the enzyme reaction to the electrode surface, reducing both response times and sensitivity. Therefore, another common focus in biosensor development is improving sensitivity. Improvements in sensitivity can be accomplished through chemical modification of the electrode surface, such as the deposition of nanoparticles and/or nanotubes[36–38, 45] or polyethyleneimine[46]. Careful control of the amount of enzyme loaded onto the permiselective film is essential for optimal sensitivity.[40, 48] Sensitivity is strongly impacted by choice of substrate[34] and the purity of the enzymes.[49] Electrostatic immobilization of the enzyme together with a redox catalyst can also promote high sensitivity.[49] Improvement of the sensitivity and selectivity of Glu biosensors is a major focus of those who use these devices.
A handful of methods have been published in recent years which detect Glu through sampling coupled techniques[53–55] or in ex vivo or cell culture samples.[56–59] A pair of the sampling coupled methods address the improvement of temporal resolution in microdialysis monitoring. The authors preserved temporal information by high frequency (1 per minute) fraction collection followed by EC[54] or by the direct coupling of a microfabricated electrochemical cell to the outlet of a microdialysis probe to reduce longitudinal diffusion.[53] Biosensors can be used as the detection mode for separation techniques in addition to being directly implanted in tissue. Zhang et al. developed a biosensor, using neutral red doped silica nanoparticles as a high efficiency electron transfer medium, for use in flow injection analysis (FIA) analysis of Glu and other oxidase enzyme reactive species.[55] Schulvailo et al. prepared biosensors with 2.5–15 μm tip diameter that produced sufficient sensitivity to monitor efflux from single cells.[59]
Several groups present methods that allow the observation of Glu efflux in cell cultures or tissue slices through measurement of enzyme-catalyzed chemiluminescence.[56–58] Cells were cultured on 24 well plates for the purpose of high through-put drug screening.[56, 57] Tissue slices were harvested and placed on glass slides pretreated with enzymes and luminescence-substrate to image the effects of hypoxia on Glu release.[58]
2.3 Other amino acid neurotransmitters
LC and CE methods dominate those developed for individualized detection of GABA,[60, 61] Gly,[62] Tau,[63] and Ser.[64–66] The motivations for the methods that detected GABA, Gly, and Tau were diverse including automation of sample handling,[60] improvement of LODs,[61] simultaneous detection of amino acids, inorganic ions, and peptides,[62] and improvement of spatial resolution through direct sampling by the CE column with on column derivatization.[63]
Recent work has shown that serine racemase converts the L isomer of Ser to D and that D-Ser modulates N-methyl D-apartate (NMDA) Glu receptors.[8] Therefore, all methods for the detection of Ser, including sampling coupled techniques,[64–66] biosensors,[67] and ex vivo tissue analysis,[68, 69] were able to monitor the L and D entantiomers individually or the D entantiomer only. Chiral separations were accomplished through the addition of chiral stationary and pseudo-stationary phases to LC[65] and CE[64, 68, 69] separations. The two Ser enantiomers were also resolved by LC follow reaction with Marfey’s agent to form diastereomers for detection by MS/MS.[66] The D enantiomer was detected alone using a biosensor on which D-amino acid oxidase had been immobilized.[67] Most of those papers that reported single analyte detect of these other amino acid neurotransmitters had LODs low enough for in vivo work.
Efforts to separate D and L Ser also resolved the D and L enantiomers of other amino acid neurotransmitters (Table 1). Several D enantiomers of amino acids other than D-Ser have been reported in the CNS, including D-Asp and D-Glu.[70] D-Asp has been observed in the neonatal brain in high concentrations, but the role of other D amino acids has yet to be characterized.[70] Analytical methods which resolve the D and L enantiomers should facilitate increased understanding of the in vivo activity of the D amino acids.
2.4 Summary
Most recent method development work for the detection of amino acid neurotransmitters has focused on multi-analyte detection or on the detection of Glu, the primary excitatory neurotransmitter. Multi-analyte detection was accomplished using sampling coupled methods which offer diverse analysis modes for the separation of the complex mixtures found in the extracellular fluid. Some of the most common motivations for these works included improvement of LODs and the development and testing of new fluorophores. A number of methods report detection of Glu using enzyme modified biosensors with modifications to improve the selectivity and sensitivity of biosensors. Those methods which detected Glu by sampling coupled techniques, used either enzyme mediated EC or chemiluminescence. Testifying to the importance of multi-analyte detection, few papers singly detected another amino acid neurotransmitter other than Glu. The most prevalent research into one of the other neurotransmitters was the detection of the two enantiomers of Ser. This trend toward chiral detection was also found among some multi-analyte separation methods. The central role of amino acid neurotransmitters in neuronal processes predicts that improvements in the detection of those neurotransmitters will continue to be a focus of analytical chemists in the future.
3. Monoamines
The most important monoamine neurotransmitters are serotonin (5HT) and the catecholamines dopamine (DA), norepinephrine (NE), and epinephrine (EP). DA is the most abundant of the four monoamine neurotransmitters[71]. Central dopaminergic pathways have been associated with perceiving rewards and regulation of learning and feeding. As all drugs of abuse affect the DA system, much addiction research focuses on DA. NE and EP are both excitatory neurotransmitters and have been implicated the control of arousal, attention, mood, learning, memory and stress response.[72] 5HT exerts a pacemaker function in several regions of the brain during times of alertness, coordinates sensory and motor activity,[71] and contributes to proper execution of feeding, sleeping, and reproductive behaviors.[73] Dysregulation of 5HT systems has been implicated in depression, anxiety disorders, and schizophrenia.[71] Recent work for improved detection of monoamines is summarized in Table 3. Multi-analyte for catecholamines include both sampling methods and electrodes/biosensors; with the latter taking advantages of the easy oxidation of the monoamines. Likewise, the methods that detect DA singly are split between sampling coupled and electrochemical methods. No new methods for the detection of EP alone were published in the last five years and only a few detected NE or 5HT individually.
Table 3.
Reported in vivo dialysate concentrations of neurotransmitters as measured by microdialysis in rats unless otherwise noted.
| Neurotransmitter | Approx. extracellular concentration | Brain region |
|---|---|---|
| Glutamate | 1 μM[7], 1.4 μM[13] | striatum |
| γ-aminobutyric acid | 0.2 μM[7], 0.17 μM[13] | striatum |
| Glycine | 1.6 μM[7], 6 μM[13] | striatum |
| Aspartate | 0.3 μM[7] | striatum |
| Taurine | 26 μM[13] | striatum |
| L-Serine, D-Serine | 28 μM[13], 15 μM[13] | striatum |
| Dopamine | 26 nM,[74] 40 nM[75] | nucleus accumbens, striatum |
| Dorepinephrine | 12 nM[76] | striatum |
| Epinephrine | ~ 10% of NE[77] | Not reported |
| Serotonin | 70 nM[75], 68 nM[76] | striatum |
| Met-enkephalin | 127 ± 16 pM[78], 110, 50 pM[79] | striatum |
| Leu-enkephalin | 51 ± 9 pM[78], 36, 23 pM[79] | striatum |
| Dynorphin | 78 ± 7 pM[78] | striatum |
| β-endorphin | 109 ± 7 pM[78] | striatum |
| Endomorphin 2 | 1259 ± 297 pM[80] | spinal cord |
| Vasopressin | ~ 25 pM[81] | anterior pituitary |
| Corticotrophin releasing hormone | ~ 25–40 pM[81] | anterior pituitary |
| Growth hormone releasing hormone | 40 pg/mL[82, 83] ~ 8 pM | hypothalamus (cattle) |
| Somatostatin | 333 ± 8 pM[84] | striatum |
| Substance P | 23.5 pM[85] | CSF (human) |
| Neurokinin α | 2.31/2.24 nM[86] | CSF (human) |
| Neuropeptide tyrosin | 26.1 ± 3.5 pM[87] | ventral stiatum |
| Vasoactive intestinal polypeptide | 25.5 ± 7.5 pmol per gram of tissue[88] | cerebral cortex tissue |
| Neurotensin | 49.7 ± 7.0 pM[87] | ventral stiatum |
| Nociceptin/orphanin FQ | 63 ± 12 pM/60 ± 8 pM [89] | hippocampus/thalamus |
| Cholecystokinin | 2.3 ± 0.1 pM[90] | anterior cingulated cortex |
| Galanin | 7.9 pM[91] | spinal cord |
| Hypocretins/orexins | ~ 60 pM (BF) ~ 75 pM (HYP) ~ 45 pM (LC) [92] |
basal forebrain, perifornical hypothalamus, and locus ceruleus |
| Angiotensin | 46 pM [93] | globus pallidus/ventral pallidum |
| Acetylcholine | 0.4–4 nM,[94] 2.8 μM[95] | hippocampus, prefrontal cortex |
| Adenosine triphophosphate | 0.5–10 μM[96] | dorsal spinal horn (frog) |
| Adenosine | 200 nM[97] | Not reported |
| Nitric oxide | 92 nM[98] | striatum |
3.1 Multiple Monoamine Detection
Recently published multi-analyte detection methods were evenly split between electrodes/biosensors and microdialysis coupled techniques; analysis of ex vivo tissue preparations was addressed in two papers. Detection of monoamines by electrochemical methods does not require the immobilization of enzymes on the surface of an electrode. Rather, they can be detected through a variety of electrochemical methods, including amperometry and voltammetry. Voltammetry can be especially useful for the simultaneous detection of monoamines. An analyte produces a unique set of oxidation and reduction peaks at given potentials and number of techniques can be used to resolve the peaks of several analytes using either surface modifications or statistical methods. These electrodes offer good spatial resolution (1–30 μm in diameter); the temporal resolution of an electrode could be between 100 ms and 30 s depending on the method chosen. As with all electrochemical techniques, exclusion of interferences or resolution of analyte signal from that of ascorbic acid and other electroactive compounds is essential. A number of conditions have been reported to detect monoamines in the presence of ascorbic acid. DA, 5HT, and ascorbic acid were resolved on unmodified edge plane pyrolytic graphite electrodes[74]; on electrodes modified with multiwall carbon nanotubes (MWCNTs) and polyethylenimine[75]; and on electrodes modified with a Nafion coating and platinum nanoparticles.[76] Good electrocatalytic activity and resolution of DA and 5HT were also achieved by immobilization of 5-hydroxytryptophan on the electrode surface.[77] Surface modifications, such as MWCNTs poly(methylene blue)[78] and silver-doped poly(L-glutamic acid)[79] or the use of a nanotube ceramic composite electrode[80] have been used to resolve DA, EP, and ascorbic acid. The modification of the electrode surface with 2,3-dimercaptosuccinic acid resolved DA and EP.[81] A biosensor that was able to resolve DA, EP, and NE in the presence of ascorbic acid was developed using a commercial preparation of laccase.[82] These papers were generally motivated by the ability to achieve multi-analyte detection, and as a result, the ability to achieve LODs which were lower than the published basal concentrations (Table 2) was mixed. However, those methods with higher LODs offer good foundations for future method improvement.
Fast scan cyclic voltammetry (FSCV) is a variant of voltammetry which has been effective in multi-analyte detection of catecholamines. In FCSV, the voltage of a microelectrode is rapidly cycled between a positive and negative voltage at high rates, typically >100 V/s, and the current from the oxidation and reduction of analytes at the electrode is monitored. FSCV is most often performed on bare electrodes, which have faster electron transfer and less signal dampening than modified electrodes. FSCV can provide high spatial resolution since the diameter of the electrodes are usually in the low μm range[83] and the rapid scanning limits the diffusion distance to the electrode. FSCV also generates high temporal resolution with scans performed at frequencies around 1 per 100 ms. The high frequency cycling minimizes electrode fouling and perturbation of the biological system being monitored.[84] Careful and accurate background subtraction is required to eliminate the signal from capacitance build-up at the electrode surface during the rapid scans[84] and current from other in vivo electroactive species, such as ascorbic acid. Background drift limits the length of observations by FSCV to 90 second periods. Nevertheless, FSCV can be a powerful technique for the observation of rapid changes in vivo and has been used to achieve multi-analyte detection of monoamines. Several groups have achieved multi-analyte detection of catecholamines while pursuing improvements to FSCV as a technique. DA and 5HT have been detected simultaneously using FSCV through the application of a Hilbert transform to minimize the influence of the background.[84] Heien et al.[85] used principle component analysis (PCA) to develop a method for deconvoluting the contributions of multiple analytes and the background. The PCA method allowed them to monitor vesicular release events of adrenal medullary cells and distinguish the release of NE from EP. Huffman and Venton characterized the ability of the precursor material, from which carbon electrodes are prepared, to affect the kinetics of electrode operation.[86] Strand and Venton found that flame etching the electrode surface produced higher surface area and more sensitivity than electrochemically etched or untreated electrodes.[83] Recent publications show that the electroactivity of the catecholamines can be capitalized on to achieve effective multi-analyte detection whether on bare or modified electrodes.
A number of microdialysis coupled detection methods for catecholamines have been developed. Microdialysis coupled methods are capable of long term monitoring, and depending on the conditions chosen, are capable of achieving temporal resolution in the seconds to minutes range, although conventionally temporal resolution has been limited to 10 to 20 minutes due to injection volume requirements of the analysis technique. LC-EC or CE-EC are commonly chosen analysis modes for catecholamines in dialysate because an initial separation step simplifies simultaneous EC of multiple catecholamines by resolving them in time. Several groups pursued improvements to the usual protocols used for LC-EC or CE-EC with enhancements for the EC detection step. These enhancements included testing a melanin-type polymer as a new electrode coating to improve sensitivity[87] and developing a poly(dimethylsiloxane) (PDMS) microfluidic device for performing CE and glucose oxidase based biosensor detection.[88] Jung et al.[89] detected DA and 5HT using LC coupled to a novel detection mode, photoluminescence following electron transfer (PFET), for high sensitivity without the possibility of electrode fouling.
Separations of monoamines have also been coupled to ultraviolet (UV), fluorescence, and MS for detection. Lin et al.[90] published a thorough analysis of CE separation modes and conditions that could be used for chiral separations of catecholamines and detection by UV absorbance. Yoshitake et al.[91] developed a separation for resolving DA, 5HT, NE, and their metabolites using an uncommon dual derivatization scheme using benzylamine and 1,2-diphenylethylenediamine, which produced stable derivatives for FLD. MS can be particularly well suited to detection of components with low abundance such as monoamines and their even lower concentration metabolites. The sensitivity of MS caused it to be chosen for the detection of monamines in dialysate following diethyl labeling[92] and offered the possibility of observing phase II reaction metabolites of monoamines.[93]
Many authors focused on developing techniques that could detect a group of catecholamines together with a stimulating compound so that the pharmacology of normal and disease states could be monitored. Potential neurotoxins, previously correlated to the development of Parkinson’s disease, were detected together with DA and 5HT,[94] DA and NE,[95] or DA, NE, and 5HT.[96, 97] A similar approach was used to develop methods for monitoring the response of catecholamines to treatment with GABA[98] or tetrahydrobiopterin, a catecholamine synthesis cofactor.[99]
A pair of studies investigated better analysis of ex vivo tissue homogenates. Vlckova et al.[100] developed a microfluidic device for the detection of DA and 5HT by CE-EC. Powell et al.[101] showed that the catecholamine composition of drosophila heads could be reproducibly analyzed using a newly developed microhomogenizer and CE-EC method. Drosophila are a common model system because their genetics are easily manipulated; however, the small size of their CNS presents a challenge for sampling methods.
3.2 Dopamine
A wide array of methods for the detection of DA alone, using both electrochemical and sampling coupled techniques, has been published recently. Nearly all of the electrochemical methods focused on method development rather than in vivo monitoring. Indeed, most of these papers report LODs which are above the basal concentrations shown in Table 2. A primary concern for the EC of DA, as with the detection of Glu at biosensors, is exclusion of interfering species. The need for better electrode selectivity motivated the testing of a large and varied group of electrode modifications. DA was detected in the presence of ascorbic acid by use of surface modifications including clinoptilolite with Nafion,[102] iron nanoparticles dispersed in Nafion,[103, 104] single wall carbon nanotubes with Nafion,[105] MWCNTs which incorporated β-cyclodextrin,[106] cobalt phthalocyanine,[107] a mixture of gold and palladium nanoparticles,[108] tyrosinase,[109] cysteine,[110] poly(p-toluene sulfonic acid),[111] iron porphyrin immobilized in a niobium oxide silica gel,[112] polyanaline,[106] 3,5-dihydroxy benzoic acid,[113] melanic polymers electrogenerated from catecholamines,[114, 115] a carbon nanoparticle–poly(diallyldimethylammonium chloride) film,[116] polycarbazole and poly(carbazoleco-p-tolylsulfonyl pyrrole),[117] a cetylpyridine bromide/chitosan composite film,[118] and a calix[4] arene crown-4 ether film.[119] Interference of ascorbic acid with the detection of DA was also eliminated by the development of a dual amperometric and conductometric device.[120] Multivariate calibration methods have also be useful in separating the signal due to DA from that of ascorbic acid.[112]
While surface modifications and coatings can be effective at reducing interference, they also often decrease the efficiency of electron transfer to the electrode surface. Therefore, several groups developed surface-modifications intended to improve electrode sensitivity. These modifications included modifying a carbon paste electrode with gold nanoparticles[121] and the development of sol-gel polymers molecularly imprinted with a DA template.[122] Gold substrate electrodes were proposed as an inexpensive alternative to the carbon electrodes commonly used for DA detection.[123] Although gold electrodes were found to be less sensitive than the carbon fiber electrodes, they offer easy platforms for surface modification and could provide complimentary information if incorporated into microarrays with carbon-based electrodes.[123]
In some cases, enzymes are used to improve the selectivity of an electrode for DA. The selection of a biocompatible polymer for the adhesion of an enzyme or other surface modification to an electrode can enhance the useful lifetime of a sensor. Guar gum and agarose composite membranes[124] and eggshell membranes[125] were both found to be effective and biocompatible means of attaching tyrosinase to an electrode.
As discussed previously, FSCV can provide high temporal and high spatial resolution monitoring of catecholamines; however, the length of the monitoring window is limited to less than 90 seconds by significant background drift due to capacitance build up at the electrode surface. Hermans et al.[126] report that this constraint can be eliminated by analog background subtraction. They developed a novel circuit (Figure 1) which allows a background voltamagram to be recorded and its inverse to be played back during recording of future scans. Background drift still occurs but it is a far less significant component of the signal than it would be with conventional techniques. Therefore, principle component regression can be used to resolve DA and pH dynamics from the changing background. DA was monitored in vivo for 30 minutes following intravenous administration of cocaine using this method. With this analogue subtraction technique, both the high temporal resolution of FSCV and the long term monitoring of microdialysis coupled methods can be realized in a single detection system.
Figure 1.

Electronic setup for analog background subtraction reported in [126]. The background is subtracted in a two-step process. First step: acquisition of background signal. The waveform is applied to Ein while the other input (E1) is disconnected and the current at the working electrode (I2) is transduced to a voltage (E3). Second step: subtraction of background signal. The triangular waveform is applied to Ein while the background signal which was recorded during the first step (E3) is applied to input (E1). The current obtained at the working electrode (I2) is canceled out at the summing point resulting in a flat signal at the output (E3).
Studies on the sampling coupled methods of CE, LC, and FIA for the detection of DA include both method development and in vivo testing experiments. Most incorporated EC detection. Many researchers chose to detect DA with microfluidic devices,[127–134] the use of which can reduce sample and reagent consumption as compared to conventional scale methods. Many of these techniques aimed to improve the detection of DA at an electrode. These innovations included improving electrode selectivity by modifying the electrode surface with a self-assembled monolayer of 3-mercaptopropionic acid,[131] increasing the coulometric efficiency by the amplifying electrode roughness through in-channel electrochemical deposition,[128] and extending the functional lifetime of an EC detection cell, while decreasing interference from anions in aqueous solution, through preparation of a hydrogel salt bridge.[127] In several cases, CE was incorporated onto the device together with an electronically decoupled EC detector;[129, 130, 132] Mecker and Martin[130] monitored dialysate from cell culture samples for 8 hours with their CE-EC device. Chen et al. coupled a reaction capillary of ascorbic acid oxidase immobilized on a monolithic sol-gel to a microfluidic EC device so that DA could be monitored in the prescence of ascorbic acid.[133] Migheli et al.[134] report a device for experiments on cell culture samples which incorporates two microdialysis capillaries, one each for treatment and control, which are followed by separate EC DA sensors.
EC was also used to detect DA following LC[135, 136] and FIA.[137] Two of these methods were developed to observe the effects of L-DOPA[135] and nitric oxide (NO)[136] on DA and its metabolites. Leu and Lin[137] present an alternative method for elimination of electroactive interferents during the FIA-EC detection of DA. They introduced the oxidant lithium manganese (III, IV) oxide to the sample stream to oxidize DA to dopaminequinone, which was then detected electrochemically without interference.
An exception to the trend toward the EC of DA is the work by Shou et al.,[138] which used CE-LIF to detect DA in dialysate. DA was resolved from other dialysate components in 90 s and the identity of the DA peak was confirmed pharmacologically.
Most newly reported methods did not achieve LODs that would be sufficient to detect DA from in vivo samples of brain extracellular space; however, several new methods were successfully applied to in vivo samples (Table 3).
Detection of the small quantity of DA release events in cell cultures or by single cells presents distinct analytical challenges. DA was detected in cell culture samples by chemiluminescence imaging[139] and CE-EC on a microfluidic chip.[140] Both of these papers focused on the detection of DA in cell cultures due to their potential as platforms for initial drug screening. Shinohara and Wang [139] reacted DA with tyramine oxidase followed by luminol to chemiluminescently monitor DA release events. Cheng et al. designed a device for CE separation with off-column EC detection for the detection of DA in cell extracts.
3.3 Norepinephrine and Serotonin
Methods for the individual detection of monoamine neurotransmitters other than DA were limited to a biosensor for the detection of NE[141] and two microdialysis coupled techniques for monitoring 5HT.[142, 143] As when EC is used for other analytes, interfering species were a concern for the detection of NE; a DNA membrane doped with gold nanoparticles was applied to the electrode to detect NE in the presence of ascorbic acid.[141] Benturquia et al.[142] developed a CE-LIF method for monitoring 5HT without sample derivatization using native fluorescence produced by a 266 nm laser. Parrot et al.[143] used a capillary scale LC-EC system to monitor 5HT in dialysate with minimal sample consumption.
3.4 Summary
New methods for the detection of monoamines were dominated by multi-analyte and DA detection methods. Multi-analyte methods offer the ability to monitor the effects of a stimulus on the monoamines as a whole. Multiplexed detection may be performed with microsensors and sampling coupled techniques. LODs acceptable for the in vivo detection of basal concentrations were achieved with both EC and sampling techniques, though such LODs were typically found for methods that were tested in vivo. In methods which detected monoamines singly, EC detection, whether by a microelectrode or biosensor eligible for direct implantation into the brain or coupled to a separation technique, was the most common mode of detection. Several authors developed methods that could detect monoamines together with suspected disease causing compounds or potential drug candidates so that their effects on the monoamines could be studied. Analog subtraction for FSCV is an exciting development for the detection of DA and offers the promise of longer lasting high temporal resolution monitoring. The monoamines have been implicated in multiple circuits in the CNS that are of great interest for the neuroscience community. The pivotal role of monoamines in the CNS will continue to drive researchers to develop improvements to methods available for their detection.
4. Neuropeptides
Neuropeptides constitute the largest family of neuromessengers in the CNS, serving as neurotransmitters or neuromodulators. Determining in vivo neuropeptide levels has been challenging due to their low concentrations in brain (1–100 pM), low recovery of peptides by microdialysis (<20% typically), small volume of dialysate generated and the difficulty in sample storage. Immunoassays such as radio immunoassay (RIA) or enzyme immunoassay (EIA) are common detection methods. Although they can achieve LOD at 100–500 attomole level, cross reactivity commonly reduces specificity. Newer approaches with LC, CE and MS have been developed in the last decade for detecting and quantifying neuropepides; however, reports for real in vivo measurements are still limited. A variety of interesting new methods were developed that were not applied to in vivo measurements, but represent novel analytical developments that may eventually impact in vivo work.(Table 4) This review of neuropeptide analysis methods follows the grouping of Hökfelt.[144]
Table 4.
Summary of monoamine neurotransmitter detection methods and their LODs.
| Analytes | Experiment Type | Detection method | Sampling technique (if applicable) | LOD | Reference |
|---|---|---|---|---|---|
| DA, 5HT | Method development | Microelectrode | DA: 90 nM 5HT: 60 nM |
[101] | |
| DA, 5HT | Method development | Microelectrode | DA: 1 μM* 5HT: 100 nM* |
[111] | |
| DA, 5HT | Method development | Surface-modified microelectrode | DA: 0.3–0.9μM 5HT: 1.7 μM |
[102, 104] | |
| DA, 5HT | Method development | Surface-modified microelectrode | DA: 8 nM 5HT: 500μM* |
[103] | |
| DA, 5HT | Method development w/testing on ex vivo samples | Microelectrode | DA: 8 nM 5HT: 0.25μM* |
[112] | |
| DA, EP | Method development | Surface-modified microelectrode | DA: 67 μM EP: 69 μM |
[105] | |
| DA, EP | Method development | Surface-modified microelectrode | DA: 0.2–0.5μM EP: 0.8 –3.5μM |
[106, 108] | |
| DA, EP | Method development | Microelectrode | Not reported | [107] | |
| DA, EP, NE | Method development | Microelectrode | 1 μM* | [113] | |
| DA, EP, NE | Method development | Enzyme-modified biosensor | DA: 0.2 μM EP: 0.3 μM NE: 0.4 μM |
[109] | |
| DA, EP, NE, 5HT | Method development w/in vivo testing | Microelectrode | DA: 10 nM EP: 1 μM* NE: 1 μM* 5HT: 0.5 μM* |
[110] | |
| L-NE, D- NE, L-EP, D-EP | Method development | CE-UV | NE: 0.12 mM* EP: 0.11 mM* |
[117] | |
| DA, 5HT, NE | Method development w/in vivo and ex vivo testing and pharmacological manipulation | LC-FLD | Microdialysis | 0.2–0.3 nM | [118] |
| DA, 5HT | Method development w/in vivo testing & pharmacological manipulation | LC-EC | Microdialysis | DA: 0.5 nM 5HT: 0.25 nM |
[75] |
| DA, NE | Method development w/in vivo testing & pharmacological manipulation | LC-EC | Microdialysis | DA: 0.25–1 nM NE: 0.2–0.25 nM 5HT: 0.4–2.5 nM |
[76, 124] |
| DA, NE, 5HT | Method development w/in vivo testing & pharmacological manipulation | LC-ED | Microdialysis | DA: 0.1–0.25 nM NE: 0.2–0.25 nM 5HT: 0.3–0.5 nM |
[121–123] |
| DA, 5HT | Method development w/in vivo testing & pharmacological manipulation | LC-PFET | Microdialysis | DA: 180 pM 5HT: 150 pM |
[116] |
| DA, NE, 5HT | Method development w/in vivo testing & pharmacological manipulation | LC/MS/MS | Microdialysis | DA: 10 nM NE: 10 nM 5HT: 5 nM |
[119] |
| DA, NE, EP | Method development w/testing in vivo and ex vivo samples | LC/MS/MS | Microdialysis | DA: 0.25 nM NE: 5 nM EP: 5 nM |
[120] |
| DA, 5HT, EP | Method development | CE-EC on microfluidic chip | Microdialysis | DA: 1.6 μM 5HT: 2.0 μM EP: 2.5 μM |
[115] |
| DA, EP, NE | Method development | CE-EC | DA: 0.9 μM EP: 1.0 μM NE: 0.8 μM |
[114] | |
| DA, 5HT | Method development for ex vivo sample prep and analysis | CE-EC | 100 μM* | [126] | |
| DA, NE, EP | Method development & ex vivo sample testing | CE-EC on microfluidic chip | DA: 1.7 μM EP: 0.45 μM |
[125] | |
| DA | Method development | Hybrid-mode electrode array | ≥ 100 nM* | [145] | |
| DA | Method development | Surface modified electrode | 5–80 nM | [127, 130, 131, 133, 138–141] | |
| DA | Method development | Surface modified electrode | 0.2–3.4 μM | [128, 129, 132, 134–136, 142, 144, 146, 147, 149, 168] | |
| DA | Method development | Surface modified electrode | 25–51 μM | [137, 150] | |
| DA | Method development | Surface modified electrode | 80 μM* | [143] | |
| DA | Method development | Microelectrode | 10 μM* | [148, 169] | |
| DA | Method development | Microelectrode w/analogue background subtraction | Not reported | [151] | |
| DA | Method development w/in vivo testing & pharmacological manipulation | CE-LIF | Microdialysis | 2 nM | [74] |
| DA | Method development | Microfluidic chip based electrochemical cell | 2 μM | [152] | |
| DA | Method development | CE-EC on microfluidic chip | 60–650 nM | [153, 154, 157] | |
| DA | Method development w/testing on cell cultures | CE-EC on microfluidic chip | Microdialysis | 9 μM | [155] |
| DA | Method development | FIA-EC on microfluidic chip | 74 nM | [156] | |
| DA | Method development | Reactor column- EC | 100 nM | [158] | |
| DA | Method development w/testing in cell culture | Surface modified electrode | Microdialysis | ≤ 25 nM | [159] |
| DA | Method development | FIA-EC | 0.2 μM | [162] | |
| DA | Method development w/in vivo testing & pharmacological manipulation | LC-EC | Microdialysis | 2.5–5 nM | [160, 161] |
| DA | Method development w/testing in cell culture | chemiluminescent imaging | 10 nM | [163] | |
| DA | Method development w/testing in cell culture | CE-EC on microfluidic chip | 59 nM | [164] | |
| NE | Method development | Surface modified electrode | 5 nM | [165] | |
| 5HT | Method development w/in vivo testing & pharmacological manipulation | CE-LIF | Microdialysis | 0.25 nM | [166] |
| 5HT | Method development w/in vivo testing & pharmacological manipulation | LC-EC | Microdialysis | 56 pM | [167] |
indicates lowest detected concentration.
4.1 Opioid peptides
There are three families of endogeneous opioid peptides based on their precursors: methionine-enkephalin (ME) and leucine-enkephalin (LE) derived from proenkephalin; dynorphin A and B (Dyn A and B) from pro-dynorphin and β-endorphin (BE) from pro-opiomelanocortin. They have different affinities toward three opioid receptor families (μ,δ and κ). In 1997,[145] another two endogeneous peptides endomorphin 1 and 2 (EM1 and EM2) were discovered, also showing high and selective affinity for μ-opioid receptor. However, they are not derived from the above precursors, but via an unknown pathway.
Enkephalins are among the most studied neuropeptides with analytical chemistry methods. Microdialysis coupled with RIA has been the primary method of choice;[146] however, other methods have been developed more recently. In one study, capillary LC column with 25 μm i.d. was used to obtain over 100 fold on-column concentration to reach detection limits as of 20 pM for ME.[147] This sensitivity allows it to be combined with microdialysis for monitoring ME in vivo with 5 min temporal resolution. Another group coupled HPLC with EC, and monitored ME, LE, EM 1 and 2 simultaneously in push-pull perfusates.[148] Capillary LC has also been interfaced to MS2 and MS3 for ME and LE detection.[149–152] With MS3 on a linear ion trap mass spectrometer, the LOD was improved to 0.5 pM for LE. In this study, it was also found that adding 5% acetic acid to microdialysates could prevent ex vivo degradation of the neuropeptides during storage, which allowed reliable off-line detection of the dialysate fractions.[149] This method has been proven to be effective to several neuropeptides including enkephalins, neurotensin (NT) and dynorphins (Dyn). To prevent sample degradation, adding protease inhibitors could be another choice.[153, 154] Otherwise, on-line detection[150] or same day detection[148] were needed to minimize degradation. Most capillary LC methods are presently limited to analysis of dialysis fractions at 20 min temporal resolution. Faster methods, like CE, are also under development;[155–158] however, the sensitivity still limits its applicability to in vivo measurements. Developing effective preconcentration methods such as adding a prior solid phase extraction (SPE) column[159] may be helpful.
Dyn are another class of opioid peptides including different sub-family peptides. When the precursor prodynorphin is cleaved, multiple active peptides are released: Dyn A, Dyn B, and α/β-neo-endorphin. Among these forms, dynorphin A1-8 (Dyn A1-8) was studied the most. Microdialysis coupled with RIA was first used to measure Dyn A1-8 release in the nucleus accumbens.[160] Li and colleagues detected it together with ME and LE in rat brain with LC-MS3 method.[149]
A more difficult challenge is BE because it is a bigger peptide with 34 amino acids. Microdialysis coupled with RIA was launched successfully for measurement of it together with ME and Dyn A1-8.[161] For methods involving MS, the LOD for intact BE was too high for in vivo measurement; however, with trypsin digestion and measurement of a characteristic fragment peptide of BE, in vivo BE levels could be estimated indirectly.[149, 162]
Although the origin of endomorphins (EM) is still not completely clarified, several methods have been developed for them. Researchers have measured them together with enkephalins, and successfully tested the concentrations in rat spinal cord using HPLC coupled to EC.[148] Separation of EM and other opioid peptides have also been developed with CE and coupled to UV detection and electrospray ionization (ESI)-MS[163] or by on-line SPE-CE-ESI-MS.[164] These data were obtained from human plasma samples but not brain samples.
4.2 Hypothalamic hormones
Researches on hypothalamic hormones oxytocin (OXT) and vasopressin (VP) revealed exciting results in the field of neuroendocrinology. OXT plays important roles in female reproduction,[165] social recognition,[166, 167] trust,[168] sexual behaviors,[169] and maternal behaviors.[170] VP is also shown to have a role in various systems.[171] Both of the peptides have similar structures with a sulfur bridge in their molecules, which can complicate detection.
Release of OXT in the hypothalamic paraventricular nucleus (PVN) was measured via microdialysis-RIA.[172] In this study, effect of maternal defense on relative OXT level changes was shown without giving a basal concentration. VP level could also be measured with RIA.[173] LC-MS methods for detection of OXT and VP are still under development and no in vivo data has been reported due to lack of sensitivity. To effectively analyze low level peptides in vivo by commonly used ESI-MS, the LOD must be improved upon. Muddiman group has looked into modification of peptides containing disulfide bond with hydrophobic tagging,[174, 175] taking advantage of higher ESI efficiency for more hydrophobic molecules. With the ALiPHAT strategy (augmented limits of detection for peptides with hydrophobic alkyl tags), 2–3 fold better sensitivity was achieved for such peptides. Meanwhile, an improvement of nano-ESI emitter tips was developed to increase detection sensitivity toward OXT and other peptides like neuropeptide tyrosine (NPY) by hydrophobic polymer coating on the tip.[176] With further improvement of the LC-MS system, detecting of OXT and VP in vivo might be feasible in future.
4.3 Hypothalamic releasing and inhibiting hormones
Corticotropin releasing hormone (CRH) acts on cells in the anterior lobe of the pituitary to release adrenocorticotropic hormone. Growth hormone releasing hormone (GHRH) stimulates cells in the anterior lobe of the pituitary to secrete growth hormone. Thyrotropin releasing hormone (TRH) regulates secretion of thyrotropin.[177] Somatostatin (SOM) acts on the anterior lobe of the pituitary to inhibit the release of growth hormone and thyroid-stimulating hormone.[178, 179] These hormones and neuropeptides likely have other functions as well.
No LC-MS or CE methods have been developed for these peptides yet. This may be because the peptides are relatively large which tends to decrease ionization efficiency and make them difficult to be detected by electrochemistry or fluorescent labeling. RIA was the main mode for their detection. CRH levels were measured, together with VP, by push-pull sampling and RIA in rat brain.[173] GHRH was measured in cattle plasma together with SOM.[180, 181] For TRH, Pekary and colleagues did a series of studies on relative TRH and TRH-like peptides level changes in various rat brain region tissue with HPLC-RIA under different drug treatment.[182–184] And SOM levels in the rat nucleus accumbens (NAc) was investigated, showing release evoked by chronic administration of antidepressants.[185]
4.4 Tachykinins
Perhaps the most well-known tachykinin peptide is substance P (SP). SP plays a variety of important roles, as summarized in previous reviews.[186, 187] Earlier reports using RIA combined with a high-recovery liquid-liquid extraction has measured SP in human cerebral spinal fluid (CSF), which compared the SP level between control group and patients with chronic pain.[188] Research is ongoing to find a better method that overcomes the disadvantages of RIA. Combination of CE with matrix assisted laser desorption ionization–time of flight–mass spectrometry (MALDI-TOF-MS) was used to determine SP in rat brain tissue.[189] The method was suitable for analyzing SP in the μM range. The detectability of SP can be extended to 100 pM level by using CE-LIF with naphthalene-2,3-dicarboxaldehyde (NDA) derivatization; this method was used for quantification of SP in saliva samples.[190] Later, an HPLC-ESI-MS/MS method was developed for measuring tissue levels of SP in spinal cord,[191] giving LOD at 10 fmol injected on column (~667 pM). With LC-MS/MS, SP metabolites were also measured with bovine brain microvessel endothelial cell (BBMEC) system.[192]
Another group of tachykinin peptides is neurokinin α and β (NKA and NKB). Pharmacological effects of NKA and NKB mainly include algogenic actions, which are associated with increased capillary permeability, production of edema, and the initiation of pain and associated reflexes.[193, 194] Reports of a CE-LIF method demonstrated separating and determining NKA[195] and NKB[196] in human body fluids.
4.5 Neuropeptide tyrosine family
NPY has been associated with a number of physiologic processes in the brain, including the regulation of energy balance, memory and learning, and epilepsy.[197, 198] The main effect is increased food intake and decreased physical activity.[199, 200] For measurement of NPY in plasma, HPLC-ESI-MS, with a cation exchange sample clean-up procedure, was utilized.[201] For measurement in rat brain, microdialysis coupled with RIA was carried out for monitoring dynamic changes of NPY and NT with amphetamine treatment.[202]
4.6 Vasoactive intestinal polypeptide-glucagon family
Vasoactive intestinal polypeptide (VIP) induces smooth muscle relaxation,[203] causes inhibition of gastric acid secretion and absorption from the intestinal lumen.[204] It also helps to regulate prolactin secretion.[205] Studies have mainly focused on the function of VIP, and there were few papers about the measurement of its in vivo level. Early in 1992, CE and micellar electrokinetic chromatography using a commercial CE instrument with UV detection were used to analyze VIP-rich fractions from cerebral cortex of rat brain.[206] No recent improvement of the method was found.
There are many other neuropeptides not included in the above families that also play essentials roles in CNS.
4.7 Neurotensin
NT is a 13 amino acid peptide that has significant interaction with the dopaminergic system[207] and is indicated to play a role in the regulation of luteinizing hormone and prolactin release.[208, 209] For in vivo monitoring of NT, microdialysis coupled with RIA was used.[202] For more efficient and faster separation, a CE method has been developed and conditions were optimized for quantitative analysis of neuropeptides in human plasma.[210] Separation of NT together with SOM, VP and TRH in plasma by CE was achieved with LOD at the 4.5 nM for NT. Coupling CE to MS led to lower sensitivity for NT. A method based on CE coupling with ESI-MS was established obtaining LOD in the range of 0.10–0.60 μM.[211] An LC-MS method resulted in LOD of NT at about 600 pM.[212] Both reports did not report LODs necessary for in vivo measurement. However, one report was successful on measuring NT from human CSF samples.[196] This method utilized CE-LIF to determine some peptide hormones and their fragments and established a transient pseudo-isotachophoresis (pseudo-tITP) preconcentration in this study. LODs were found to be 0.04, 0.1, 0.2, and 0.08 nM for neurotensin8-13 (NT8-13), NT, NKB, and chrolecystokinin-4 (CCK-4), respectively. This method was validated and applied to quantitative analysis of NT and NT8-13 in human CSF sample.
4.8 Nociceptin/orphanin FQ
Nociceptin/orphanin FQ (N/OFQ) exerts a variety of biological functions, including modulation of nociception,[213] stress responses and anxiety,[214] and learning and memory.[215, 216] A microdialysis-RIA method has been developed allowing measurement of N/OFQ release from the hippocampus and thalamus of freely moving animals.[217] This study indicated that kainite seizures caused a twofold increase in N/OFQ release followed.
4.9 Chrolecystokinin
Chrolecystokinin (CCK) is well known as involved in pain modulation especially regarding anti-opioid mechanisms.[218] Microdialysis coupled with RIA was chosen for monitoring CCK levels in rat brain regions like the anterior cingulate cortex (ACC).[219, 220] It was found that at the time when the animals are known to show pain-related behavior, CCK release is elevated in the ACC in awake rats.
4.10 Galanin
Galanin is involved in a number of physiological processes such as regulation of food intake, and regulation of the release of other neurotransmitters and hormones.[221, 222] Quantification of galanin was conducted using protein precipitation and LC-MS with LOD at the nM level.[223] An in vivo study on microdialysis samples from rat brain was achieved with RIA[224] or by coupling LC with RIA to produce an LOD at the pM level.[225]
4.11 Calcitonin gene-related peptide
Calcitonin gene-related peptide (CGRP) is thought to play a role in cardiovascular homeostasis, nociception, glucose uptake and the stimulation of glycolysis in skeletal muscles.[226] For measurement of CGRP, a novel microdialysis probe was constructed and coupled to capillary electrochromatography (CEC) to detect it from human skeletal muscle.[227]
4.12 α-Melanocyte-stimulating-hormone
α-Melanocyte-stimulating-hormone (α-MSH), produced in the anterior pituitary (AP), is an anorexigenic peptide, which acts in the CNS to regulate appetite.[228] It also stimulates the production and release of melanin by melanocytes in skin and hair.[229, 230] To analyze the effects of α-MSH at skin, a dermal microdialysis probe was planted in dorsal skin of rats for recovering of peptides like α-MSH and SP. EIA was used for measurement.[231]
4.13 Hypocretins/orexins
Hypocretins (Hcrt), including a pair of peptides (Hcrt-1 and -2), are synthesized in the perifornical and lateral hypothalamus and stimulate food intake, wakefulness and energy expenditure.[232] Microdialysis-RIA was chosen for monitoring them in the rat brain during waking and sleep states.[233]
4.14 Angiotensin
The angiotensin (Ang) family includes 4 types of peptides, generally known as hormones, that can also be counted as neuropeptides. They cause vasoconstriction, increase blood pressure, and release of aldosterone from the adrenal cortex.[234] Lanckmans’ group has made efforts to detect angiotensin IV (Ang IV) in vivo with nano-LC-MS system by developing a reliable quantification method with an internal standard.[235] They attempted to measure stimulated Ang IV level from rat brain dialysate samples.[236] However, the sensitivity was still a little low for measuring basal level of Ang IV so an estimation was made using the zero-net-flux method.
4.15 Other peptides
Besides mammalian neuropeptides, separation and analysis of neuropeptides from other species have also been conducted with analytical methods such as CE, LC with MS. The Sweedler group has made great contributions to the detection of neuropeptides from Aplysia californica with CE-MALDI-MS[237] or nanoESI-MS,[238] and to the separation of D-amino acid containing peptides (DAACP) with CE at the single neuron level.[239, 240] Based on their prior investigations on invertebrate neurons, they have recently established mammalian single cell system as an important model system for neuroscience study on cell-to-cell signaling. Benefits of single-cell MS analysis include the high ability for detecting intercellular signaling molecules by ideally matching the analysis methods to the properties of peptide samples, while inhibiting enzyme activity, and the ability to reduce sample complexity in the peptide mass region.[241] MALDI-MS based measurements were demonstrated showing dramatic enhancement in mass sensitivity (low attomole) by pushing the sample volume to attoliter-femtoliter levels.[242, 243] The Li group has demonstrated methods to measure neuropeptides from crustaceans combining microdialysis with nanoLC-MS and MALDI-TOF/TOF.[244, 245]
4.16 Summary
Although we have reviewed analytical methods used for in vivo analysis, the field of proteomics has dramatically changed and improved our ability to detect and identify peptides and proteins. Advances in mass spectrometry, protein arrays, immunoassay, and separations have the potential to be used for neuropeptides on dialysate samples but most of these new approaches have not yet been used for such samples. Some improved methods have been used on tissue level of peptides,[246–249] and we believe with further development, they will be utilized for in vivo monitoring.
5. Acetylcholine
Acetylcholine (ACh) was the first neurotransmitter to be characterized and is the primary neurotransmitter in muscular synapses. In the CNS, it is associated with attention, learning, memory, consciousness, sleep, and control of voluntary movements.[250] Disruption of normal ACh signaling is implicated in Huntington’s disease, Alzheimer’s disease, schizophrenia, and Parkinson’s disease.[71, 250] ACh is not electroactive, nor does it present opportunities for easy derivatization. Therefore, recently published methods for monitoring ACh have used either biosensor or MS detection.
Biosensors have been used for direct detection of ACh or preceded by LC. A common biosensor scheme requires the co-immobilization of acetylcholinesterase and choline oxidase. The ACh is converted to choline, and the choline is oxidized by choline oxidase to produce hydrogen peroxide, which is detected. Since choline is a normal metabolite of ACh in vivo, another biosensor coated only with choline oxidase is often used together with the ACh biosensor to measure and subtract out the signal due endogenously occurring choline. As with all biosensors or microelectrodes, major concerns are selectivity and sensitivity for the target molecule. Therefore, interfering electroactive species were excluded from ACh electrodes with permiselective membranes composed of overoxidised poly(pyrrole)—poly(2-naphthol) films[251] and N-acetylaniline.[252] Electron transfer and hydrogen peroxide oxidation were facilitated by immobilizing the enzymes in a redox polymer.[253] The use of a nickel-platinum alloy substrate has been shown to be more electrocalalytic and to promote enzyme integrity more effectively than a nickel substrate for an ACh biosensor.[254] The enzymes needed for the preparation of an ACh biosensor can be very sensitive to the conditions under which the biosensor is stored or used. To avoid the fragility of enzyme based sensors, Bhattachayay et al.[255] showed that 4-[(1E)-ethanehydrazonoyl]benzoic acid, a biomimetic for acetylcholinesterase, could be substituted for acetylcholinesterase to prepare a biosensor that yielded a response of comparable magnitude to a traditional ACh sensor. The dual enzyme design of ACh sensors motivated the development of several methods which aimed to simplify fabrication of biosensors.[256–258] Dual enzyme biosensors are the established design for ACh biosensor detection.
When detecting ACh by a sampling coupled method, an important consideration is whether acetylcholinesterase inhibitors should be included in the perfusion solution. Such inhibitors may be used to raise the concentration of ACh to detectable levels and to prevent enzymatic degradation of ACh during transportation from the animal to the analytical system. The former effect leaves open the possibility of perturbing the system being studied. Prokai et al.[259] comment that enzyme inhibitors should not be necessary because the molecular weight cut-off of most microdialysis probes should exclude acetylcholinesterase from the dialysate. Enzyme inhibitors also interfere with the acetylcholinesterase immobilized on the biosensor and therefore cannot be used with enzyme assays.
De Bundel et al.[250] and Yamamoto et al.[260] both evaluated their LC-EC biosensors or enzyme reactor systems for in vivo monitoring without the inclusion of enzyme inhibitors. Carballo et al.[261] demonstrated an LC-EC system which used an electrode for detection which incorporated poly[Ni(II)Protoporphyrin IX] rather than immobilized enzymes. They did not perform any in vivo testing, and therefore, did not comment on the use of enzyme inhibitors. Of the methods detecting ACh by LC-MS, only Keski-Rahkonen et al.[262] included acetylcholinesterase inhibitors in the perfusion solution.
Those methods published for the determination of ACh by LC-MS in dialysate or cell cultures samples sought rapid separations and sensitive detection with minimal ion suppression during ESI.[259, 262–265] Several groups report LC separations of 3–5 minutes.[259, 262–265] All of the methods for analysis of dialysate included in vivo testing.[259, 262–264]
To summarize, ACh release has been measured in many parts of the CNS. It is most commonly detected using dual enzyme biosensors intended either for direct implant or coupled to a separation system. A few authors report EC detection of ACh using surface modifications other than biologically derived enzymes. ACh has also been detected with excellent sensitivity by LC-MS. Nearly all of the recently published methods report LODs sufficient for in vivo monitoring, depending on the brain region of interest. As demonstrated by the high percentage of methods which were tested on biological samples (Table 5) and the excellent LODs reported, new developments in ACh detection have focused on improvements that can be readily applied to in vivo monitoring.
Table 5.
Summary of neuropeptide detection methods and their LODs.
| Analytes | Experiment Type | Method | Sampling technique (if applicable) | LOD | Reference |
|---|---|---|---|---|---|
| ME LE | Method development w/testing in vivo | Capillary LC- electrochemical detection | microdialysis | 20 pM (ME) | [173] |
| Method development w/testing in vivo | HPLC- electrochemical detection | push-pull | 0.15 pM (ME) 0.05 pM (LE) |
[80] | |
| Method development w/testing in vivo | LC-MS2 or MS3 | microdialysis | 1 pM (ME) 0.5 pM (LE) |
[78, 79, 174, 175] | |
| Method development | CE | nM level | [178–181] | ||
| Dyn | Method development w/testing in vivo | RIA | microdialysis | 3 nM | [183] |
| Method development w/testing in vivo | LC-MS | microdialysis | 40 pM | [78] | |
| BE | Method development w/testing in vivo | LC-MS | microdialysis | 5 nM (BE) 3 pM (BE10-19) |
[78] |
| EM1 & 2 | Method development w/testing in vivo | HPLC- electrochemical detection | push-pull | 0.04 pM (EM 1) 0.15 pM (EM 2) |
[80] |
| OXT | Method development w/testing in vivo | RIA | microdialysis | 0.1 fmole/sample | [195] |
| VP/CRH | Method development w/testing in vivo | RIA | push-pull | Not reported | [81] |
| GHRH | Method development w/testing in vivo | RIA | push-pull | Not reported | [82, 83] |
| TRH | Method development w/testing in vivo | HPLC-RIA | Not reported | [202–204] | |
| SOM | Method development w/testing in vivo | RIA and ELISA | microdialysis | 13.0 pM (RIA) 24.4 pM (ELISA) |
[84] |
| SP | Method development w/testing in vivo | RIA | Not reported | [85] | |
| Method development w/testing in vivo | CZE | 250 nM | [207] | ||
| Method development w/testing in vivo | CE-LIF | 100 pM | [208] | ||
| Method development w/testing in vivo | LC-MS | 667 pM | [209] | ||
| NKA NKB | Method development w/testing in vivo | CE-LIF | 0.04 nM (NKA) 0.2 nM (NKB) |
[86, 213] | |
| NPY | Method development w/testing on plasma sample | HPLC-ESI-MS | 5 nM | [218] | |
| Method development w/testing in vivo | RIA | microdialysis | N/A | [87] | |
| VIP | Method development w/testing in vivo | HPLC for sample purification CZE-UV | 1 μM | [88] | |
| NT | Method development w/testing in vivo | RIA | microdialysis | 1.9 pM | [87] |
| Method development w/testing in vivo | CZE-UV | 4.5 nM | [225] | ||
| Method development w/testing in vivo | CE-ESI-MS | 0.2 μM | [226] | ||
| Method development | capillary LC- UV-MS | 600 pM | [227] | ||
| Method development w/testing in vivo | CE-LIF | 0.1 nM | [213] | ||
| N/OFQ | Method development w/testing in vivo | RIA | microdialysis | 1 fmole | [89] |
| CCK | Method development w/testing in vivo | RIA | microdialysis | 0.3–0.6 pM | [90, 233] |
| GAL | Method development | LC-MS | 3 nM | [236] | |
| Method development w/testing in vivo | RIA | microdialysis | 7.9 pM | [91] | |
| Method development w/testing in vivo | HPLC-RIA | microdialysis | 7 pM | [237] | |
| CGRP α and β a-MSH | Method development | CEC | microdialysis | not reported | [239] |
| Method development w/testing at animal skin | EIA | microdialysis | not reported | [243] | |
| Hcrt | Method development w/testing in vivo | RIA | microdialysis | 10 pM | [92] |
| ANG | Method development w/testing in vivo | nanoLC-MS | microdialysis | 50 pM | [93, 246] |
6. Nucleosides
This discussion of nucleoside neurotransmitters addresses recently published methods for the detection of the excitatory compounds adenosine triphosphate (ATP) and adenosine. ATP is packaged in vesicles with other neurotransmitters and co-released following an action potential.[266] Adenosine is not released from neurons in a calcium dependent manner and so does not follow the secretion of a conventional neurotransmitter.[266] Neurons metabolically produce adenosine, which can then exit the cell by assisted diffusion.[267] Adenosine is also generated by extracellular enzymatic degradation of ATP.[266] Receptors for both ATP and adenosine are spread throughout the CNS and can be blocked by stimulants such as caffeine.[266] ATP and adenosine have been shown to mediate with mechanosensation, pain, and sleep;[266] mice which lack a type of adenosine receptor show increased aggressive behavior toward intruders.[267] Methods for the detection of adenosine and ATP are dominated by biosensors and microelectrodes (Table 6).
Table 6.
Summary of ACh detection methods and their LODs.
| Analytes | Experiment Type | Method | Sampling technique (if applicable) | LOD | Reference |
|---|---|---|---|---|---|
| ACh | Method development | Biosensor | 0.1 mM* | [264] | |
| ACh, Ch | Method development | Biosensor | 0.1–1 μM | [260–262, 265] | |
| ACh | Method development | Biosensor | 10 nM | [266] | |
| ACh, Ch | Method development w/in vivo testing & pharmacological manipulation | biosensor array | 0.2 μM | [267] | |
| ACh | Method development | microelectrode | 0.1 μM* | [263] | |
| ACh, Ch | Method development | LC-EC | 12 μM | [269] | |
| ACh, Ch | Method development w/in vivo testing | LC-EC | Microdialysis | 0.2 nM | [94] |
| ACh | Method development w/in vivo testing & pharmacological manipulation | LC-EC | Microdialysis | 1.5 nM | [95] |
| ACh | Method development w/in vivo testing | LC/MS/MS | Microdialysis | 0.15* –0.31 nM | [268, 270] |
| ACh, Ch | Method development w/in vivo testing | LC/MS/MS | microdialysis | 20 pM | [271] |
| ACh, Ch | Method development w/in vivo testing & pharmacological manipulation | LC/MS/MS | microdialysis | 10 pM | [272] |
| ACh | Method development w/testing on cell cultures | LC/MS/MS | 0.3 nM | [273] |
indicates lowest detected concentration.
6.1 ATP
The most common scheme for the detection of ATP by biosensors required the co-immobilization of glucose oxidase and hexokinase on the surface of the electrode[268–272] though several other dual enzyme biosensor designs were reported.[273–275] In one case, ATP, adenosine diphosphate (ADP), and adenosine monophosphate (AMP) were all detected at the same untreated electrode.[276] In common with biosensors for other neurotransmitters, rejection of interfering species, improved biocompatibility, and enhanced ease of fabrication were several motivations for new ATP biosensors. A Ruthenium Purple coating on the electrode surface was shown to effectively exclude other electroactive or enzyme responsive species.[275] Masson et al.[272] report that, if 4-(2-Hydroxyethyl)piperazine-1-ethanesulfonic acid (HEPES) buffer is used in the homogenization solution for ex vivo tissue samples, a falsely high current is observed at the electrode. Immobilization of the enzymes in a hybrid silica sol-gel film created a biosensor which displayed high biocompatibility while maintaining the activity of the enzyme.[268] Kueng et al.[269] presented a technique for more simple preparation of ATP biosensors. A pair of groups sought shorter measurement periods for biosensors,[273, 274] including real-time monitoring.[274] Mizaikoff and colleagues[270, 271] developed and tested a generalized theory for the preparation and optimization of dual enzyme biosensors so that future biosensors could be developed more rapidly. The dual enzyme design was also used to perform scanning electrochemical microscopy and image the transport of ATP through a porous membrane.[277] Dual enzyme biosensors provide effective detection of ATP with excellent LODs.
6.2 Adenosine
Methods for the detection of adenosine using FSCV[278] and sequential injection analysis (SIA) coupled to CE-UV have recently appeared.[279] Swamy and Venton[278] demonstrated the utility of FSCV for monitoring adenosine with high temporal resolution and suggest this method could be useful for studying the physiological activity of adenosine. Kulka et al.[279] chose SIA analysis to minimize and standardize sample handling before analysis. Improvements to adenosine detection were not a common field of research in recent years.
6.3 Summary
Most methods for the detection of nucleosides incorporate a dual enzyme detection mode though there are some instances of detection of ATP or adenosine on unmodified electrodes. The relative paucity of methods for the detection of nucleosides is a reflection of the fact that they are not one of the conventional groups of neurotransmitters. Nevertheless, these methods offer a good foundation for nucleoside detection and the possibility of in vivo monitoring.
7. Soluble gases
Several gases, including NO, carbon monoxide, and hydrogen sulfide, have been shown to be synthesized in neurons and released following Ca2+ binding, thus making them an interesting, relatively new class of neurotransmitters. Unlike molecules more typically classified as neurotransmitters, these soluble gas neurotransmitters are synthesized in response to Ca2+ binding and can diffuse through the plasma membrane to interact with other cells.[266] They are capable of initiating secondary signaling in target neurons but many of their effects have not been characterized. For instance, NO has been implicated in synaptic plasticity but also in apoptosis as part of neurodegenerative disease.[280] Further research is needed to establish the dynamics of NO generation and diffusion and to localize its activity in the CNS.[280]
Reliable and sensitive techniques are needed to answer the many outstanding questions on the role of soluble gas neurotransmitters. In the last five years, new methods have only been published for NO (Table 7). Given the rapid oxidation that converts NO to non-active nitrite species, in situ monitoring or rapidly homogenized whole cell analysis are the only methods which will provide accurate information on the activity of NO in the CNS. Thus, a majority of new methods of detecting NO used microelectrodes. NO was detected at chemically[281, 282] and protein or enzyme[283–289] modified electrodes. While NO is itself electroactive, these surface modifications greatly facilitate electron transfer and improve the detected signal. Inorganic surface modifications included single walled carbon nanotubes and Nafion,[281] and gold nanoparticles.[282] Protein or enzyme modifications were horseradish peroxidase and kieselguhr,[288] hemoglobin,[284] hemoglobin and myoglobin,[285, 287, 289] cytochrome c,[283] and red blood cells immobilized on gold nanoparticles.[286] Studies of NO in biological models are often performed on cultured single cells to eliminate the complication of distinguishing NO from several cellular sources. Therefore, Du et al.[281] used their chemically modified electrode to monitor the NO release of single cells; Koh et al.[283] observed the NO evoked in the striatum by the administration of cocaine. They found that cocaine administration on seven consecutive days caused a significant increase in the amount of NO in the striatum (Figure 2).[283] Surface modified electrodes can achieve excellent sensitivity for NO.
Table 7.
Summary of nucleoside neurotransmitter detection methods and their LODs.
| Analytes | Experiment Type | Detection method | LOD | Reference |
|---|---|---|---|---|
| Adenosine | Method development | Microelectrode | 15 nM | [97] |
| Adenosine | Method development | SI-CE | 1.8 μM | [285] |
| ATP | Method development | Surface modified electrode | 0.5–3 μM | [276, 281] |
| ATP | Method development | Surface modified electrode | 10 nM | [277] |
| ATP | Method development | Microelectrode | 1 μM | [283] |
| ATP | Method development w/in vivo testing | Surface modified electrode | 40 nM | [96] |
| ATP | Theory validation for detection of ATP by biosensor | Surface modified electrode | 0.5 μM* | [278] |
| ATP | Theory validation for detection of ATP by biosensor | Surface modified electrode | <1 μM | [279] |
| ATP | Method development | Surface modified electrode | 2.5 μM* | [280, 282] |
| ATP | Method development | SECM imaging | 0.5 mM* | [284] |
indicates lowest detected concentration.
Figure 2.
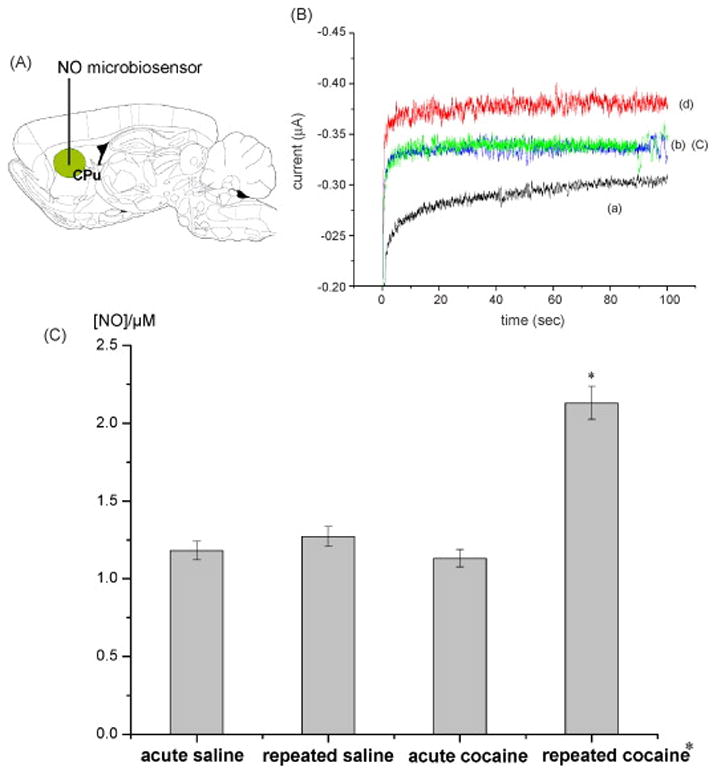
In vivo demonstration of a NO sensor reported in [283]. (A) Microbiosensor placement on a into the center of right dorsal caudate putamen. (B) In vivo amperometric responses recorded with a null (a) and cyt c/poly-TTCA microbiosensor in the saline (b), acute (c) or 7 days repeated cocaine (d) injected rat dorsal striatum. (C) Semiquantitative analysis on the NO responses produced by acute/repeated saline and acute/repeated cocaine injections. *p < 0.05 as compared with the saline and acute cocaine groups.
Tissue or cell homogenates have been analyzed for NO and metabolites using CE-LIF and FLD.[290–292] NO sensitive fluorophores, such as diaminofluoresceins (DAFs), can be used to detect NO in harvested tissue. Injection of a single cells onto the separation capillary[290, 291] minimizes change in the amount of NO which occurs during cell lysis or tissue homogenization. DAFs often experience interference from dehydroascorbice acid and ascorbic acid. Sweedler and collegues demonstrated this interference could be avoided through the introduction of ascorbic acid oxidase,[288] by use of dual labeling with two fluorophores with different excitation wavelengths,[293] and by diffusive mixing of NO and the fluorophore in frozen blocks of sample and fluorophore, excluding interfering species which cannot diffuse through the solid phase to the fluorophore.[292] Yang et al.[291] demonstrated the use of a new, interference-free, and pH independent fluorophore, 8-(3,4-diaminophenyl)-2,6-bis(2-carboxyethyl)-4,4-difluoro-1,3,5,7-tetramethyl-4-bora-3a,4a-diaza-s-indacene, for FLD of NO.
7.1 Summary
Soluble gases are a relatively newly recognized category of neurotransmitters. Their unique properties of as-needed synthesis, transmembrane diffusion, and widespread distribution in the CNS necessitate increased study with sensitive analytical methods to fully understand their role in the CNS. In recent years, new methods have been published for the detection of NO by modified electrodes and CE-LIF. Although NO is electroactive, the sensitivity of EC detection can be improved using inorganic, protein, or enzyme based modifications to the electrode surface. Using a protein modified electrode, the effect of the repeated administration of cocaine on NO was observed. CE-LIF was used to measure NO in single cells and tissue homogenates. Nearly all of the techniques reported LODs which would be acceptable for in vivo monitoring of NO given the reported basal concentration (1). These techniques offer a strong foundation for much needed study into the biological role of NO.
8. Multiplexing
Many published methods focus on the detection of a single neurotransmitter. While such single-analyte methods produce valuable information, they provide no data on how neurotransmitters may influence each other or change simultaneously in response to a stimulus. Multi-analyte monitoring provides the opportunity of observing interactions of neurotransmitter systems and detecting changes that were not anticipated by the original hypothesis. Most multi-analyte methods allow detection of several analytes from the same category of neurotransmitter based on common chemistries. Methods of this type have been discussed as part of their respective categories. A handful of methods detect analytes from different categories of neurotransmitters. These multi-category, multi-analyte methods are discussed in this section and outlined in Table 8.
Table 8.
Summary of NO detection methods and their LODs.
| Analytes | Experiment Type | Method | LOD | Reference |
|---|---|---|---|---|
| NO | Method development w/testing on cell cultures | Surface modified electrode | 4.3 nM | [287] |
| NO | Method development | Biosensor | 20 pM | [289] |
| NO | Method development | Biosensor | 0.3 μM | [290, 294] |
| NO | Method development | Biosensor | 5–40 nM | [288, 291–293] |
| NO | Method development w/in vivo testing and pharmacological manipulation | Biosensor | 13 nM | [98] |
| NO | Method development w/testing of ex vivo samples | CE-LIF | 1 μM* | [295] |
| NO | Method development w/testing of cell culture samples | CE-LIF | 10 nM | [297] |
| NO | Method development w/testing of ex vivo samples | CE-LIF | 42 amol | [296] |
| NO | Method development w/testing of ex vivo samples | Fluorimmetry and fluorescence microscopy | 0.1 μM* | [298] |
indicates lowest detected concentration.
A majority of the work monitoring different classes of neurotransmitters in vivo has been coupled to a sampling technique.[294–298] Several reports described use of LC-MS to detect a wide range of neuroactive compounds.[294, 296, 297] Utilization of the resolving power of MS permits the simultaneous observation of neurotransmitters from diverse categories in one sample. Zhao and Suo[296] and Zhang et al.[297] reported LODs below reported in vivo concentrations of the neurotransmitters of interest. The other sampling coupled techniques achieved multi-analyte detection of neurotransmitters from different categories through atypical approaches. Hooper and Anderson[295] resolved Glu and DA in dialysate samples using CE. They incorporated an in-capillary enzyme reaction, in which the reaction of Glu with glutamate oxidase generates hydrogen peroxide, so that both Glu and DA could be detected in the same separation. Yao and Okano[298] reported the detection of Glu, ACh, and DA in dialysate using FIA with EC in a cell containing three biosensors. The published LODs for Glu, ACh, and DA in these two methods were above reported in vivo concentrations in dialysate.
Two groups reported the use of biosensors for the non-simultaneous detection of two neurotransmitters on the same sensor.[299, 300] These biosensors were used under different experimental conditions to achieve detection of DA or Glu[299] and DA or NO.[301] While not true multiplexed detection because the neurotransmitters cannot be detected simultaneously, these methods do offer the possibility of detecting two neurotransmitters at the same location in the brain, potentially reducing the number of animals used for an experiment. One electrode for two neurotransmitters also simplifies electrode preparation protocols and reduces preparatory time. The biosensor method published by Rocchitta et al.[300] is unique among those discussed in this review as it included the development of tools for monitoring NO or DA in multiple subjects, at multiple locations, with data monitored through one central location; the manufacture of these devices was especially intended for application in clinical work. The reported LODs for these methods precluded in vivo detection of the analytes, other than NO, in the CNS.
Each of these papers presents detection schemes for multiple analytes from more than one category of neurotransmitters. While the sampling techniques offer simultaneous detection, the biosensor methods could produce more data than a single analyte biosensor and could simplify operational and preparatory protocols. Two techniques, which analyze samples by means of LC/MS or LC/MS/MS, have LODs acceptable for the detection of analytes in dialysate or tissue homogenates without further method development. Multi-category, multi-analyte detection permits monitoring of diverse and interacting neurotransmitters.
9. Analysis of Novel Sampling Systems
As mentioned previously, the spatial resolution of microdialysis is limited by sampling along a one to four millimeter active area. Improved spatial resolution with sampling is possible using LFPP[302] or direct sampling;[303] however, coupling these methods to analytical techniques poses a significant challenge as the sample is removed at < 50 nL/min. Cellar et al.[25] showed that LFPP could be coupled online to CE-LIF by means of peristaltic pumping generated pneumatically on a multi-layer soft lithography microfluidic device (Figure 3). This device produced the first instance of LFPP perfusate analysis performed on-line. Reported LODs were sufficient to observe basal levels of Glu, Asp, Tau, Ser, and Gly in vivo. Routine implementation of LFPP would bring the long term monitoring abilities of sampling coupled techniques to bear on a more precise brain region.
Figure 3.
A microfluidic peristaltic pumping device for coupling LFPP online to CE-LIF reported in [25].
Another concern when using any sampling technique coupled to a high temporal resolution analysis method is longitudinal diffusion of sampled concentration boundaries during transport from the sampling site to the fraction collector or analytical instrument. Diffusion during transport blurs the frontiers of concentration changes, reduces the ability to generate near real-time data, and puts a bottom limit on achievable response times. These problems are even more pronounced when using the low flow rates needed for LFPP (50 nL/min). Wang et al.[304] have shown that the temporal information of concentration step changes can be maintained during transportation over 40 cm of capillary when a microdialysis probe is coupled online to droplet generating device which breaks the dialysate stream into discrete droplets separated by an immiscible carrier phase (Figure 4). The droplets were analyzed using an enzyme assay. Roman et al.[24] demonstrated that similar droplets, which contained NDA or 5-fluorescein isothiocyanate (5-FITC) labeled Glu, Asp, GABA, Ser, and Gly, could be extracted into an aqueous continuous stream and analyzed by chip-based electrophoresis. Desegmented droplets were separated by CE-LIF, achieving 53,500 theoretical plates. If used together, the dialysate droplet generating device would prevent longitudinal diffusion while dialysate was transported to an analytical device and the droplet extraction technique would restore continuous aqueous flow so that analysis could occur.
Figure 4.

Comparison of temporal resolution in segmented and continuous flow systems reported in [304]. (A) The temporal resolution of a step change is preserved when a microdialysis probe is coupled to segmented flow. (B) Longitudinal diffusion causes a loss of temporal information in continuous flow systems.
10. Conclusion
Microelectrode/biosensors, sampling coupled methods, and tissue or cell homogenate methods are the three main techniques used for the measurement of neurotransmitters. Developments in microelectrodes and biosensors tend to focus on improvements in selectivity, sensitivity, and biocompatibility. New methods for sampling coupled techniques have demonstrated resolution of specific combinations of analytes, improvements in detector performance, and preservation of information from the sampling site to the analysis device. Tissue homogenate methods may integrate aspects of detection common to either of the other two techniques.
The greatest number of papers present improvements for amino acid, monoamine, and peptide neurotransmitters. These neurotransmitters mediate a number of important behavioral, sensory, and emotional systems. The keen level of interest in the biological function of these neurotransmitters fuels continuing improvements in their detection. Ach was the first discovered neurotransmitter and a majority of recently published papers present improvements that can be directly applied to in vivo monitoring. Nucleoside and soluble gas neurotransmitters have not been traditionally thought of as neurotransmitters but are released from neurons in response to Ca2+ binding. The recently published methods for the detection of nucleoside and soluble gas neurotransmitters provide a strong foundation for characterization of their in vivo dynamics.
Table 9.
Summary of multi-category, multi-analyte detection methods and their LODs.
| Analytes | Experiment Type | Method | Sampling technique (if applicable) | LOD | Reference |
|---|---|---|---|---|---|
| 21 compounds related to metabolism of Tyr, Trp, and Glu | Method Development | LC/MS/MS | 0.1 – 100 nM | [299] | |
| DA or Glu | Method Development | Biosensor — voltammetry | 100 μM* | [304] | |
| Glu, DA | Method development | CE-EC w/in capillary enzyme rxn | microdialysis | Glu: 4 mM DA: 3 mM* |
[300] |
| Glu, GABA, DA, 5HT | Method development w/testing of ex vivo tissue samples following organism manipulation | LC/FLD/MS | Glu: 0.687 nM GABA: 0.799 nM DA: 1.258 nM 5HT: 0.398 nM |
[301] | |
| NO or DA | Method development | Biosensor—amperometry | NO:< 50 nM DA: 10 nM* |
[305] | |
| ACh, 5HT, DA, GABA, Glu, Asp | Method development w/testing in vivo | LC/MS | LFPP | ACh: 0.05 nM 5HT: 0.5 nM DA: 1 nM GABA: 4 nM Glu: 20 nM Asp: 50 nM |
[302] |
| Glu, ACh, DA | Method development with in vivo testing | FIA w/triple biosensor detection—amperometry | microdialysis | 1.5 μM | [303] |
indicates lowest detected concentration.
Footnotes
Publisher's Disclaimer: This is a PDF file of an unedited manuscript that has been accepted for publication. As a service to our customers we are providing this early version of the manuscript. The manuscript will undergo copyediting, typesetting, and review of the resulting proof before it is published in its final citable form. Please note that during the production process errors may be discovered which could affect the content, and all legal disclaimers that apply to the journal pertain.
References
- 1.Clausius N, Born C, Grunze H. Neuropsychiatrie. 2009;23:15. [PubMed] [Google Scholar]
- 2.Berridge KC, Robinson TE, Aldridge JW. Current Opinion in Pharmacology. 2009;9:65. doi: 10.1016/j.coph.2008.12.014. [DOI] [PMC free article] [PubMed] [Google Scholar]
- 3.Gunduz-Bruce H. Brain Research Reviews. 2009;60:279. doi: 10.1016/j.brainresrev.2008.07.006. [DOI] [PubMed] [Google Scholar]
- 4.Lewis SJG, Barker RA. J Clin Neurosci. 2009;16:620. doi: 10.1016/j.jocn.2008.08.020. [DOI] [PubMed] [Google Scholar]
- 5.Schultz KN, Kennedy RT. Time-Resolved Microdialysis for In Vivo Neurochemical Measurements and Other Applications. 2008:627. doi: 10.1146/annurev.anchem.1.031207.113047. [DOI] [PubMed] [Google Scholar]
- 6.Wightman RM. Probing Cellular Chemistry in Biological Systems with Microelectrodes. 2006:1570. doi: 10.1126/science.1120027. [DOI] [PubMed] [Google Scholar]
- 7.Bowser MT, Kennedy RT. Electrophoresis. 2001;22:3668. doi: 10.1002/1522-2683(200109)22:17<3668::AID-ELPS3668>3.0.CO;2-M. [DOI] [PubMed] [Google Scholar]
- 8.Ochoa-de la Paz LD, Martínez-Dávila IA, Miledi R, Martínez-Torres A. Neuroscience Research. 2008;61:302. doi: 10.1016/j.neures.2008.03.009. [DOI] [PubMed] [Google Scholar]
- 9.Kamisaki Y, Wada K, Nakamoto K, Itoh T. In: Huxtable RJ, Azuma J, Kuriyama K, Nakagawa M, Baba A, editors. Release of taurine and its effects on release of neurotransmitter amino acids in rat cerebral cortex; International Taurine Symposium of the 15th Biennial Meeting of the International-Society-for-Neurochemistry; Osaka, Japan: Plenum Press Div Plenum Publishing Corp; 1995. p. 445. [Google Scholar]
- 10.Mothet J-P, Parent AlT, Wolosker H, Brady RO, Linden DJ, Ferris CD, Rogawski MA, Snyder SH. Proceedings of the National Academy of Sciences. 2000;97:4926. doi: 10.1073/pnas.97.9.4926. [DOI] [PMC free article] [PubMed] [Google Scholar]
- 11.Cao LW, Zhang HH, Hong W. Microchimica Acta. 2007;158:361. [Google Scholar]
- 12.Sandlin ZD, Shou MS, Shackman JG, Kennedy RT. Analytical Chemistry. 2005;77:7702. doi: 10.1021/ac051044z. [DOI] [PubMed] [Google Scholar]
- 13.Klinker CC, Bowser MT. Analytical Chemistry. 2007;79:8747. doi: 10.1021/ac071433o. [DOI] [PubMed] [Google Scholar]
- 14.Ciriacks CM, Bowser MT. Analytical Chemistry. 2004;76:6582. doi: 10.1021/ac0490651. [DOI] [PubMed] [Google Scholar]
- 15.Braun KL, Hapuarachchi S, Fernandez FM, Aspinwall CA. Electrophoresis. 2007;28:3115. doi: 10.1002/elps.200700087. [DOI] [PubMed] [Google Scholar]
- 16.Hapuarachchi S, Premeau SP, Aspinwall CA. Analytical Chemistry. 2006;78:3674. doi: 10.1021/ac051645q. [DOI] [PubMed] [Google Scholar]
- 17.Hapuarachchi S, Aspinwall CA. Electrophoresis. 2007;28:1100. doi: 10.1002/elps.200600567. [DOI] [PubMed] [Google Scholar]
- 18.Benturquia N, Parrot S, Sauvinet V, Renaud B, Denoroy L. Journal of Chromatography B-Analytical Technologies in the Biomedical and Life Sciences. 2004;806:237. doi: 10.1016/j.jchromb.2004.03.061. [DOI] [PubMed] [Google Scholar]
- 19.Deng YH, Wang H, Zhang HS. Journal of Separation Science. 2008;31:3088. doi: 10.1002/jssc.200800339. [DOI] [PubMed] [Google Scholar]
- 20.Denoroy L, Parrot S, Renaud L, Renaud B, Zimmer L. Journal of Chromatography A. 2008;1205:144. doi: 10.1016/j.chroma.2008.07.043. [DOI] [PubMed] [Google Scholar]
- 21.Kirschner DL, Jaramillo M, Green TK. Analytical Chemistry. 2007;79:736. doi: 10.1021/ac061725+. [DOI] [PubMed] [Google Scholar]
- 22.O’Brien KB, Bowser MT. Electrophoresis. 2006;27:1949. doi: 10.1002/elps.200500770. [DOI] [PubMed] [Google Scholar]
- 23.Ehlen JC, Albers HE, Breyer ED. Journal of Neuroscience Methods. 2005;147:36. doi: 10.1016/j.jneumeth.2005.03.012. [DOI] [PubMed] [Google Scholar]
- 24.Roman GT, Wang M, Shultz KN, Jennings C, Kennedy RT. Analytical Chemistry. 2008;80:8231. doi: 10.1021/ac801317t. [DOI] [PMC free article] [PubMed] [Google Scholar]
- 25.Cellar NA, Burns ST, Meiners JC, Chen H, Kennedy RT. Analytical Chemistry. 2005;77:7067. doi: 10.1021/ac0510033. [DOI] [PubMed] [Google Scholar]
- 26.Hapuarachchi S, Janaway GA, Aspinwall CA. Capillary electrophoresis with a UV light-emitting diode source for chemical monitoring of native and derivatized fluorescent compounds. Electrophoresis. 2006:4052. doi: 10.1002/elps.200600232. [DOI] [PubMed] [Google Scholar]
- 27.Wang CL, Zhao SL, Yuan HY, Xiao D. Journal of Chromatography B-Analytical Technologies in the Biomedical and Life Sciences. 2006;833:129. doi: 10.1016/j.jchromb.2006.01.013. [DOI] [PubMed] [Google Scholar]
- 28.Devall AJ, Blake R, Langman N, Smith CGS, Richards DA, Whitehead KJ. Journal of Chromatography B-Analytical Technologies in the Biomedical and Life Sciences. 2007;848:323. doi: 10.1016/j.jchromb.2006.10.049. [DOI] [PubMed] [Google Scholar]
- 29.Oreiro-Garcia MT, Vazquez-Illanes MD, Sierra-Paredes G, Sierra-Marcuno G. Biomedical Chromatography. 2005;19:720. doi: 10.1002/bmc.499. [DOI] [PubMed] [Google Scholar]
- 30.Silva DMD, Ferraz VP, Ribeiro AM. Journal of Neuroscience Methods. 2009;177:289. doi: 10.1016/j.jneumeth.2008.10.011. [DOI] [PubMed] [Google Scholar]
- 31.Uutela P, Ketola RA, Piepponen P, Kostiainen R. Analytica Chimica Acta. 2009;633:223. doi: 10.1016/j.aca.2008.11.055. [DOI] [PubMed] [Google Scholar]
- 32.Song YR, Feng YZ, LeBlanc MH, Zhao SL, Liu YM. Analytical Chemistry. 2006;78:8121. doi: 10.1021/ac061183w. [DOI] [PubMed] [Google Scholar]
- 33.Song YR, Shenwu MW, Zhao SL, Hou DY, Liu YM. Journal of Chromatography A. 2005;1091:102. doi: 10.1016/j.chroma.2005.07.069. [DOI] [PubMed] [Google Scholar]
- 34.O’Neill RD, Chang SC, Lowry JP, McNeil CJ. Biosensors & Bioelectronics. 2004;19:1521. doi: 10.1016/j.bios.2003.12.004. [DOI] [PubMed] [Google Scholar]
- 35.Zhang MG, Mullens C, Gorski W. Electroanalysis. 2005;17:2114. [Google Scholar]
- 36.Male KB, Hrapovic S, Luong JHT. Analyst. 2007;132:1254. doi: 10.1039/b712478c. [DOI] [PubMed] [Google Scholar]
- 37.Huang XJ, Im HS, Lee DH, Kim HS, Choi YK. Journal of Physical Chemistry C. 2007;111:1200. [Google Scholar]
- 38.Chakraborty S, Raj CR. Journal of Electroanalytical Chemistry. 2007;609:155. [Google Scholar]
- 39.Harper AC, Anderson MR. Electroanalysis. 2006;18:2397. [Google Scholar]
- 40.McMahon CP, Rocchitta G, Serra PA, Kirwan SM, Lowry JP, O’Neill RD. Analytical Chemistry. 2006;78:2352. doi: 10.1021/ac0518194. [DOI] [PubMed] [Google Scholar]
- 41.Hamdi N, Wang JJ, Walker E, Maidment NT, Monbouquette HG. Journal of Electroanalytical Chemistry. 2006;591:33. [Google Scholar]
- 42.Cui Y, Barford JP, Renneberg R. Sensors and Actuators B-Chemical. 2007;127:358. [Google Scholar]
- 43.Maalouf R, Chebib H, Saikali Y, Vittori O, Sigaud M, Jaffrezic-Renault N. Biosensors & Bioelectronics. 2007;22:2682. doi: 10.1016/j.bios.2006.11.003. [DOI] [PubMed] [Google Scholar]
- 44.Rahman MM, Umar A, Sawada K. Journal of Physical Chemistry B. 2009;113:1511. doi: 10.1021/jp809693z. [DOI] [PubMed] [Google Scholar]
- 45.Tang LH, Zhu YH, Xu LH, Yang XL, Li CZ. Talanta. 2007;73:438. doi: 10.1016/j.talanta.2007.04.008. [DOI] [PubMed] [Google Scholar]
- 46.McMahon CP, Rocchitta G, Kirwan SM, Killoran SJ, Serra PA, Lowry JP, O’Neill RD. Biosensors & Bioelectronics. 2007;22:1466. doi: 10.1016/j.bios.2006.06.027. [DOI] [PubMed] [Google Scholar]
- 47.Rahman MA, Kwon NH, Won MS, Choe ES, Shim YS. Analytical Chemistry. 2005;77:4854. doi: 10.1021/ac050558v. [DOI] [PubMed] [Google Scholar]
- 48.McMahon CP, Rocchitta G, Serra PA, Kirwan SM, Lowry JP, O’Neill RD. Analyst. 2006;131:68. doi: 10.1039/b511643k. [DOI] [PubMed] [Google Scholar]
- 49.Oldenziel WH, de Jong LAA, Dijkstra G, Cremers T, Westerink BHC. Analytical Chemistry. 2006;78:2456. doi: 10.1021/ac051958l. [DOI] [PubMed] [Google Scholar]
- 50.Walker E, Wang J, Hamdi N, Monbouquette HG, Maidment NT. Analyst. 2007;132:1107. doi: 10.1039/b706880h. [DOI] [PubMed] [Google Scholar]
- 51.Wassum KM, Tolosa VM, Wang JJ, Walker E, Monbouquette HG, Maidment NT. Sensors. 2008;8:5023. doi: 10.3390/s8085023. [DOI] [PMC free article] [PubMed] [Google Scholar]
- 52.Tang LH, Zhu YH, Yang XL, Li CZ. Analytica Chimica Acta. 2007;597:145. doi: 10.1016/j.aca.2007.06.024. [DOI] [PubMed] [Google Scholar]
- 53.Gaspar S, Wang XW, Suzuki H, Csoregi E. Analytica Chimica Acta. 2004;525:75. [Google Scholar]
- 54.Morales-Villagran A, Sandoval-Salazar C, Medina-Ceja L. Neurochemical Research. 2008;33:1592. doi: 10.1007/s11064-008-9704-y. [DOI] [PubMed] [Google Scholar]
- 55.Zhang FF, Wan Q, Li CX, Wang XL, Zhu ZQ, Xiang YZ, Jin LT, Yamamoto K. Analytical and Bioanalytical Chemistry. 2004;380:637. doi: 10.1007/s00216-004-2804-x. [DOI] [PubMed] [Google Scholar]
- 56.Hossain SMZ, Shinohara H, Wang F, Kitano H. Analytical and Bioanalytical Chemistry. 2007;389:1961. doi: 10.1007/s00216-007-1569-4. [DOI] [PubMed] [Google Scholar]
- 57.Hossain SMZ, Shinohara H, Kitano H. Analytical Chemistry. 2008;80:3762. doi: 10.1021/ac702392p. [DOI] [PubMed] [Google Scholar]
- 58.Okumura W, Moridera N, Kanazawa E, Shoji A, Hirano-Iwata A, Sugawara M. Analytical Biochemistry. 2009;385:326. doi: 10.1016/j.ab.2008.10.047. [DOI] [PubMed] [Google Scholar]
- 59.Schuvailo OM, Gaspar S, Soldatkin AP, Csoregi E. Electroanalysis. 2007;19:71. [Google Scholar]
- 60.Zacharis CK, Theodoridis GA, Voulgaropoulos AN. Journal of Chromatography B-Analytical Technologies in the Biomedical and Life Sciences. 2004;808:169. doi: 10.1016/j.jchromb.2004.05.003. [DOI] [PubMed] [Google Scholar]
- 61.Song Y, Shenwu M, Dhossche DM, Liu YM. Journal of Chromatography B-Analytical Technologies in the Biomedical and Life Sciences. 2005;814:295. doi: 10.1016/j.jchromb.2004.10.046. [DOI] [PubMed] [Google Scholar]
- 62.Tan F, Yang B, Guan Y. Analytical Sciences. 2005;21:583. doi: 10.2116/analsci.21.583. [DOI] [PubMed] [Google Scholar]
- 63.Oguri S, Nomura M, Fujita Y. Journal of Chromatography B-Analytical Technologies in the Biomedical and Life Sciences. 2006;843:194. doi: 10.1016/j.jchromb.2006.06.008. [DOI] [PubMed] [Google Scholar]
- 64.Koval D, Jiraskova J, Strisovsky K, Konvalinka J, Kasicka V. Electrophoresis. 2006;27:2558. doi: 10.1002/elps.200500946. [DOI] [PubMed] [Google Scholar]
- 65.Fukushima T, Kawai J, Imai K, Toyo’oka T. Biomedical Chromatography. 2004;18:813. doi: 10.1002/bmc.394. [DOI] [PubMed] [Google Scholar]
- 66.Berna MJ, Ackermann BL. Journal of Chromatography B-Analytical Technologies in the Biomedical and Life Sciences. 2007;846:359. doi: 10.1016/j.jchromb.2006.08.029. [DOI] [PubMed] [Google Scholar]
- 67.Pernot P, Mothet JP, Schuvailo O, Soldatkin A, Pollegioni L, Pilone M, Adeline MT, Cespuglio R, Marinesco S. Analytical Chemistry. 2008;80:1589. doi: 10.1021/ac702230w. [DOI] [PubMed] [Google Scholar]
- 68.Zhao SL, Yuan HY, Xiao D. Journal of Chromatography B-Analytical Technologies in the Biomedical and Life Sciences. 2005;822:334. doi: 10.1016/j.jchromb.2005.06.027. [DOI] [PubMed] [Google Scholar]
- 69.Li ST, Yu QL, Lu X, Zhao SL. Journal of Separation Science. 2009;32:282. doi: 10.1002/jssc.200800459. [DOI] [PubMed] [Google Scholar]
- 70.Fuchs SA, Berger R, Klomp LWJ, de Koning TJ. Mol Genet Metab. 2005;85:168. doi: 10.1016/j.ymgme.2005.03.003. [DOI] [PubMed] [Google Scholar]
- 71.Cooper JR, Bloom FE, Roth RH. The Biochemical Basis of Neuropharmacology. Oxford University Press; New York: 1996. [Google Scholar]
- 72.Sofuoglu M, Sewell RA. Addiction Biology. 2009;14:119. doi: 10.1111/j.1369-1600.2008.00138.x. [DOI] [PMC free article] [PubMed] [Google Scholar]
- 73.Lesch KP, Bengel D, Heils A, Sabol SZ, Greenberg BD, Petri S, Benjamin J, Maller CR, Hamer DH, Murphy DL. Science. 1996;274:1527. doi: 10.1126/science.274.5292.1527. [DOI] [PubMed] [Google Scholar]
- 74.Kachoosangi RT, Compton RG. Analytical and Bioanalytical Chemistry. 2007;387:2793. doi: 10.1007/s00216-007-1129-y. [DOI] [PubMed] [Google Scholar]
- 75.Rodriguez MC, Rubianes MD, Rivas GA. Journal of Nanoscience and Nanotechnology. 2008;8:6003. doi: 10.1166/jnn.2008.466. [DOI] [PubMed] [Google Scholar]
- 76.Selvaraju T, Ramaraj R. Journal of Electroanalytical Chemistry. 2005;585:290. [Google Scholar]
- 77.Li YX, Huang X, Chen YL, Wang L, Lin XQ. Microchimica Acta. 2009;164:107. [Google Scholar]
- 78.Yogeswaran U, Chen SM. Sensors and Actuators B-Chemical. 2008;130:739. [Google Scholar]
- 79.Hu WN, Sun DM, Ma W. Chemia Analityczna. 2008;53:703. [Google Scholar]
- 80.Zhu L, Tian C, Zhai J, Yang R. Sensors and Actuators B: Chemical. 2007;125:254. [Google Scholar]
- 81.Kang WJ, Niu LM, Ma L. Chinese Chemical Letters. 2009;20:221. [Google Scholar]
- 82.Quan D, Shin W. Electroanalysis. 2004;16:1576. [Google Scholar]
- 83.Strand AM, Venton BJ. Analytical Chemistry. 2008;80:3708. doi: 10.1021/ac8001275. [DOI] [PubMed] [Google Scholar]
- 84.Anastassiou CA, Patel BA, Arundell M, Yeoman MS, Parker KH, O’Hare D. Analytical Chemistry. 2006;78:6990. doi: 10.1021/ac061002q. [DOI] [PubMed] [Google Scholar]
- 85.Heien M, Johnson MA, Wightman RM. Analytical Chemistry. 2004;76:5697. doi: 10.1021/ac0491509. [DOI] [PubMed] [Google Scholar]
- 86.Huffman ML, Venton BJ. Electroanalysis. 2008;20:2422. [Google Scholar]
- 87.Chicharro M, Sanchez A, Zapardiel A, Rubianes MD, Rivas G. Analytica Chimica Acta. 2004;523:185. [Google Scholar]
- 88.Wang AJ, Xu JJ, Chen HY. Electroanalysis. 2007;19:674. [Google Scholar]
- 89.Jung MC, Shi GY, Borland L, Michael AC, Weber SG. Analytical Chemistry. 2006;78:1755. doi: 10.1021/ac051183g. [DOI] [PMC free article] [PubMed] [Google Scholar]
- 90.Lin CE, Cheng HT, Fang IJ, Liu YC, Kuo CM, Lin WY, Lin CH. Electrophoresis. 2006;27:3443. doi: 10.1002/elps.200500658. [DOI] [PubMed] [Google Scholar]
- 91.Yoshitake T, Kehr J, Yoshitake S, Fujino K, Nohta H, Yamaguchi M. Journal of Chromatography B-Analytical Technologies in the Biomedical and Life Sciences. 2004;807:177. doi: 10.1016/j.jchromb.2004.03.069. [DOI] [PubMed] [Google Scholar]
- 92.Ji CJ, Li WL, Ren XD, El-Kattan AF, Kozak R, Fountain S, Lepsy C. Analytical Chemistry. 2008;80:9195. doi: 10.1021/ac801339z. [DOI] [PubMed] [Google Scholar]
- 93.Uutela P, Karhu L, Piepponen P, Kaenmaki M, Ketola RA, Kostiainen R. Analytical Chemistry. 2009;81:427. doi: 10.1021/ac801846w. [DOI] [PubMed] [Google Scholar]
- 94.Wang D, Zhu W, An YR, Zheng JH, Zhang W, Jin LT, Gao HY, Lin LN. Chromatographia. 2008;67:369. [Google Scholar]
- 95.Xu HH, Wang D, Zhang W, Zhu W, Yamamoto K, Jin LT. Analytica Chimica Acta. 2006;577:207. doi: 10.1016/j.aca.2006.06.042. [DOI] [PubMed] [Google Scholar]
- 96.Zhang W, Wan FL, Xie YF, Gu J, Wang J, Yamamoto K, Jin LT. Analytica Chimica Acta. 2004;512:207. doi: 10.1016/j.aca.2006.06.042. [DOI] [PubMed] [Google Scholar]
- 97.Zhang W, Xie YF, Gu J, Ai SY, Wang J, Yamamoto K, Jin LT. Analyst. 2004;129:229. doi: 10.1039/b314277a. [DOI] [PubMed] [Google Scholar]
- 98.Zheng JH, Zhu W, Wang D, An YR, Zhang W, Jin LT. Chinese Journal of Analytical Chemistry. 2008;36:1316. [Google Scholar]
- 99.Zhang W, Wan FL, Gu J, Ai S, Ye J, Yamamoto KY, Jin LT. Chromatographia. 2004;59:677. [Google Scholar]
- 100.Vlckova M, Schwarz MA. Journal of Chromatography A. 2007;1142:214. doi: 10.1016/j.chroma.2006.12.040. [DOI] [PubMed] [Google Scholar]
- 101.Powell PR, Paxon TL, Han KA, Ewing AG. Analytical Chemistry. 2005;77:6902. doi: 10.1021/ac050963m. [DOI] [PMC free article] [PubMed] [Google Scholar]
- 102.Alpat S, Alpat SK, Telefoncu A. Analytical and Bioanalytical Chemistry. 2005;383:695. doi: 10.1007/s00216-005-0037-2. [DOI] [PubMed] [Google Scholar]
- 103.Lai GS, Zhang HL, Han DY. Analytical Letters. 2008;41:3088. [Google Scholar]
- 104.Lai GS, Zhang HL, Han DY. Microchimica Acta. 2008;160:233. [Google Scholar]
- 105.Jeong H, Jeon S. Sensors. 2008;8:6924. doi: 10.3390/s8116924. [DOI] [PMC free article] [PubMed] [Google Scholar]
- 106.Yin TJ, Wei WZ, Zeng JX. Analytical and Bioanalytical Chemistry. 2006;386:2087. doi: 10.1007/s00216-006-0845-z. [DOI] [PubMed] [Google Scholar]
- 107.Moraes FC, Cabral MF, Machado SAS, Mascaro LH. Electroanalysis. 2008;20:851. [Google Scholar]
- 108.Shaidarova LG, Chelnokova IA, Gedmina AV, Budnikov GK. Journal of Analytical Chemistry. 2009;64:36. [Google Scholar]
- 109.Zhou YL, Tian RH, Zhi JF. Biosensors & Bioelectronics. 2007;22:822. doi: 10.1016/j.bios.2006.03.001. [DOI] [PubMed] [Google Scholar]
- 110.Zhang L. Microchimica Acta. 2008;161:191. [Google Scholar]
- 111.Huang PF, Wang L, Bai JY, Wang HJ, Zhao YQ, Di Fan S. Microchimica Acta. 2007;157:41. [Google Scholar]
- 112.Skeika T, Marcovicz C, Nakagaki S, Fujiwara ST, Wohnrath K, Nagata N, Pessoa CA. Electroanalysis. 2007;19:2543. [Google Scholar]
- 113.Hou SR, Zheng N, Feng HY, Li XJ, Yuan ZB. Analytical Biochemistry. 2008;381:179. doi: 10.1016/j.ab.2008.03.055. [DOI] [PubMed] [Google Scholar]
- 114.Gonzalez R, Sanchez A, Chicharro M, Rubianes MD, Rivas GA. Electroanalysis. 2004;16:1244. [Google Scholar]
- 115.Chang HY, Kim D, Park YC. Electroanalysis. 2006;18:1578. [Google Scholar]
- 116.Amiri M, Shahrokhian S, Marken F. Electroanalysis. 2007;19:1032. [Google Scholar]
- 117.Ates M, Castillo J, Sarac AS, Schuhmann W. Microchimica Acta. 2008;160:247. [Google Scholar]
- 118.Cao XM, Luo LQ, Ding YP, Zou XL, Bian RX. Sensors and Actuators B-Chemical. 2008;129:941. [Google Scholar]
- 119.Lai GS, Zhang HL, Jin CM. Electroanalysis. 2007;19:496. [Google Scholar]
- 120.Forzani ES, Li XL, Tao NJ. Analytical Chemistry. 2007;79:5217. doi: 10.1021/ac0703202. [DOI] [PubMed] [Google Scholar]
- 121.Miscoria SA, Barrera GD, Rivas GA. Electroanalysis. 2005;17:1578. [Google Scholar]
- 122.Gao N, Xu Z, Wang F, Dong SJ. Electroanalysis. 2007;19:1655. [Google Scholar]
- 123.Zachek MK, Hermans A, Wightman RM, McCarty GS. Journal of Electroanalytical Chemistry. 2008;614:113. doi: 10.1016/j.jelechem.2007.11.007. [DOI] [PMC free article] [PubMed] [Google Scholar]
- 124.Tembe S, Karve M, Inamdar S, Haram S, Melo J, D’Souza SF. Analytical Biochemistry. 2006;349:72. doi: 10.1016/j.ab.2005.11.016. [DOI] [PubMed] [Google Scholar]
- 125.Tembe S, Kubal BS, Karve M, D’Souza SF. Analytica Chimica Acta. 2008;612:212. doi: 10.1016/j.aca.2008.02.031. [DOI] [PubMed] [Google Scholar]
- 126.Hermans A, Keithley RB, Kita JM, Sombers LA, Wightman RM. Analytical Chemistry. 2008;80:4040. doi: 10.1021/ac800108j. [DOI] [PubMed] [Google Scholar]
- 127.Kim SK, Lim H, Chung TD, Kim HC. Sensors and Actuators B-Chemical. 2006;115:212. [Google Scholar]
- 128.Dawoud AA, Kawaguchi T, Jankowiak R. Electrochemistry Communications. 2007;9:1536. [Google Scholar]
- 129.Kong Y, Chen HW, Wang YR, Soper SA. Electrophoresis. 2006;27:2940. doi: 10.1002/elps.200500750. [DOI] [PubMed] [Google Scholar]
- 130.Mecker LC, Martin RS. Analytical Chemistry. 2008;80:9257. doi: 10.1021/ac801614r. [DOI] [PMC free article] [PubMed] [Google Scholar]
- 131.Wang Y, Luo J, Chen HW, He QH, Gan N, Li TH. Analytica Chimica Acta. 2008;625:180. doi: 10.1016/j.aca.2008.07.030. [DOI] [PubMed] [Google Scholar]
- 132.Wang YR, Chen HW, He QH, Soper SA. Electrophoresis. 2008;29:1881. doi: 10.1002/elps.200700377. [DOI] [PubMed] [Google Scholar]
- 133.Chen ZL, Hayashi K, Iwasaki Y, Kurita R, Niwa O, Sunaawa K. Electroanalysis. 2005;17:231. [Google Scholar]
- 134.Migheli R, Puggioni G, Dedola S, Rocchitta G, Calia G, Bazzu G, Esposito G, Lowry JP, O’Neill RD, Desole MS, Miele E, Serra PA. Analytical Biochemistry. 2008;380:323. doi: 10.1016/j.ab.2008.05.050. [DOI] [PubMed] [Google Scholar]
- 135.Cannazza G, Di Stefano A, Mosciatti B, Braghiroli D, Baraldi M, Pinnen F, Sozio P, Benatti C, Parenti C. Journal of Pharmaceutical and Biomedical Analysis. 2005;36:1079. doi: 10.1016/j.jpba.2004.09.029. [DOI] [PubMed] [Google Scholar]
- 136.Lin L, Qiu PH, Yang LZ, Cao XN, Jin LT. Analytical and Bioanalytical Chemistry. 2006;384:1308. doi: 10.1007/s00216-005-0275-3. [DOI] [PubMed] [Google Scholar]
- 137.Leu Hoang J, Lin CE. Electroanalysis. 2006;18:307. [Google Scholar]
- 138.Shou MS, Ferrario CR, Schultz KN, Robinson TE, Kennedy RT. Analytical Chemistry. 2006;78:6717. doi: 10.1021/ac0608218. [DOI] [PubMed] [Google Scholar]
- 139.Shinohara H, Wang FF. Analytical Sciences. 2007;23:81. doi: 10.2116/analsci.23.81. [DOI] [PubMed] [Google Scholar]
- 140.Cheng H, Huang WH, Chen RS, Wang ZL, Cheng JK. Electrophoresis. 2007;28:1579. doi: 10.1002/elps.200600603. [DOI] [PubMed] [Google Scholar]
- 141.Lu LP, Wang SQ, Lin XQ. Analytica Chimica Acta. 2004;519:161. [Google Scholar]
- 142.Benturquia N, Couderc F, Sauvinet V, Orset C, Parrot S, Bayle C, Renaud B, Denoroy L. Electrophoresis. 2005;26:1071. doi: 10.1002/elps.200410150. [DOI] [PubMed] [Google Scholar]
- 143.Parrot S, Lambas-Senas L, Sentenac S, Denoroy L, Renaud B. Journal of Chromatography B-Analytical Technologies in the Biomedical and Life Sciences. 2007;850:303. doi: 10.1016/j.jchromb.2006.11.045. [DOI] [PubMed] [Google Scholar]
- 144.Hokfelt T, Broberger C, Xu ZQD, Sergeyev V, Ubink R, Diez M. Neuropharmacology. 2000;39:1337. doi: 10.1016/s0028-3908(00)00010-1. [DOI] [PubMed] [Google Scholar]
- 145.Zadina JE, Hackler L, Ge LJ, Kastin AJ. Nature. 1997;386:499. doi: 10.1038/386499a0. [DOI] [PubMed] [Google Scholar]
- 146.Rocha LL, Evans CJ, Maidment NT. Journal of Neurochemistry. 1997;68:616. doi: 10.1046/j.1471-4159.1997.68020616.x. [DOI] [PubMed] [Google Scholar]
- 147.Shen H, Lada MW, Kennedy RT. Journal of Chromatography B-Analytical Technologies in the Biomedical and Life Sciences. 1997;704:43. doi: 10.1016/s0378-4347(97)00436-2. [DOI] [PubMed] [Google Scholar]
- 148.Lisi TL, Sluka KA. Journal of Neuroscience Methods. 2006;150:74. doi: 10.1016/j.jneumeth.2005.06.001. [DOI] [PubMed] [Google Scholar]
- 149.Li Q, Zubieta JK, Kennedy RT. Anal Chem. 2009;81:2242. doi: 10.1021/ac802391b. [DOI] [PMC free article] [PubMed] [Google Scholar]
- 150.Baseski HM, Watson CJ, Cellar NA, Shackman JG, Kennedy RT. Journal of Mass Spectrometry. 2005;40:146. doi: 10.1002/jms.733. [DOI] [PubMed] [Google Scholar]
- 151.Sinnaeve BA, Van Bocxlaer JF. Journal of Chromatography A. 2004;1058:113. [PubMed] [Google Scholar]
- 152.Sinnaeve BA, Storme ML, Van Bocxlaer JF. Journal of Separation Science. 2005;28:1779. doi: 10.1002/jssc.200500114. [DOI] [PubMed] [Google Scholar]
- 153.Fanciulli G, Azara E, Wood TD, Dettorl A, Delitala G, Marchetti M. Journal of Chromatography B-Analytical Technologies in the Biomedical and Life Sciences. 2006;833:204. doi: 10.1016/j.jchromb.2006.01.038. [DOI] [PubMed] [Google Scholar]
- 154.Fanciulli G, Azara E, Wood TD, Delitala G, Marchetti M. Journal of Chromatography B-Analytical Technologies in the Biomedical and Life Sciences. 2007;852:485. doi: 10.1016/j.jchromb.2007.02.012. [DOI] [PubMed] [Google Scholar]
- 155.Ramautar R, Ratnayake CK, Somsen GW, de Jong GJ. Talanta. 2009;78:638. doi: 10.1016/j.talanta.2008.12.025. [DOI] [PubMed] [Google Scholar]
- 156.Babu CVS, Chung BC, Lho DS, Yoo YS. Journal of Chromatography A. 2006;1111:133. doi: 10.1016/j.chroma.2005.06.031. [DOI] [PubMed] [Google Scholar]
- 157.Tempels FWA, Wiese G, Underberg WJM, Somsen GW, de Jong GJ. Journal of Chromatography B-Analytical Technologies in the Biomedical and Life Sciences. 2006;839:30. doi: 10.1016/j.jchromb.2006.02.003. [DOI] [PubMed] [Google Scholar]
- 158.Lau SSM, Stainforth NM, Watson DG, Skellern GG, Wren SAC, Tettey JNA. Electrophoresis. 2008;29:393. doi: 10.1002/elps.200700368. [DOI] [PubMed] [Google Scholar]
- 159.Tempels FWA, Teeuwsen J, Kyriakou IK, Theodoridis G, Underberg WJM, Somsen GW, de Jong GJ. Journal of Chromatography A. 2004;1053:263. [PubMed] [Google Scholar]
- 160.Marinelli PW, Lam M, Bai L, Quirion R, Gianoulakis C. Alcoholism-Clinical and Experimental Research. 2006;30:982. doi: 10.1111/j.1530-0277.2006.00112.x. [DOI] [PubMed] [Google Scholar]
- 161.Lam M, Marinelli P, Bai L, Gianoulakis C. Psychopharmacology. 2008;201:261. doi: 10.1007/s00213-008-1267-8. [DOI] [PubMed] [Google Scholar]
- 162.Yan L, Zhu XG, Tseng JL, Desiderio DM. Peptides. 1997;18:1399. doi: 10.1016/s0196-9781(97)00207-6. [DOI] [PubMed] [Google Scholar]
- 163.Sanz-Nebot V, Benavente F, Hernandez E, Barbosa J. Analytica Chimica Acta. 2006;577:68. doi: 10.1016/j.aca.2006.06.035. [DOI] [PubMed] [Google Scholar]
- 164.Hernandez E, Benavente F, Sanz-Nebot V, Barbosa J. Electrophoresis. 2007;28:3957. doi: 10.1002/elps.200700845. [DOI] [PubMed] [Google Scholar]
- 165.Young WS, Shepard E, Amico J, Hennighausen L, Wagner KU, LaMarca ME, McKinney C, Ginns EI. Journal of Neuroendocrinology. 1996;8:847. doi: 10.1046/j.1365-2826.1996.05266.x. [DOI] [PubMed] [Google Scholar]
- 166.Ferguson JN, Young LJ, Hearn EF, Matzuk MM, Insel TR, Winslow JT. Nature Genetics. 2000;25:284. doi: 10.1038/77040. [DOI] [PubMed] [Google Scholar]
- 167.Ferguson JN, Aldag JM, Insel TR, Young LJ. Journal of Neuroscience. 2001;21:8278. doi: 10.1523/JNEUROSCI.21-20-08278.2001. [DOI] [PMC free article] [PubMed] [Google Scholar]
- 168.Kosfeld M, Heinrichs M, Zak PJ, Fischbacher U, Fehr E. Nature. 2005;435:673. doi: 10.1038/nature03701. [DOI] [PubMed] [Google Scholar]
- 169.Carter CS. Neuroscience and Biobehavioral Reviews. 1992;16:131. doi: 10.1016/s0149-7634(05)80176-9. [DOI] [PubMed] [Google Scholar]
- 170.Francis DD, Champagne FC, Meaney MJ. Journal of Neuroendocrinology. 2000;12:1145. doi: 10.1046/j.1365-2826.2000.00599.x. [DOI] [PubMed] [Google Scholar]
- 171.Urban IJA, Burbach JPH, Wied Dd. Progress in brain research. Elsevier; New York: 1998. Advances in brain vasopressin. [Google Scholar]
- 172.Bosch OJ, Kromer SA, Brunton PJ, Neumann ID. Neuroscience. 2004;124:439. doi: 10.1016/j.neuroscience.2003.11.028. [DOI] [PubMed] [Google Scholar]
- 173.Merali Z, Hayley S, Kent P, McIntosh J, Bedard T, Anisman H. Behavioural Brain Research. 2009;198:105. doi: 10.1016/j.bbr.2008.10.025. [DOI] [PubMed] [Google Scholar]
- 174.Frahm JL, Bori ID, Comins DL, Hawkridge AM, Muddiman DC. Anal Chem. 2007;79:3989. doi: 10.1021/ac070558q. [DOI] [PubMed] [Google Scholar]
- 175.Williams DK, Meadows CW, Bori ID, Hawkridge AM, Comins DL, Muddiman DC. Journal of the American Chemical Society. 2008;130:2122. doi: 10.1021/ja076849y. [DOI] [PubMed] [Google Scholar]
- 176.Choi YS, Wood TD. Rapid Communications in Mass Spectrometry. 2007;21:2101. doi: 10.1002/rcm.3068. [DOI] [PubMed] [Google Scholar]
- 177.Schally AV, Arimura A, Kastin AJ. Science. 1973;179:341. doi: 10.1126/science.179.4071.341. [DOI] [PubMed] [Google Scholar]
- 178.Liebow C, Reilly C, Serrano M, Schally AV. Proceedings of the National Academy of Sciences of the United States of America. 1989;86:2003. doi: 10.1073/pnas.86.6.2003. [DOI] [PMC free article] [PubMed] [Google Scholar]
- 179.Sekulic M, Lovren M, Milosevic V. Acta Veterinaria-Beograd. 2000;50:3. [Google Scholar]
- 180.Kasuya E, Sakumoto R, Saito T, Ishikawa H, Sengoku H, Nemoto T, Hodate K. Journal of Neuroscience Methods. 2005;141:115. doi: 10.1016/j.jneumeth.2004.06.006. [DOI] [PubMed] [Google Scholar]
- 181.Hashizume T, Kasuya E. Animal Science Journal. 2009;80:1. doi: 10.1111/j.1740-0929.2008.00589.x. [DOI] [PubMed] [Google Scholar]
- 182.Pekary AE, Stevens SA, Sattin A. Neurochemistry International. 2006;48:208. doi: 10.1016/j.neuint.2005.10.003. [DOI] [PubMed] [Google Scholar]
- 183.Sattin A, Pekary AE, Blood J. Neuroendocrinology. 2008;88:135. doi: 10.1159/000121595. [DOI] [PubMed] [Google Scholar]
- 184.Pekary AE, Sattin A, Blood J, Furst S. Psychoneuroendocrinology. 2008;33:1183. doi: 10.1016/j.psyneuen.2008.06.001. [DOI] [PubMed] [Google Scholar]
- 185.Pallis EG, Spyraki C, Thermos K. Neuroscience Letters. 2006;395:76. doi: 10.1016/j.neulet.2005.10.055. [DOI] [PubMed] [Google Scholar]
- 186.Pernow B. Pharmacological Reviews. 1983;35:85. [PubMed] [Google Scholar]
- 187.Harrison S, Geppetti P. The International Journal of Biochemistry & Cell Biology. 2001;33:555. doi: 10.1016/s1357-2725(01)00031-0. [DOI] [PubMed] [Google Scholar]
- 188.Liu ZR, Welin M, Bragee B, Nyberg F. Peptides. 2000;21:853. doi: 10.1016/s0196-9781(00)00219-9. [DOI] [PubMed] [Google Scholar]
- 189.Babu CVS, Han KY, Kim Y, Yoo YS. Microchemical Journal. 2003;75:29. [Google Scholar]
- 190.Frerichs VA, Herrmann JK, Aguirre A, Colon LA. Microchemical Journal. 2004;78:135. [Google Scholar]
- 191.Beaudry F, Vachon P. Biomedical Chromatography. 2006;20:1344. doi: 10.1002/bmc.703. [DOI] [PubMed] [Google Scholar]
- 192.Chappa AK, Cooper JD, Audus KL, Lunte SM. Journal of Pharmaceutical and Biomedical Analysis. 2007;43:1409. doi: 10.1016/j.jpba.2006.10.005. [DOI] [PMC free article] [PubMed] [Google Scholar]
- 193.Regoli D, Barabe J. Pharmacological Reviews. 1980;32:1. [PubMed] [Google Scholar]
- 194.Hilgenfeldt U, Linke R, Riester U, Konig W, Breipohl G. Analytical Biochemistry. 1995;228:35. doi: 10.1006/abio.1995.1311. [DOI] [PubMed] [Google Scholar]
- 195.Chen Y, Xu LG, Lin JM, Chen GN. Electrophoresis. 2008;29:1302. doi: 10.1002/elps.200700594. [DOI] [PubMed] [Google Scholar]
- 196.Chen Y, Xu LJ, Zhang L, Chen GN. Analytical Biochemistry. 2008;380:297. doi: 10.1016/j.ab.2008.06.002. [DOI] [PubMed] [Google Scholar]
- 197.Buckmaster PS, Dudek FE. Journal of Comparative Neurology. 1997;385:385. [PubMed] [Google Scholar]
- 198.Vezzani A, Sperk G, Colmers WF. Trends in Neurosciences. 1999;22:25. doi: 10.1016/s0166-2236(98)01284-3. [DOI] [PubMed] [Google Scholar]
- 199.Stephens TW, Basinski M, Bristow PK, Buevalleskey JM, Burgett SG, Craft L, Hale J, Hoffmann J, Hsiung HM, Kriauciunas A, Mackellar W, Rosteck PR, Schoner B, Smith D, Tinsley FC, Zhang XY, Heiman M. Nature. 1995;377:530. doi: 10.1038/377530a0. [DOI] [PubMed] [Google Scholar]
- 200.Schwartz MW, Woods SC, Porte D, Seeley RJ, Baskin DG. Nature. 2000;404:661. doi: 10.1038/35007534. [DOI] [PubMed] [Google Scholar]
- 201.Racaityte K, Lutz ESM, Unger KK, Lubda D, Boos KS. Journal of Chromatography A. 2000;890:135. doi: 10.1016/s0021-9673(00)00639-7. [DOI] [PubMed] [Google Scholar]
- 202.Gruber SHM, Nomikos GG, Mathe AA. European Neuropsychopharmacology. 2006;16:592. doi: 10.1016/j.euroneuro.2006.01.009. [DOI] [PubMed] [Google Scholar]
- 203.Li CG, Rand MJ. European Journal of Pharmacology. 1990;191:303. doi: 10.1016/0014-2999(90)94162-q. [DOI] [PubMed] [Google Scholar]
- 204.Nassar CF, Abdallah LE, Barada KA, Atweh SF, Saade NE. Regulatory Peptides. 1995;55:261. doi: 10.1016/0167-0115(94)00114-d. [DOI] [PubMed] [Google Scholar]
- 205.Kulick RS, Chaiseha Y, Kang SW, Rozenboim I, El Halawani ME. General and Comparative Endocrinology. 2005;142:267. doi: 10.1016/j.ygcen.2004.12.024. [DOI] [PubMed] [Google Scholar]
- 206.Soucheleau J, Denoroy L. Journal of Chromatography. 1992;608:181. doi: 10.1016/0021-9673(92)87122-o. [DOI] [PubMed] [Google Scholar]
- 207.Nemeroff CB. Psychoneuroendocrinology. 1986;11:15. doi: 10.1016/0306-4530(86)90029-6. [DOI] [PubMed] [Google Scholar]
- 208.Vijayan E, McCann SM. Endocrinology. 1979;105:64. doi: 10.1210/endo-105-1-64. [DOI] [PubMed] [Google Scholar]
- 209.Aronin N, Coslovsky R, Leeman SE. Annual Review of Physiology. 1986;48:537. doi: 10.1146/annurev.ph.48.030186.002541. [DOI] [PubMed] [Google Scholar]
- 210.Ban E, Choi OK, Chung WY, Park CS, Yoo EA, Chung BC, Yoo YS. Electrophoresis. 2001;22:2173. doi: 10.1002/1522-2683(20017)22:11<2173::AID-ELPS2173>3.0.CO;2-8. [DOI] [PubMed] [Google Scholar]
- 211.Xia SF, Zhang L, Tong P, Lu MH, Liu W, Chen GN. Electrophoresis. 2007;28:3268. doi: 10.1002/elps.200600756. [DOI] [PubMed] [Google Scholar]
- 212.Bjellaas T, Holm A, Molander P, Tornes JA, Greibrokk T, Lundanes E. Analytical and Bioanalytical Chemistry. 2004;378:1021. doi: 10.1007/s00216-003-2405-0. [DOI] [PubMed] [Google Scholar]
- 213.Reinscheid RK, Nothacker HP, Bourson A, Ardati A, Henningsen RA, Bunzow JR, Grandy DK, Langen H, Monsma FJ, Civelli O. Science. 1995;270:792. doi: 10.1126/science.270.5237.792. [DOI] [PubMed] [Google Scholar]
- 214.Jenck F, Moreau JL, Martin JR, Kilpatrick GJ, Reinscheid RK, Monsma FJ, Nothacker HP, Civelli O. Proceedings of the National Academy of Sciences of the United States of America. 1997;94:14854. doi: 10.1073/pnas.94.26.14854. [DOI] [PMC free article] [PubMed] [Google Scholar]
- 215.Sandin J, Georgieva J, Schott PA, Ogren SO, Terenius L. European Journal of Neuroscience. 1997;9:194. doi: 10.1111/j.1460-9568.1997.tb01367.x. [DOI] [PubMed] [Google Scholar]
- 216.Manabe T, Noda Y, Mamiya T, Katagiri H, Houtani T, Nishi M, Noda T, Takahashi T, Sugimoto T, Nabeshima T, Takeshima H. Nature. 1998;394:577. doi: 10.1038/29073. [DOI] [PubMed] [Google Scholar]
- 217.Aparicio LC, Candeletti S, Binaschi A, Mazzuferi M, Mantovani S, Di Benedetto M, Landuzzi D, Lopetuso G, Romualdi P, Simonato M. Journal of Neurochemistry. 2004;91:30. doi: 10.1111/j.1471-4159.2004.02633.x. [DOI] [PubMed] [Google Scholar]
- 218.Heinricher MM, Neubert MJ. Journal of Neurophysiology. 2004;92:1982. doi: 10.1152/jn.00411.2004. [DOI] [PubMed] [Google Scholar]
- 219.Heilborn U, Rost BR, Arborelius L, Brodin E. Brain Research. 2007;1136:51. doi: 10.1016/j.brainres.2006.12.006. [DOI] [PubMed] [Google Scholar]
- 220.Erel U, Arborelius L, Brodin E. Brain Research. 2004;1022:39. doi: 10.1016/j.brainres.2004.05.087. [DOI] [PubMed] [Google Scholar]
- 221.Rokaeus A. Trends in Neurosciences. 1987;10:158. [Google Scholar]
- 222.Kyrkouli SE, Stanley BG, Seirafi RD, Leibowitz SF. Peptides. 1990;11:995. doi: 10.1016/0196-9781(90)90023-x. [DOI] [PubMed] [Google Scholar]
- 223.Delinsky DC, Hill KT, White CA, Bartlett MG. Journal of Liquid Chromatography & Related Technologies. 2006;29:2341. [Google Scholar]
- 224.Blakeman KH, Wiesenfeld-Hallin Z, Alster P. Experimental Brain Research. 2001;139:354. doi: 10.1007/s002210100756. [DOI] [PubMed] [Google Scholar]
- 225.Hilke S, Theodorsson A, Fetissov S, Aman K, Holm L, Hokfelt T, Theodorsson E. European Journal of Neuroscience. 2005;21:2089. doi: 10.1111/j.1460-9568.2005.04050.x. [DOI] [PubMed] [Google Scholar]
- 226.VanRossum D, Hanisch UK, Quirion R. Neuroscience and Biobehavioral Reviews. 1997;21:649. doi: 10.1016/s0149-7634(96)00023-1. [DOI] [PubMed] [Google Scholar]
- 227.Shah JP, Phillips TM, Danoff JV, Gerber LH. Journal of Applied Physiology. 2005;99:1977. doi: 10.1152/japplphysiol.00419.2005. [DOI] [PubMed] [Google Scholar]
- 228.Kalra SP, Dube MG, Pu SY, Xu B, Horvath TL, Kalra PS. Endocrine Reviews. 1999;20:68. doi: 10.1210/edrv.20.1.0357. [DOI] [PubMed] [Google Scholar]
- 229.Thody AJ, Ridley K, Penny RJ, Chalmers R, Fisher C, Shuster S. Peptides. 1983;4:813. doi: 10.1016/0196-9781(83)90072-4. [DOI] [PubMed] [Google Scholar]
- 230.Lerner AB, Shizume K, Bunding I. Journal of Clinical Endocrinology and Metabolism. 1954;14:1463. doi: 10.1210/jcem-14-12-1463. [DOI] [PubMed] [Google Scholar]
- 231.Padolla RR, Mallampati R, Fulzele SV, Babu RJ, Singh M. Toxicology Letters. 2009;185:168. doi: 10.1016/j.toxlet.2008.12.012. [DOI] [PMC free article] [PubMed] [Google Scholar]
- 232.Taheri S, Zeitzer JM, Mignot E. Annual Review of Neuroscience. 2002;25:283. doi: 10.1146/annurev.neuro.25.112701.142826. [DOI] [PubMed] [Google Scholar]
- 233.Kiyashchenko LI, Mileykovskiy BY, Maidment N, Lam HA, Wu MF, John J, Peever J, Siegel JM. Journal of Neuroscience. 2002;22:5282. doi: 10.1523/JNEUROSCI.22-13-05282.2002. [DOI] [PMC free article] [PubMed] [Google Scholar]
- 234.Curtiss C, Cohn JN, Vrobel T, Franciosa JA. Circulation. 1978;58:763. doi: 10.1161/01.cir.58.5.763. [DOI] [PubMed] [Google Scholar]
- 235.Lanckmans K, Sarre S, Smolders I, Michotte Y. Rapid Communications in Mass Spectrometry. 2007;21:1187. doi: 10.1002/rcm.2950. [DOI] [PubMed] [Google Scholar]
- 236.Lanckmans K, Stragier B, Sarre S, Smolders I, Michotte Y. Journal of Separation Science. 2007;30:2217. doi: 10.1002/jssc.200700159. [DOI] [PubMed] [Google Scholar]
- 237.Rubakhin SS, Page JS, Monroe BR, Sweedler JV. Electrophoresis. 2001;22:3752. doi: 10.1002/1522-2683(200109)22:17<3752::AID-ELPS3752>3.0.CO;2-H. [DOI] [PubMed] [Google Scholar]
- 238.Jakubowski JA, Hatcher NG, Sweedler JV. Journal of Mass Spectrometry. 2005;40:924. doi: 10.1002/jms.869. [DOI] [PubMed] [Google Scholar]
- 239.Sheeley SA, Miao H, Ewing MA, Rubakhin SS, Sweedler JV. Analyst. 2005;130:1198. doi: 10.1039/b504717j. [DOI] [PubMed] [Google Scholar]
- 240.Ewing MA, Wang J, Sheeley SA, Sweedler JV. Anal Chem. 2008;80:2874. doi: 10.1021/ac7025173. [DOI] [PubMed] [Google Scholar]
- 241.Rubakhin SS, Sweedler JV. Nat Protoc. 2007;2:1987. doi: 10.1038/nprot.2007.277. [DOI] [PubMed] [Google Scholar]
- 242.Rubakhin SS, Sweedler JV. Anal Chem. 2008;80:7128. doi: 10.1021/ac8010389. [DOI] [PMC free article] [PubMed] [Google Scholar]
- 243.Rubakhin SS, Greenough WT, Sweedler JV. Anal Chem. 2003;75:5374. doi: 10.1021/ac034498+. [DOI] [PubMed] [Google Scholar]
- 244.Behrens HL, Chen RB, Li LJ. Anal Chem. 2008;80:6949. doi: 10.1021/ac800798h. [DOI] [PMC free article] [PubMed] [Google Scholar]
- 245.Chen RB, Ma MM, Hui LM, Zhang J, Li LJ. Journal of the American Society for Mass Spectrometry. 2009;20:708. doi: 10.1016/j.jasms.2008.12.007. [DOI] [PMC free article] [PubMed] [Google Scholar]
- 246.Faith M, Nilsson A, Skold K, Svensson M, Fenyo D, Andren PE. Mol Cell Proteomics. 2006;5:S72. doi: 10.1074/mcp.M500401-MCP200. [DOI] [PubMed] [Google Scholar]
- 247.Che FY, Vathy I, Fricker LD. J Mol Neurosci. 2006;28:265. doi: 10.1385/JMN:28:3:265. [DOI] [PubMed] [Google Scholar]
- 248.Wei H, Nolkrantz K, Parkin MC, Chisolm CN, O’Callaghan JP, Kennedy RT. Anal Chem. 2006;78:4342. doi: 10.1021/ac052196x. [DOI] [PubMed] [Google Scholar]
- 249.Wang N, MacKenzie L, De Souza AG, Zhong HY, Goss G, Li L. J Proteome Res. 2007;6:263. doi: 10.1021/pr060367o. [DOI] [PubMed] [Google Scholar]
- 250.De Bundel D, Sarre S, Van Eeckhaut A, Smolders I, Michotte Y. Sensors. 2008;8:5171. doi: 10.3390/s8085171. [DOI] [PMC free article] [PubMed] [Google Scholar]
- 251.Guerrieri A, Lattanzio V, Palmisano F, Zambonin PG. Biosensors & Bioelectronics. 2006;21:1710. doi: 10.1016/j.bios.2005.08.005. [DOI] [PubMed] [Google Scholar]
- 252.Yang MH, Yang YH, Yang Y, Shen GL, Yu RQ. Analytica Chimica Acta. 2005;530:205. [Google Scholar]
- 253.Sen S, Gulce A, Gulce H. Biosensors & Bioelectronics. 2004;19:1261. doi: 10.1016/j.bios.2003.11.011. [DOI] [PubMed] [Google Scholar]
- 254.Shibli SMA, Beenakumari KS. Electroanalysis. 2006;18:465. [Google Scholar]
- 255.Bhattachayay D, Pal P, Banerjee S, Sanyal SK, Turner APF, Sarkar P. Analytical Letters. 2008;41:1387. [Google Scholar]
- 256.Schuvailo ON, Dzyadevych SV, El’skaya A, Gautier-Sauvigne S, Csoregi E, Cespuglio R, Soldatkin AP. Biosensors & Bioelectronics. 2005;21:87. doi: 10.1016/j.bios.2004.09.017. [DOI] [PubMed] [Google Scholar]
- 257.Xue W, Cui TH. Sensors and Actuators B-Chemical. 2008;134:981. [Google Scholar]
- 258.Burmeister JJ, Pomerleau F, Huettl P, Gash CR, Wemer CE, Bruno JP, Gerhardt GA. Biosensors & Bioelectronics. 2008;23:1382. doi: 10.1016/j.bios.2007.12.013. [DOI] [PubMed] [Google Scholar]
- 259.Prokai L, Frycak P, Stevens SM, Nguyen V. Measurement of Acetylcholine in Rat Brain Microdialysates by LC-Isotope Dilution Tandem MS. 7th Balaton Symposium of High-Performance Separation Methods; Vieweg, Siofok, HUNGARY. 2007. p. S101. [DOI] [PMC free article] [PubMed] [Google Scholar]
- 260.Yamamoto K, Sato K, Chikuma T, Kato T. Analytica Chimica Acta. 2004;521:209. [Google Scholar]
- 261.Carballo R, Dall’Orto VC, Rezzano I. Analytical Letters. 2007;40:1962. [Google Scholar]
- 262.Keski-Rahkonen P, Lehtonen M, Ihalainen J, Sarajarvi T, Auriola S. Rapid Communications in Mass Spectrometry. 2007;21:2933. doi: 10.1002/rcm.3162. [DOI] [PubMed] [Google Scholar]
- 263.Uutela P, Reinila R, Piepponen P, Ketola RA, Kostiainen R. Rapid Communications in Mass Spectrometry. 2005;19:2950. doi: 10.1002/rcm.2160. [DOI] [PubMed] [Google Scholar]
- 264.Zhang MY, Hughes ZA, Kerns EH, Lin Q, Beyer CE. Journal of Pharmaceutical and Biomedical Analysis. 2007;44:586. doi: 10.1016/j.jpba.2007.02.024. [DOI] [PubMed] [Google Scholar]
- 265.Schebb NH, Fischer D, Hein EM, Hayen H, Krieglstein J, Kumpp S, Karst U. Journal of Chromatography A. 2008;1183:100. doi: 10.1016/j.chroma.2008.01.033. [DOI] [PubMed] [Google Scholar]
- 266.Purves D, Augstine GJ, Fitzpatrick D, Hall WC, LaManita A-S, McNamara JO, Williams SM. Neuroscience. Sinauer Associates, Inc; Sunderland, MA: 2004. [Google Scholar]
- 267.Ledent C, Vaugeois JM, Schiffmann SN, Pedrazzini T, Yacoubi ME, Vanderhaeghen JJ, Costentin J, Heath JK, Vassart G, Parmentier M. Nature. 1997;388:674. doi: 10.1038/41771. [DOI] [PubMed] [Google Scholar]
- 268.Liu SQ, Sun YM. Biosensors & Bioelectronics. 2007;22:905. doi: 10.1016/j.bios.2006.03.019. [DOI] [PubMed] [Google Scholar]
- 269.Kueng A, Kranz C, Mizaikoff B. Biosensors & Bioelectronics. 2004;19:1301. doi: 10.1016/j.bios.2003.11.023. [DOI] [PubMed] [Google Scholar]
- 270.Kottke PA, Kranz C, Kwon YK, Masson JF, Mizaikoff B, Fedorov AG. Journal of Electroanalytical Chemistry. 2008;618:74. doi: 10.1016/j.jelechem.2008.02.025. [DOI] [PMC free article] [PubMed] [Google Scholar]
- 271.Masson JF, Kranz C, Mizaikoff B. Analytical Chemistry. 2007;79:8531. doi: 10.1021/ac071090u. [DOI] [PubMed] [Google Scholar]
- 272.Masson JF, Gauda E, Mizaikoff B, Kranz C. Analytical and Bioanalytical Chemistry. 2008;390:2067. doi: 10.1007/s00216-008-2015-y. [DOI] [PubMed] [Google Scholar]
- 273.Cui Y, Barford JP, Renneberg R. Sensors and Actuators B-Chemical. 2008;132:1. [Google Scholar]
- 274.Llaudet E, Hatz S, Droniou M, Dale N. Analytical Chemistry. 2005;77:3267. doi: 10.1021/ac048106q. [DOI] [PubMed] [Google Scholar]
- 275.Tian F, Llaudet E, Dale N. Analytical Chemistry. 2007;79:6760. doi: 10.1021/ac070822f. [DOI] [PubMed] [Google Scholar]
- 276.Kerman K, Vestergaard M, Tamiya E. Analytical Letters. 2008;41:2077. [Google Scholar]
- 277.Kueng A, Kranz C, Mizaikoff B. Biosensors & Bioelectronics. 2005;21:346. doi: 10.1016/j.bios.2004.10.020. [DOI] [PubMed] [Google Scholar]
- 278.Swamy BEK, Venton BJ. Analytical Chemistry. 2007;79:744. doi: 10.1021/ac061820i. [DOI] [PubMed] [Google Scholar]
- 279.Kulka S, Quintas G, Lendl B. Analyst. 2006;131:739. doi: 10.1039/b517162h. [DOI] [PubMed] [Google Scholar]
- 280.Barbosa RM, Lourenco CF, Santos RM, Pomerleau F, Huettl P, Gerhardt GA, Laranjinha J. Nitric Oxide, Pt G: Oxidative and Nitrosative Stress in Redox Regulation of Cell Signaling. Elsevier Academic Press Inc; San Diego: 2008. p. 351. [Google Scholar]
- 281.Du FY, Huang WH, Shi YX, Wang ZL, Cheng JK. Biosensors & Bioelectronics. 2008;24:415. doi: 10.1016/j.bios.2008.04.020. [DOI] [PubMed] [Google Scholar]
- 282.Li YJ, Liu C, Yang MH, He Y, Yeung ES. Journal of Electroanalytical Chemistry. 2008;622:103. [Google Scholar]
- 283.Koh WCA, Rahman MA, Choe ES, Lee DK, Shim YB. Biosensors & Bioelectronics. 2008;23:1374. doi: 10.1016/j.bios.2007.12.008. [DOI] [PubMed] [Google Scholar]
- 284.Fan CH, Liu XJ, Pang JT, Li GX, Scheer H. Analytica Chimica Acta. 2004;523:225. [Google Scholar]
- 285.Gan X, Liu T, Zhu XL, Li GX. Analytical Sciences. 2004;20:1271. doi: 10.2116/analsci.20.1271. [DOI] [PubMed] [Google Scholar]
- 286.Gu HY, Lu SY, Jiang QY, Yu CM, Li GX, Chen HY. Analytical Letters. 2006;39:2849. [Google Scholar]
- 287.Guo ZM, Chen J, Liu H, Cha CS. Analytica Chimica Acta. 2008;607:30. doi: 10.1016/j.aca.2007.11.038. [DOI] [PubMed] [Google Scholar]
- 288.Shang LB, Liu XJ, Fan CH, Li GX. Annali Di Chimica. 2004;94:457. doi: 10.1002/adic.200490055. [DOI] [PubMed] [Google Scholar]
- 289.Zhou H, Yang RW, Xu Y, Han K, Li GX. Analytical Letters. 2005;38:2103. [Google Scholar]
- 290.Kim WS, Ye XY, Rubakhin SS, Sweedler JV. Analytical Chemistry. 2006;78:1859. doi: 10.1021/ac051877p. [DOI] [PubMed] [Google Scholar]
- 291.Yang Q, Zhang XL, Bao XH, Lu HJ, Zhang WJ, Wu WH, Miao HN, Jiao BH. Journal of Chromatography A. 2008;1201:120. doi: 10.1016/j.chroma.2008.06.001. [DOI] [PubMed] [Google Scholar]
- 292.Ye X, Kim W-S, Rubakhin SS, Sweedler JV. Measurement of nitric oxide by 4,5-diaminofluorescein without interferences. 2004:1200. doi: 10.1039/b409394a. [DOI] [PubMed] [Google Scholar]
- 293.Ye X, Rubakhin SS, Sweedler JV. Journal of Neuroscience Methods. 2008;168:373. doi: 10.1016/j.jneumeth.2007.10.026. [DOI] [PMC free article] [PubMed] [Google Scholar]
- 294.Bourcier S, Benoist JF, Clerc F, Rigal O, Taghi M, Hoppilliard Y. Rapid Communications in Mass Spectrometry. 2006;20:1405. doi: 10.1002/rcm.2459. [DOI] [PubMed] [Google Scholar]
- 295.Hooper SE, Anderson MR. Electroanalysis. 2008;20:1032. [Google Scholar]
- 296.Zhao XE, Suo YR. Talanta. 2008;76:690. doi: 10.1016/j.talanta.2008.04.032. [DOI] [PubMed] [Google Scholar]
- 297.Zhang XZ, Rauch A, Lee H, Xiao HB, Rainer G, Logothetis NK. Rapid Communications in Mass Spectrometry. 2007;21:3621. doi: 10.1002/rcm.3251. [DOI] [PubMed] [Google Scholar]
- 298.Yao T, Okano G. Analytical Sciences. 2008;24:1469. doi: 10.2116/analsci.24.1469. [DOI] [PubMed] [Google Scholar]
- 299.Boo H, Jeong RA, Park S, Kim KS, An KH, Lee YH, Han JH, Kim HC, Chung TD. Analytical Chemistry. 2006;78:617. doi: 10.1021/ac0508595. [DOI] [PubMed] [Google Scholar]
- 300.Rocchitta G, Migheli R, Dedola S, Calia G, Desole MS, Miele E, Lowry JP, O’Neill RD, Serra PA. Sensors and Actuators B-Chemical. 2007;126:700. [Google Scholar]
- 301.Kirwan SM, Rocchitta G, McMahon CP, Craig JD, Killoran SJ, O’Brien KB, Serra PA, Lowry JP, O’Neill RD. Sensors. 2007;7:420. [Google Scholar]
- 302.Kottegoda S, Shaik I, Shippy SA. Journal of Neuroscience Methods. 2002;121:93. doi: 10.1016/s0165-0270(02)00245-5. [DOI] [PubMed] [Google Scholar]
- 303.Kennedy RT, Thompson JE, Vickroy TW. Journal of Neuroscience Methods. 2002;114:39. doi: 10.1016/s0165-0270(01)00506-4. [DOI] [PubMed] [Google Scholar]
- 304.Wang M, Roman GT, Schultz K, Jennings C, Kennedy RT. Analytical Chemistry. 2008;80:5607. doi: 10.1021/ac800622s. [DOI] [PMC free article] [PubMed] [Google Scholar]