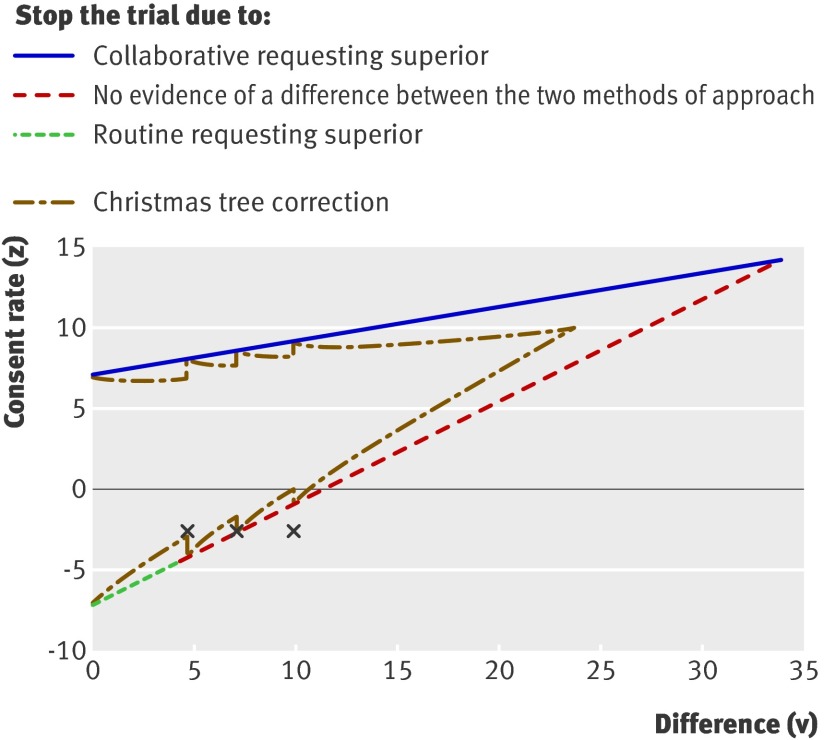
Fig 2 Adjusted difference in consent rates (Z) plotted against statistic summarising information about difference (V), which is proportional to number of sets of relatives. Three crosses correspond to planned analyses at 100 and 150 patients and final analysis at 201 patients. Figure shows routine trial stopping boundaries and boundaries adjusted for discrete monitoring (Christmas tree correction)

An official website of the United States government
Here's how you know
Official websites use .gov
A
.gov website belongs to an official
government organization in the United States.
Secure .gov websites use HTTPS
A lock (
) or https:// means you've safely
connected to the .gov website. Share sensitive
information only on official, secure websites.
