Abstract
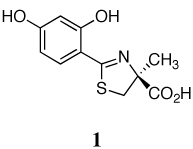
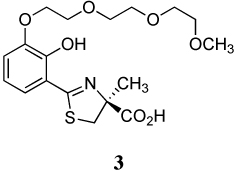
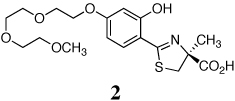
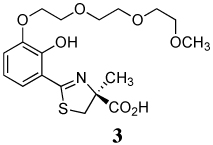
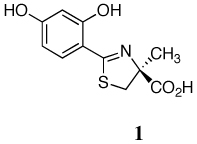
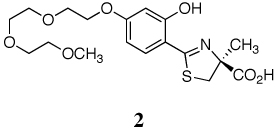
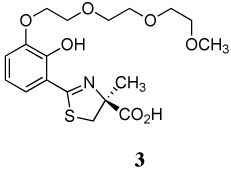
A series of iron-clearing efficiencies (ICEs), ferrokinetics, and toxicity studies for (S)-2-(2,4-dihydroxyphenyl)-4,5-dihydro-4-methyl-4-thiazolecarboxylic acid (deferitrin, 1), (S)-4,5-dihydro-2-[2-hydroxy-4-(3,6,9-trioxadecyloxy)phenyl]-4-methyl-4-thiazolecarboxylic acid (2) and (S)-4,5-dihydro-2-[2-hydroxy-3-(3,6,9-trioxadecyloxy)phenyl]-4-methyl-4-thiazolecarboxylic acid (3) are reported. The ICEs in rodents are shown to be dose-dependent and saturable for ligands 2 and 3 and superior to 1. Both polyether analogues in subcutaneous (sc) versus oral (po) administration in rodents and primates demonstrated excellent bioavailability. Finally, in a series of toxicity studies of ligands 1–3, the dosing regimen was shown to have a profound effect in animals treated with ligand 1. When ligand 1 was given at doses of 237 µmol/kg/day twice a day (b.i.d.), there was serious proximal tubule damage versus 474 µmol/kg/day once daily (s.i.d.). With 2 and 3, in iron-overloaded and/or non-iron-loaded rodents, kidney histopathologies remained normal.
Although iron comprises 5% of the earth’s crust, living systems have great difficulty in accessing and managing this vital micronutrient. The low solubility of Fe(III) hydroxide (Ksp = 1 × 10−39),1 the predominant form of the metal in the biosphere, has led to the development of sophisticated iron storage and transport systems in nature. Microorganisms utilize low molecular weight, virtually ferric ion-specific ligands, siderophores2–6 higher eukaryotes tend to employ proteins to transport and store iron (e.g., transferrin and ferritin, respectively).7–9
Humans absorb and excrete only about 1 mg of the metal daily; there is no effective mechanism for the excretion of excess iron.10 In humans, nontransferrin-bound plasma iron, a heterogeneous pool of the metal in the circulation, unmanaged iron, seems to be a principal source of iron-mediated organ damage. Introduction of excess iron into this closed system, whether derived from transfused red blood cells11–13 or from increased absorption of dietary iron,14, 15 leads to a build up of the metal in the liver, heart, pancreas, and elsewhere. Such iron accumulation eventually produces (i) liver disease that may progress to cirrhosis,16–18 (ii) diabetes related both to iron-induced decreases in pancreatic β-cell secretion19, 20 and increases in hepatic insulin resistance, and (iii) heart disease, still the leading cause of death in thalassemia major21–23 and related forms of transfusional iron overload.
The toxicity associated with excess iron, whether a systemic or a focal problem, derives from its interaction with reactive oxygen species, for instance, endogenous hydrogen peroxide (H2O2).24–27 In the presence of Fe(II), H2O2 is reduced to the hydroxyl radical (HO•), a very reactive species, and HO−, a process known as the Fenton reaction. The Fe(III) liberated can be reduced back to Fe(II) via a variety of biological reductants (e.g., ascorbate), a problematic cycle. The hydroxyl radical reacts very quickly with a variety of cellular constituents and can initiate free radicals and radical-mediated chain processes that damage DNA and membranes as well as produce carcinogens.25, 28–30 The solution to the problem is to remove excess unmanaged iron.31 In the majority of patients with transfusion-dependent refractory anemias, treatment with a chelating agent capable of sequestering iron and permitting its excretion from the body is the only therapeutic approach available.
The iron-chelating agents that are now in use or that have been clinically evaluated32 include desferrioxamine B mesylate (DFOa), l,2-dimethyl-3-hydroxypyridin-4-one (deferiprone, L1),33–36 4-[3,5-bis(2-hydroxyphenyl)-l,2,4-triazol-l-yl]benzoic acid (deferasirox, ICL670A),37–40 and the desferrithiocin (DFT) analogue, (S)-2-(2,4-dihydroxyphenyl)-4,5-dihydro-4-methyl-4-thiazolecarboxylic acid [deferitrin (1), Table 1]. DFO, a hexacoordinate hydroxamate iron chelator produced by Streptomyces pilosus,41 is not orally active and is best administered sc by continuous infusion over long periods of time,11, 42 a patient compliance issue.11, 43 Deferiprone, an orally active bidentate chelator, is less efficient than sc DFO at removing iron.33–36 Whereas the orally active tridentate chelator deferasirox has now been approved by the FDA, it did not demonstrate noninferiority to DFO.37–40 Furthermore, Novartis has recently (December, 2007) updated the prescribing information40 for deferasirox: “There have been postmarketing reports of hepatic failure, some with a fatal outcome, in patients treated with Exjade. Most of these events occurred in patients greater than 55 years of age. Most reports of hepatic failure involved patients with significant comorbidities, including liver cirrhosis and multi-organ failure.” In addition, the prescribing information was also changed in April, 2007 to reflect renal toxicity: “Cases of acute renal failure, some with a fatal outcome, have been reported following the postmarketing use of Exjade (deferasirox). Most of the fatalities occurred in patients with multiple co-morbidities and who were in advanced stages of their hematological disorders.”40 Finally, ligand 1 is an orally active tridentate DFT analogue whose clinical development was recently halted. Although deferitrin was well tolerated in patients at doses of 5, 10, or 15 mg/kg/day once daily for up to 12 weeks, unacceptable renal toxicity was observed in three patients after only 4–5 weeks of treatment when the drug was given at a dose of 25 mg/kg/day (12.5 mg/kg b.i.d.).44
Table 1.
Iron-Clearing Activity of Desferrithiocin Analogues Given Orally to Non-Iron Overloaded Rodents
| Drug | N | Dose (µmol/kg) | Theoretical Fe (mg/kg) | Actual Fe (mg/kg) | Iron-Clearing Efficiency (%)a |
|---|---|---|---|---|---|
 |
8 | 300b | 8.38 | 0.089 ±0.068 | 1.1 ± 0.8c |
| 5 | 150b | 4.19 | 0.061 ±0.073 | 1.5 ±1.7 | |
 |
5 | 300d | 8.38 | 0.459 ±0.161 | 5.5 ± 1.9c |
| 4 | 150b | 4.19 | 0.471 ±0.176 | 11.2 ±4.2 | |
| 3 | 50b | 1.40 | 0.303 ±0.050 | 21.7 ±3.5 | |
 |
4 | 300b | 8.38 | 0.887 ±0.367 | 10.6 ± 4.4e |
| 4 | 150b | 4.19 | 0.782 ±0.121 | 18.7 ±2.9 | |
| 3 | 50b | 1.40 | 0.289 ± 0.062 | 20.7 ±4.4 | |
The efficiency of each compound was calculated by subtracting the iron excretion of control animals from the iron excretion of the treated animals. The number was then divided by the theoretical output; the result is expressed as a percent.
The compounds were given as their sodium salts, prepared by the addition of 1 equiv of NaOH to a suspension of the free acid in distilled water.
Data are from ref 45.
The ligand was solubilized in distilled water.
Data are from ref 46.
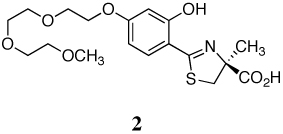
A previous investigation focused on the design of desferrithiocin analogues that balance the lipophilicity/toxicity relationship while iron-clearing efficiency (ICE) is maintained in hopes of eliminating nephrotoxicity.45 This study led to the less lipophilic, more water-soluble ligand, the polyether (S)-4,5-dihydro-2-[2-hydroxy-4-(3,6,9-trioxadecyloxy)phenyl]-4-methyl-4-thiazolecarboxylic acid (2).45 A subsequent study assessing the impact of introducing the 3,6,9-trioxadecyloxy group at various positions of the desazadesferrithiocin aromatic ring46 revealed the 3'-polyether analogue [(S)-4,5-dihydro-2-[2-hydroxy-3-(3,6,9-trioxadecyloxy)phenyl]-4-methyl-4-thiazolecarboxylic acid (3, Table 1) to also be an orally active iron chelator.46
The ICE of 1 in a non-iron-overloaded rodent model after oral (po) administration at 300 µmol/kg was shown to be 1.1 ± 0.8% (Table 1).45,47 Polyether 2, in which a 3,6,9-trioxadecyl group was fixed to the 4'-hydroxy of 1, performed significantly better at 300 µmol/kg, with an ICE of 5.5 ± 1.9% when administered po (p < 0.003 vs 1).45 The ICE of the 3'-polyether 3, again at 300 µmol/kg, was impressive, 10.6 ± 4.4% in rodents (Table 1).46 The efficiency of 1 given po to iron-loaded primates at a dose of 150 µmol/kg was found to be 16.8 ± 7.2% (Table 2).47 The corresponding polyether 2, given po at the same dose, performed very well in primates with an efficiency of 25.4 ± 7.4%.45 Polyether 3 given po at 75 µmol/kg, presented an ICE of 24.5 ± 7.6%.46
Table 2.
Iron-Clearing Activity of Desferrithiocin Analogues Given Orally and Subcutaneously to Rodents and Primates
| Desferrithiocin Analogue |
Rodenta | Primateb | |||
|---|---|---|---|---|---|
| Route | N | 300 µmol/kg | N | 150 µmol/kg | |
 |
po | 8c | l.l ± 0.8%d | 6c | 16.8 ± 72%d |
| sc | 4c | l.l ± 0.6%d | 5c | 15.9 ± 2.7 %d | |
 |
po | 5e | 5.5 ± 1.9%d | 4e | 25.4 ± 7.4%d |
| sc | 4e | 8.7 ± 2.6%d | 4e | 30.4 ± 7.2 %d | |
 |
po | 4c | 10.6 ± 4.49cf | 3c | 23.0 ± 4.1% |
| sc | 5c | 13.4 ± 4.5% | 4c | 21.5 ± 3.2% | |
In the rodents, the efficiency of each compound was calculated by subtracting the iron excretion of control animals from the iron excretion of the treated animals. The number was then divided by the theoretical output; the result is expressed as a percent.
In the primates, the efficiency was calculated by averaging the iron output for 4 days before the drug, subtracting these numbers from the 2-day iron clearance after the administration of the drug, and then dividing by the theoretical output; the result is expressed as a percent.
The compounds were given as their sodium salts, prepared by the addition of 1 equiv of NaOH to a suspension of the free acid in distilled water.
Data are from ref 45.
The ligand was solubilized in distilled water.
Data are from ref 46.
While earlier studies carried out in rodents clearly demonstrated 2 to be less nephrotoxic than the parent drug 1,45 the toxicity profile of 3 was not evaluated, nor were any dose–response studies carried out with any of the ligands to assess how such manipulation impacts on ICE and toxicity. The new synthetic schemes described below now make ligands 2 and 3 more readily accessible and make further biological evaluation possible.
Results and Discussion
Synthesis
The synthesis of 2 has recently been reported by this laboratory.45 Alkylation of the 4'-hydroxyl of the isopropyl ester of 1 using tri(ethylene glycol) monomethyl ether under Mitsunobu conditions (diisopropyl azodicarboxylate and triphenylphosphine in THF), filtration, and chromatography gave the isopropyl ester of 2 in 76% yield. Saponification of the ester furnished 2 in 95% yield, providing an overall yield of 72%.
In the present work, selective alkylation of ethyl ester 448 was accomplished by heating tosylate 5 (1.3 equiv) and potassium carbonate (2.1 equiv) in acetone, providing masked chelator 6 in 84% yield (Scheme 1). Cleavage of ethyl ester 6 as before afforded 2 in 93% yield. The new route to ligand 2 proceeds in greater overall yield, 78% vs 72%; moreover, attachment of the polyether chain in Scheme 1 employs inexpensive reagents without formation of triphenylphosphine oxide and diisopropyl 1,2-hydrazinedicarboxylate, simplifying purification.
Scheme 1. Synthesis of 2.
aReagents and conditions: (a) K2CO3 (2.1 equiv), acetone, 84%; (b) 50% NaOH (13 equiv), CH3OH, then 1 N HC1, rt, 16 h, 93%.
Ligand 3 has also been synthesized in this laboratory.46 (S)-2-(2,3-Dihydroxyphenyl)-4,5-dihydro-4-methyl-4-thiazolecarboxylic acid, which was made in 88% yield from amino acid cyclization with the appropriate nitrile,49 was converted to its ethyl ester in 98% yield. However, the two remaining steps to chelator 3 proceeded in only 15% yield. The polyether chain was appended to the 3'-hydroxyl under Mitsunobu conditions, producing the ethyl ester of 3 in 25% yield. Ester hydrolysis furnished 3 in 60% yield after purification on a reverse phase column, providing an overall yield of 13%.
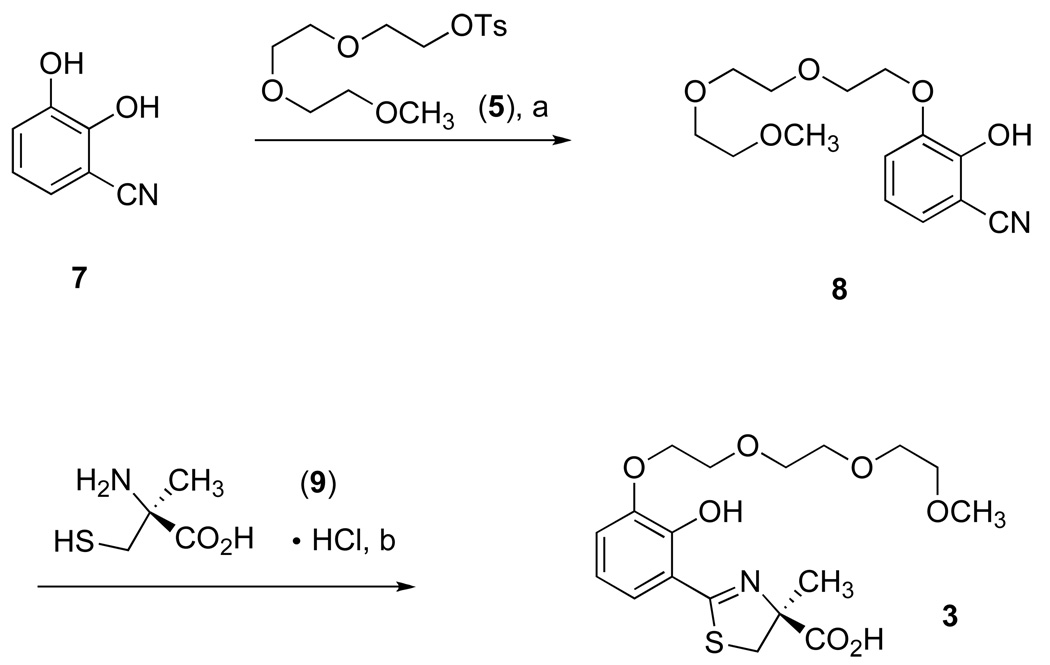
A more efficient synthesis of 3 is presented in Scheme 2. The less hindered phenolic group of 2,3-dihydroxybenzonitrile (7)49 was alkylated with tosylate 5 (1.0 equiv) and sodium hydride (2.0 equiv) in DMSO at room temperature,50 generating 8 in 70% chromatographed yield. Thus the triether chain has been attached in nearly three times the yield compared to the Mitsunobu coupling while avoiding troublesome byproducts. Cyclocondensation of nitrile 8 with (S)-α-methyl cysteine (9) in aqueous CH3OH buffered at pH 6 completed the synthesis of 3 in 90% yield. Since the unusual amino acid 9 was not introduced until the last step of Scheme 2, the carboxyl group did not require protection. The overall yield to 3 is 63%, much higher than from the previous route.
Scheme 2. Synthesis of 3.
aReagents and conditions: (a) 60% NaH (2.0 equiv), DMSO, 70%; (b) CH3OH (aq), pH 6, 70 °C, 16 h, 90%.
Chelator-Induced Iron Clearance and Iron Clearing Efficiency in Non-Iron-Overloaded Rodents: Dose Response Studies
Because there is a limited amount of chelatable iron available in an animal at any given time, the iron clearance, and therefore iron-clearing efficiency of a ligand, is saturable. The key to managing this phenomenon can be found in the ferrokinetics and the dose– response properties of the ligand. In this regard, the dose–response along with the corresponding ferrokinetics of ligands 1–3 given po were evaluated in the non-iron-overloaded, bile duct-cannulated rodent model. Table 1 probably best illustrates the significance of the differences in saturation properties between the three ligands. Four sets of numbers are provided: the ligand dose, the theoretical amount of iron this dose should clear if it were 100% efficient, the actual quantity of iron cleared, and ICE. Recall that ICE is calculated by dividing the actual amount of iron cleared by a given compound by the theoretical amount that should be cleared. For example, the theoretical iron excretion of 1, 2, or 3 administered at a dose of 300 µmol/kg is 8.38 mg Fe/kg (Table 1). When the dose is reduced to 150 µmol/kg, the theoretical iron excretion likewise decreases, to 4.19 mg Fe/kg, and when the dose is further dropped to 50 µmol/kg, the theoretical iron clearance is now only 1.40 mg Fe/kg (Table 1).
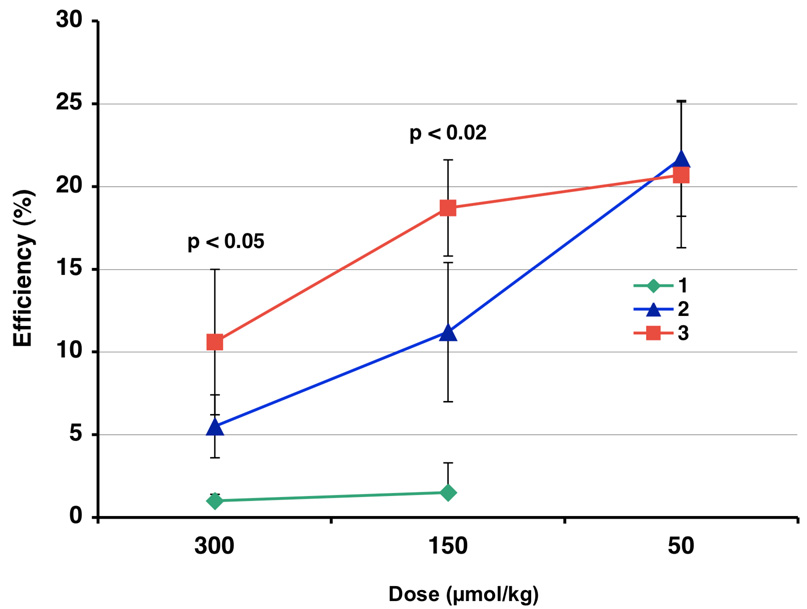
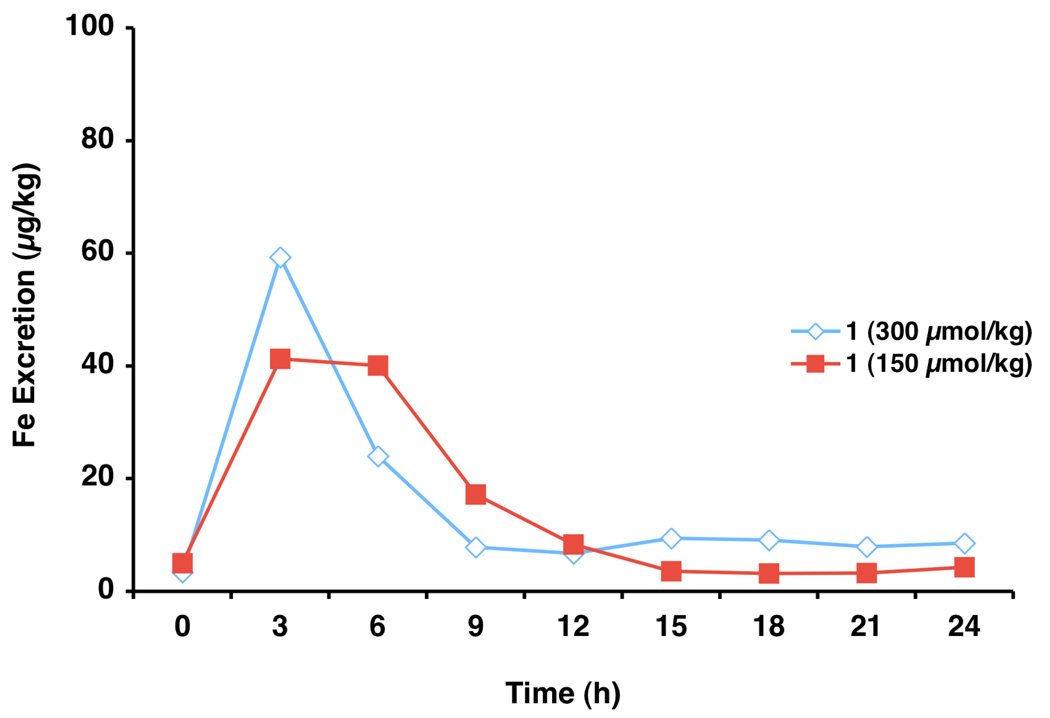
The parent drug 1 was given orally at 30051 or 150 µmol/kg to bile duct-cannulated rodents. Iron clearance was minimal at each dose, 0.089 ± 0.068 mg Fe/kg and 0.061 ± 0.073 mg Fe/kg, respectively (Table 1). Not surprisingly, the ICE values were poor in each instance (<2%), and both were within experimental error (Figure 1). Because of the significant serum albumin binding of 1 in rodents, unlike what was seen with the 4'-polyether 2, the saturable nature of iron clearance is likely overshadowed.46 At 300 and 150 µmol/kg, the iron clearance of 1 was virtually over by 9–12 h (Figure 2). At both doses, >98% of the ligand-induced iron excretion occurred in the bile.
Figure 1.
Dose–response curve – ICE for compounds 1–3 administered po in bile duct-cannulated rats.
Figure 2.
Biliary ferrokinetics of 1 in bile duct-cannulated rats. The compounds were administered po.
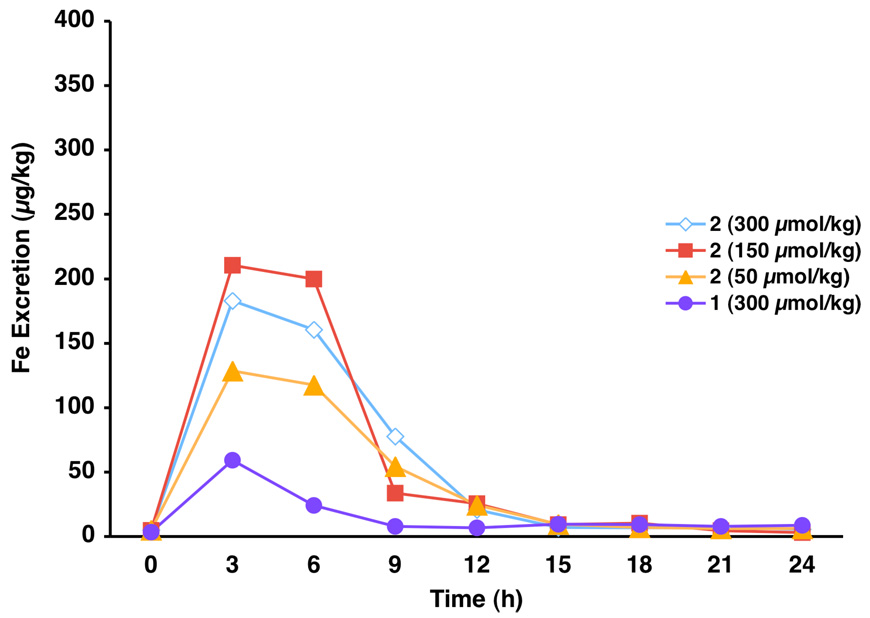
When 2 was given orally to rodents at a dose of 300 µmol/kg,45 the drug induced the excretion of 0.459 ± 0.161 mg Fe/kg and had an ICE of 5.5 ± 1.9% (Figure 1). When the dose of the chelator was reduced by half to 150 µmol/kg, the rats excreted a similar amount of iron, 0.471 ± 0.176 mg Fe/kg (p > 0.05). However, because the theoretical amount of iron is also proportionally lower, the ICE doubled, 11.2 ± 4.2% (Figure 1). Finally, when 2 was given po to the rats at a dose of 50 µmol/kg, the drug induced the clearance of 0.303 ± 0.050 mg Fe/kg (Table 1) and had an ICE of 21.7 ± 3.5% (Figure 1). This means that in reducing the dose from 300 to 50 µmol/kg, the ICE increased by nearly 4-fold, from 5.5 ± 1.9% (300 µmol/kg) to 21.7 ± 3.5% (50 µmol/kg). At 300, 150, and 50 µmol/kg of 2, the biliary ferrokinetics curves show that essentially all the deferration has ended at 12 h (Figure 3). In each instance, the iron was found largely in the bile (>95%).
Figure 3.
Biliary ferrokinetics of 2 vs 1 in bile duct-cannulated rats. The compounds were administered po.
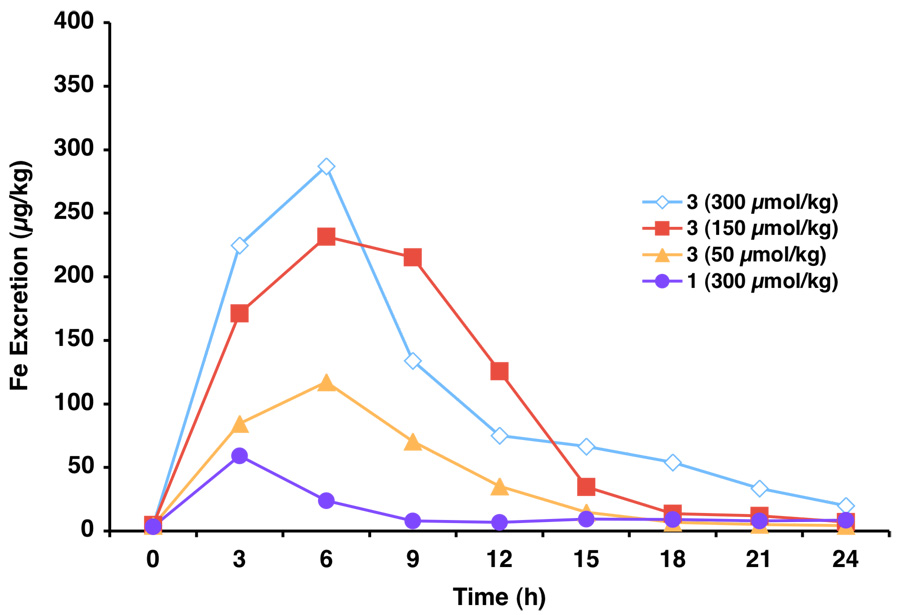
When rodents were given 3 po at 300 µmol/kg (Table 1), the drug caused the excretion of nearly twice as much iron as 2, 0.887 ± 0.367 mg Fe/kg and had an ICE of 10.6 ± 4.4%46 (Figure 1). Iron clearance persisted much longer for 3 than for 2, and was not complete until nearly 24 h postdrug (Figure 4). At a dose of 150 µmol/kg po, the rats excreted a similar amount of iron to what was excreted at 300 µmol/kg, 0.782 ± 0.121 mg Fe/kg (p > 0.05); the ICE nearly doubled (18.7 ± 2.9%, Figure 1). Iron excretion was essentially back to baseline in 18 h (Figure 4). Finally, 3 given po at a dose of 50 µmol/kg caused the excretion of 0.289 ± 0.062 mg Fe/kg (Table 1); the ICE was 20.7 ± 4.4% and deferration was complete by 15 h. In every instance, the majority of iron cleared was seen in the bile (>95%). Unlike with the 4'-polyether 2 in which the ICE doubled between the 150 µmol/kg dose and 50 µmol/kg doses, the change for 3'-polyether 3 was within error (Figure 1). This is in keeping with the idea that the iron-clearing capacity of 2 becomes saturated more quickly than with 3.
Figure 4.
Biliary ferrokinetics of 3 vs 1 in bile duct-cannulated rats. The compounds were administered po.
There are three notable differences between the 3' and 4'-polyether analogues: (i) although 4'-polyether 2 induced deferration is essentially over at 12 h at all doses, the induced iron clearance by the 3'-polyether 3 persists much longer; (ii) DFT analogue 3 causes the excretion of twice as much iron as 2 when given po at doses of 300 or 150 µmol/kg, and (iii) ICE versus dose–response curves indicate 2-promoted metal clearance quickly becomes saturated, while 3 is likely to be effective at a wider range of concentrations.
Finally, the ferrokinetics curves help to define potential multiple dosing scenarios. For example, because of the prolonged iron excretion observed with 3 at 150 or 300 µmol/kg (Figure 4), it is not unreasonable to expect that this drug could be given only once daily. However, the more rapid return to baseline iron excretion levels observed with the parent 1 or the 4'-polyether 2 may require administering a second dose 12 to 15 h after the initial exposure (Figure 2 and Figure 3). On the basis of the renal damage in rodents described below for b.i.d. versus s.i.d. dosing of 1 and the nephrotoxicity seen in the patients in the clinical trials given the drug b.i.d.,44 this kind of multiple exposure regimen is not possible with 1.
Iron-Clearing Efficiency in Non-Iron-Overloaded Rodents and Iron-Loaded Primates: Oral versus Subcutaneous Administration
The ICE values for a single ligand given either po or sc to non-iron-overloaded, bile duct-cannulated rodents are almost always within experimental error of each other. When 1 was given to rats at a dose of 300 µmol/kg either po or sc45 (Table 2), the ICE numbers were very low and within error 1.1 ± 0.8% (po) and 1.1 ± 0.6% (sc, p >0.05). The corresponding polyether 2 at the same dose, 300 µmol/kg, either po (5.5 ± 1.9%) or sc (8.7 ± 2.6%)45 had ICE values that were also within error (p > 0.05). Finally, the ICE values of 3 given to the rats po or sc at a dose of 300 µmol/kg were found to be within error of each other (Table 2), 10.6 ± 4.4%45 (po) and 13.4 ± 4.5% (sc, p > 0.05). These numbers are in keeping with the idea of high oral bioavailability of all three drugs (Table 2). This phenomenon seems relatively consistent throughout the series of desferrithiocin analogues and was also observed in the iron-loaded primates.45
When 1 was given to primates at 150 µmol/kg either po or sc45 (Table 2), the ICE numbers were within error 16.8 ± 7.2% (po) and 15.9 ± 2.7% (sc, p > 0.05). Polyether 2 at the same dose, 150 µmol/kg, either po45 (25.4 ± 7.4%) or sc45 (30.4 ± 7.2%), had ICE values also within error (p > 0.05). We previously reported the ICE of 3 given po at a dose of 75 µmol/kg to be 24.5 ± 7.6%.46 In the current study, the dose was increased to 150 µmol/kg and given to the primates either po or sc. The ICEs were found to be within error of each other (Table 2), 23.0 ±4.1% (po) and 21.5 ± 3.2% (sc, p > 0.05). These numbers are in keeping with the idea of high oral bioavailability of all three drugs (Table 2).45
Toxicity Evaluation in Rodents
In previous investigations we evaluated the toxicity of ligands l52 and 245 when given orally by gavage s.i.d. to non-iron-overload rats at a dose of 384 µmol/kg/day (equivalent to 100 mg/kg of the DFT sodium salt) for 10 days (Table 3). All of the rats survived the exposure period. Extensive tissues were sent out for histopathological analysis; all 2-treated kidneys were normal. However, the kidneys of the 1-treated rodents displayed mild damage to the proximal tubules.52 In the current study, ligand 3 was given under the same experimental conditions. All of the rats survived the exposure period. Extensive tissues were sent out for histopathological analysis; no drug-related abnormalities were found.
Table 3.
Toxicity Studies of Desferrithiocin Analogues in Rodents
| Desferrithiocin Analogue | Non-Renal Perfusion Protocol | Renal Perfusion Protocol | |
|---|---|---|---|
 |
10-d | 384 µmol/kg/d poa,b | 237 µmol/kg b.i.d. × 7 dc,d |
| 30-d | Iron-loaded (350 mg Fe/kg) | 474 µmol/kg s.i.d. × 7 da | |
| 119 µmol/kg/d pod,e | |||
 |
10-d | 384 µmol/kg/d pod,e | 237 µmol/kg b.i.d. × 7 dd,e |
| 30-d | Unloaded only | ||
| 63.3 µmol/kg/d pod,e | |||
 |
10-d | 384 µmiol/kg/d pod,e | |
| 28-d | Iron-loaded (350 mg Fe/kg) | ||
| 75 µmol/kg poe | |||
| 150 µmol/kg poe | 237 µmol/kg b.i.d. × 7 de | ||
| 300 µmol/kg poe | |||
| 28-d | Unloaded | ||
| 75 µmol/kg poe | |||
| 150 µmol/kg poe | |||
| 300 µmol/kg poe | |||
The tolerability of 153 and 245 were also previously evaluated when the compounds were given to the rodents for a much longer time period, 30 days. Because of the mild renal toxicity noted when 1 was given at 384 µmol/kg/day for 10 days,52 we took the added precaution of iron overloading the rats54, 55 prior to the 30-day exposure. Because there were no drug-related abnormalities noted with 2 in the 10-day study, these animals were not iron loaded. The rats were given the chelators at a dose that, in primates, causes the excretion of 450 µg Fe/kg. This is the suggested iron clearance required to keep a thalassemia patient in negative iron balance.56 Accordingly, rats were given 1 orally by gavage once daily for 30 days at a dose of 119 µmol/kg/day;53 rats were treated with 2 at a dose of 63.3 µmol/kg/day.45 All of the rats survived the dosing period. Extensive tissues were sent out for histopathological analysis; no drug-related abnormalities were found.
In the current study, ligand 3 was administered to the rats orally by gavage once daily for 28 days. Since there were no drug-related abnormalities noted with either the 10-day evaluation of 3 or in rodents treated with 2 for 30 days,45 we decided to administer drug 3, not just at the “usual” dose, the dose that causes the excretion of 450 µg Fe/kg in the primates (65.7 µmol/kg), but at higher doses as well. The higher doses were chosen in a deliberate attempt to induce renal toxicity. Accordingly, the compound was dosed at 75, 150, or 300 µmol/kg/day to iron-loaded animals (350 mg Fe/kg) as well as to rats with normal iron stores. Note that these doses are approximately 1, 2, and 4 times the dose necessary to excrete 450 µg/Fe/kg in the primates. There were six rodents per group. Unloaded and iron-loaded rats served as age-matched controls. All of the rats survived the dosing period. Although extensive tissues were taken, due to the number of animals involved in this study (48 rats) and the expense of performing the histopathologies, we elected to send out only the kidney and bone marrow. Neither renal toxicity nor any evidence of bone marrow toxicity was observed in any of the rodents at any of the doses studied. Bone marrow samples were checked because of previous reports of hydroxypyridones33–36 and deferasirox,40 causing agranulocytosis.
It is important to reiterate the ICE values in the non-iron-overloaded rodents for these three ligands: the ICE of 1 given po at a dose of 300 µmol/kg is 1.1 ±0.8%; the ICEs of the polyethers given po at the same dose are 5.5 ± 1.9% for the 4'-polyether 2, while the ICE of the 3'-polyether 3 is 10.6 ± 4.4%.45 This means that under comparable dosing regimens, we are removing significantly more iron with either of the polyether analogues than with the parent 1, 5 times as much iron with ligand 2 and 9.6 times as much with analogue 3. A similar scenario occurs when the ligands are given po at a dose of 150 µmol/kg: the ICE of the parent 1 is 1.5 ± 1.7%, while the ICEs for the 4'-polyether 2 and 3'-polyether 3 are 11.2 ± 4.2% and 18.7 ± 2.9%, respectively. Therefore, at a dose of 150 µmol/kg, analogue 2 causes the excretion of 7.5 times more iron than the parent 1, while 3 is 12.5 times more effective than the parent 1 (Table 1). Thus, the nephrotoxicity observed with 1 is not likely related to its global iron clearing properties.
A Comparison of the Impact of 1, 2, and 3 on Rodent Kidneys
In a previous investigation, ligands 1 and 2 were administered orally by gavage to rats twice daily at a dose of 237 µmol/kg/dose (474 µmol/kg/day) for 7 days.45 This dose is equivalent to 120 mg/kg of the parent 1. Untreated rats served as age-matched controls. One day postdrug, the rodents were anesthetized and the kidneys were perfusion-fixed; one kidney from each rat was dissected. While there was little difference in the renal structural architecture between the untreated animals and the 2 treated rats, kidneys from rodents given 1 b.i.d. showed regional, moderate to severe vacuolization in the proximal tubules, a loss of the brush border, and tubular extrusions toward the lumen.45 In addition, the distal tubules displayed moderate to severe vacuolization.45 Recall that although deferitrin was generally well tolerated when given to patients at doses of 5, 10, or 15 mg/kg once daily, administering the drug twice daily at 25 mg/kg/day (12.5 mg/kg/dose) was associated with unacceptable renal toxicity.44
In the current study, because of the apparent increase in renal toxicity observed in patients treated with deferitrin (1) twice daily versus once daily, we elected to determine if this damage could be reproduced in the rodents. To allow for a head-to-head comparison of the impact of b.i.d. versus s.i.d. dosing on nephrotoxicity, we elected to repeat our previously published b.i.d. dosing regimen.45 Accordingly, one group of rodents received 1 at a dose of 237 µmol/kg b.i.d. (474 µmol/kg/day) for 7 days; an additional group received the drug once daily at the same total dose, 474 µmol/kg/day, for 7 days. In addition, rodents were given 3 administered orally by gavage under the same dosing regimen, 237 µmol/kg b.i.d. (474 µmol/kg/day), for 7 days. Untreated animals served as age-matched controls. The rodents were anesthetized one day postdrug, and the kidneys were perfusion-fixed with glutaraldehyde in Tyrodes buffer. Thick sections (500 nm) were prepared for light microscopy.
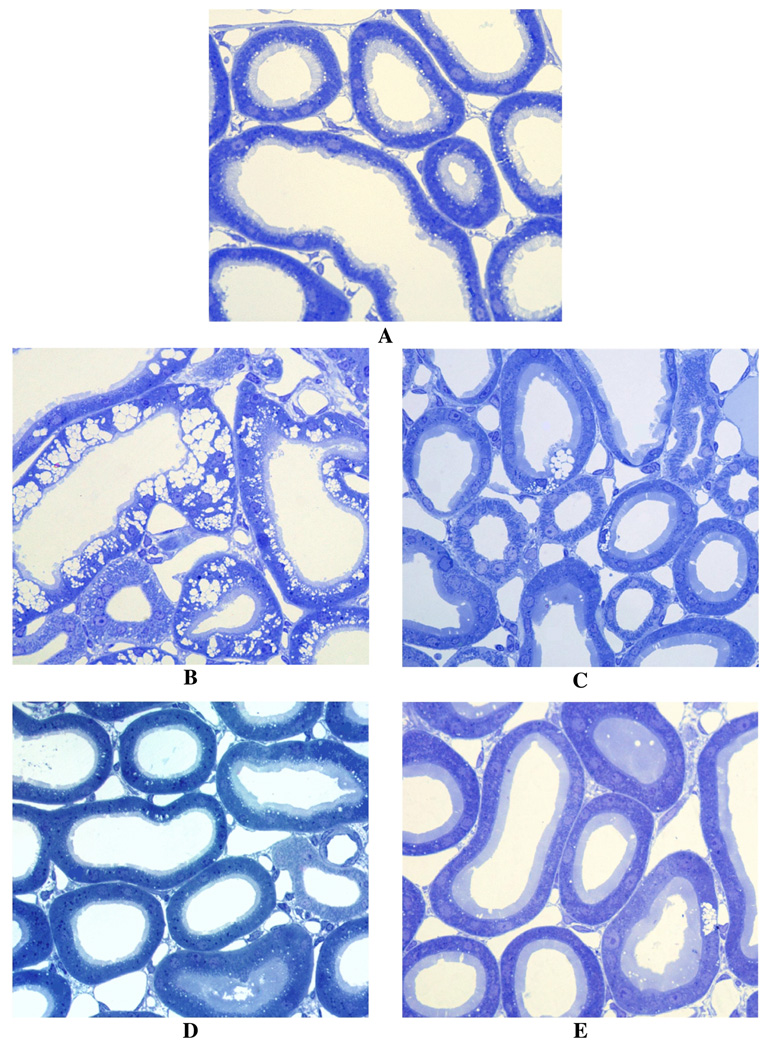
The results of the renal perfusion studies demonstrate profound differences in toxicity between the polyethers 2 and 3 and the parent ligand 1 and also show a dramatic reduction in toxicity when 1 was given once daily versus twice daily. Under light microscopy, the proximal and distal tubules of the untreated rats show normal tubular architecture (Figure 5A). The kidneys of rodents treated with the parent 1 given twice daily at 237 µmol/kg/dose (474 µmol/kg/day) for 7 days show heavy vacuolization and thinning of the apical membranes (Figure 5B). These results are virtually identical to what we had published previously.45 However, when 1 was given once daily at the same total dose, 474 µmol/kg/day for 7 days, although there was some vacuolization of the proximal tubule cells (Figure 5C), the damage was much less severe than when the drug was given twice daily (Figure 5B). Interestingly, and much to our surprise, besides some inclusion bodies seen when either 2 or 3 were given at 237 µmol/kg b.i.d. for 7 days, there was little if any damage to the proximal tubules (parts D and E of Figure 5, respectively). This allows for tremendous flexibility in dosing schedules with the polyethers.
Figure 5.
Renal Perfusion. Control (panel A), 1 237 µmol/kg b.i.d × 7 d (panel B), 1 474 µmol/kg s.i.d × 7 d (panel C), 2 237 µmol/kg b.i.d × 7 d (panel D), 3 237 µmol/kg b.i.d × 7 d (panel E). Magnification = 400 ×.
Tissue Distribution of Desferrithiocin Analogues in Rodents
The differences in behavior, for example, ICE, dose–response, and ferrokinetics, between the three ligands in rats prompted us to look more closely at the tissue distribution in rodents. In a previous investigation, we described the tissue distribution of the three ligands after they were given to rats sc at a dose of 300 µmol/kg.46 While the results were described in detail in the previous work, the data are included in Table 4 to allow for the comparison of how the route of administration (sc versus po) affects tissue distribution. In the current study, the rodents, three per group, were given a single 300 µmol/kg dose of the chelators po. The animals were sacrificed 1, 2, or 4 h postdrug; the liver, kidney, heart, pancreas, and blood were removed. The plasma was then separated from the blood cells. All samples were analyzed by HPLC for the appropriate ligands.
Table 4.
Tissue Distribution of Desferrithiocin Analogues in Rodentsa
| Liver | |||
|---|---|---|---|
| 1 | 2 | 3 | |
| time | (nmol/g wet weight) | (nmol/g wet weight) | (nmol/g wet weight) |
| 1 h (sc) | 80 ±7 | 339 ± 70 | 318 ±46 |
| 1 h (po) | 131 ±9 | 159 ±16 | 234 ± 58 |
| 2 h (sc) | 48 ±20 | 132 ±32 | 193 ±17 |
| 2 h (po) | 73 ±13 | 144 ±18 | 151 ±41 |
| 4 h (sc) | 25 ±4 | 67 ±12 | 168 ±17 |
| 4 h (po) | 44 ±5 | 35 ±14 | 87 ±18 |
| Kidney | |||
| 1 | 2 | 3 | |
| time | (nmol/g wet weight) | (nmol/g wet weight) | (nmol/g wet weight) |
| 1 h (sc) | 179 ±4 | 252 ± 10 | 259 ± 35 |
| 1 h (po) | 208 ± 54 | 114 ± 16 | 150 ± 66 |
| 2 h (sc) | 97 ±50 | 41 ±3 | 145 ± 27 |
| 2 h (po) | 100 ± 21 | 69 ±21 | 48 ±5 |
| 4 h (sc) | 27 ±7 | 34 ±13 | 90 ±8 |
| 4 h (po) | 61 ±9 | 10 ±1 | 15 ±2 |
| Heart | |||
| 1 | 2 | 3 | |
| time | (nmol/g wet weight) | (nmol/g wet weight) | (nmol/g wet weight) |
| 1 h (sc) | 13 ±1 | 35 ±7 | 16 ±1 |
| 1 h (po) | 8 ±1 | 17 ±2 | 9 ±2 |
| 2 h (sc) | 5 ±3 | 9 ±3 | 8 ±1 |
| 2 h (po) | 5 ±1 | 9 ±3 | 4 ±0 |
| 4 h (sc) | not detectable | 5 ±1 | 6 ±1 |
| 4 h (po) | 3 ±0 | not detectable | not detectable |
| Pancreas | |||
| 1 | 2 | 3 | |
| time | (nmol/g wet weight) | (nmol/g wet weight) | (nmol/g wet weight) |
| 1 h (sc) | 28 ±13 | 30 ±5 | 22 ±17 |
| 1 h (po) | 13 + 3 | 25 ±14 | 9 ±5 |
| 2 h (sc) | 6 ±1 | 30 ±25 | 30 ±26 |
| 2h(po) | 9 ±5 | 9 ±2 | 24 ±11 |
| 4 h (sc) | 6 ±3 | 13 ±5 | 12 ±5 |
| 4 h (po) | not detectable | not detectable | 6 ±2 |
| Plasma | |||
| 1 | 2 | 3 | |
| time | (µM) | (µM) | (µM) |
| 1 h (sc) | 34 ±7 | 140 ± 29 | 46 ±3 |
| 1 h (po) | 31 ±11 | 64 ±7 | 26 ±14 |
| 2 h (sc) | 13 ±3 | 16 ±4 | 24 ±5 |
| 2h(po) | 8 ±3 | 32 ±19 | 9 ±3 |
| 4 h (sc) | 2 ±0 | 5 ±3 | 13 ±2 |
| 4 h (po) | 5 ±0 | 2 ±0 | 2 ±0 |
The rodents (n = 3/time point) were given a single 300 µmol/kg dose of the chelators sc or po.
In the liver at 1 h postdrug, the relative concentrations of the chelators given po are 3 > 2 > 1. The concentration of both of the polyether ligands were similar to each other (p > 0.05) and were significantly greater than the parent 1, p < 0.04 for 2 and p < 0.05 for 3. At 2 h post-drug, the order was 3 ≈ 2 > 1. However, while the concentrations of both of the polyether ligands were similar to each other (p > 0.05), they were significantly greater than the parent 1, p < 0.003 for 2 and p < 0.04 for 3. At 4 h, while the 4'-polyether 2 and the parent 1 had levels that were within error of each other, the 3'-polyether 3 had the highest hepatic concentration, p < 0.03 versus 1 and p < 0.01 versus 2 (Table 4).
In the kidney at 1 h postdrug, the tissue concentration trend after po dosing was 1 ≈ 3 > 2. The renal concentration of the 2 was significantly lower than the parent 1 (p < 0.05). At 2 h, the order was now 1 > 2 > 3. The renal concentration of 3 was significantly lower than 1 (p < 0.02). At 4 h, the level of the parent 1 in the kidney was significantly greater than either of the polyether analogues, p < 0.004 versus 2 and p < 0.005 versus 3 (Table 4).
The levels of all three of the chelators in the heart after po dosing were quite low, <20 nmol/g wet weight at 1 h postdrug and <10 nmol/g wet weight 2 h postdrug. By 4 h, only the parent 1 was detectable.
In the pancreas at 1 h postdrug, the relative concentrations of the chelators given po are 2 > 1 > 3. However, none of the differences were significant. At 2 h, the pancreatic content of all three of the ligands are within error of each other. At 4 h postdrug, only 3 had detectable level.
In the plasma 1 h after po dosing, the relative drug levels are 2 > 1 ≈ 3. The concentration of the 4'-polyether 2 was significantly greater than both the parent 1 (p < 0.009) and the 3'-polyether 3 (p < 0.02). At 2 h after po dosing, the relative ligand concentration order was 2 > 3 ≈ 1, although none of the differences were significant. At 4 h postdrug, the plasma chelator concentrations were uniformly ≤5 µM (Table 4).
A comparison of how the tissue distribution of the individual ligands is affected by route of administration is also notable. In the case of ligand 1, the liver concentrations were significantly higher in the po versus sc dosed animals 1 h (p < 0.001) and 4 h (p < 0.005) postdrug. In the kidney, while the 1 and 2 h sc versus po chelator concentrations were similar, the level of the drug in the 4 h po dosed animals was significantly higher than the sc dosed rats, p < 0.001. In the heart, the chelator content was significantly higher in the sc versus po dosed animals at 1 h (p < 0.007); the levels were within error of each other at 2 h. However, by 4 h postdrug, the ligand was only detectable in the heart of the po dosed rats. Route of administration did not have any impact on pancreatic ligand content; all levels, where detectable, were within error of each other (Table 4). In the plasma, the chelator concentrations were significantly higher in the po versus sc dosed animals only in the 4 h time point, p < 0.001.
In the case of ligand 2, the liver and kidney concentrations were significantly higher in the sc versus po dosed animals 1 and 4 h postdrug. The p-values for the liver (sc versus po) were p < 0.001 (1 h) and p < 0.03 (4 h); the p-values for the kidney were <0.001 (1 h) and <0.04 (4 h). However, the sc versus po levels were within error of each other for the liver and kidney at 2 h. Route of administration did not have any impact on pancreatic ligand content; all levels were within error of each other, where detectable. In the heart and plasma, the chelator concentrations, where detectable, were significantly higher in the sc versus po dosed animals only in the 1 h time point, p < 0.04 (heart) and p < 0.02 (plasma).
In the case of analogue 3, the concentration of the drug in the liver was not affected by route of administration at the 1 and 2 h time points. However, the chelator content was significantly higher in the liver of the sc versus po dosed animals 4 h postdrug, p < 0.003. In the kidney, the chelator content was significantly greater for the sc versus po dosed animals at all time points, p < 0.04, p < 0.01, and p < 0.001 for 1, 2, and 4 h, respectively. In the heart, the ligand content, where detectable, was also significantly greater for the sc versus po dosed animals at the 1 and 2 h time points, p < 0.05 and p < 0.009. Route of administration did not have any impact on pancreatic ligand content; all levels were within error of each other (Table 4). The chelator content in the plasma of the sc versus po dosed animals was higher at the 2 and 4 h time points, p < 0.007 and p < 0.006, respectively.
Conclusion
The synthetic schemes for assembling 2 and 3 offer significant improvements over the initial methodologies. Although prior methods generated enough ligand to determine proof of principle, because of low yields and separation problems, they did not lend themselves to scale-up for the level of systematic and inclusive biological studies required to assess the clinical potential of the ligands.
While the ICE of the parent drug 1 in rodents was uniformly poor at both evaluated 300 and 150 µmol/kg doses (≤1.5%), the polyethers 2 and 3 were significantly more efficient at all doses (Table 1). However, there were rather profound differences in the ICE versus dose response curves for the two polyether analogues in rodents (Figure 1). In both instances, their deferration properties were shown to be saturable. The ICE for 2 increased from 5.5 ± 1.9% to 21.7 ± 3.5%, a nearly 4-fold difference, as the dose was decreased from 300 to 50 µmol/kg. The ICE for 3 increased from 10.6 ± 4.4% to 20.7 ± 4.4%, again on moving from 300 to 50 µmol/kg. However, the change was not nearly as great with the 3'-polyether analogue 3, only a 2-fold difference, suggesting greater flexibility in dosing ranges. In addition, 3 was significantly more effective than the 4'-polyether analogue 2 when given po at 150 or 300 µmol/kg (Table 1). The other notable difference between the two polyether analogues can be found in their ferrokinetic profiles (Figure 3 and Figure 4). At all concentrations, ligand-induced deferration is over more quickly with 2 (Figure 3) than for 3 (Figure 4). This data will serve as a useful guide for dose scheduling.
In both the rats and the primates, the po versus sc data for all three ligands strongly suggest good oral bioavailability. Although complete pharmacokinetic studies remain to be carried out, the ICE values are essentially the same whether the drug is given po or sc. The tissue distribution relative chelator levels follow the order liver > kidney > plasma > pancreas > heart. The sc versus po dosing data suggest generally higher concentrations early on with sc administered drug. The differences, though, are hardly profound, in keeping with the high oral bioavailability of these ligands.
Finally, and most important, are the data surrounding the toxicity studies. Both the impact of the polyether side chain and the dosing schedule (s.i.d. vs b.i.d) were shown to have a profound effect on nephrotoxicity. In the first study, non-iron-loaded rodents were given 384 µmol/kg/day po of either 1, 2, or 3 for 10 days and then sacrificed (Table 3). All histopathologies were normal except for the kidneys of rats treated with 1, which showed mild nephrotoxicity.52 In a second trial, iron-loaded rodents were given 119 µmol/kg po of 1 for 30 days and sacrificed. No drug-related abnormalities were noted. When unloaded rodents were given 63.3 µmol/kg po of 2, a dose which clears the same amount of iron in the primates as 119 µmol/kg of 1, for 30 days and sacrificed, all histopathologies were normal.45 In a final experiment with 3, two sets of animals were studied, one iron-loaded and one non-iron-loaded. In each instance, groups of six animals were given either 75, 150, or 300 µmol/kg po of the ligand once daily for 28 days and then sacrificed. Note that the higher doses were intentionally chosen in an attempt to induce renal toxicity. Because of the number of tissue samples and the results from the 10-day, 384-µmol/kg/day experiments, we elected only to evaluate the histopathologies of the kidneys and bone marrow; all were normal.
Certainly, the most astounding finding relates to dosing schedules in the renal perfusion studies. When non-iron-overloaded rodents were given a dose of 474 µmol/kg of 1 po s.i.d. for 7 days, anesthetized, and their kidneys perfused and fixed, light microscopy of the samples revealed moderate damage to the proximal tubules, most notable, vacuolization. However, when the same dose, 474 µmol/kg/day, was split in half to 237 µmol/kg/day and given b.i.d. for 7 days, the difference in proximal tubule damage was profoundly worse45 (Figure 5). Thus, b.i.d. dosing of this drug would not be a viable plan. This strongly suggests that careful consideration must be given as to how often chelators are dosed relative to nephrotoxicity. However, when either 4'-polyether analogue 2 or 3'-polyether 3 was given at 237 µmol/kg/day po b.i.d. (474 µmol/kg/day) for 7 days, there were only minor architectural changes in the proximal tubules (occasional pale, refractile inclusions in the S1 segments), which were more prevalent in the 2 treated rats, further underscoring the likely large therapeutic window for these ligands.
Experimental Section
Cebus apella monkeys were obtained from World Wide Primates (Miami, FL). Male Sprague– Dawley rats were procured from Harlan Sprague–Dawley (Indianapolis, IN). Ultrapure salts were obtained from Johnson Matthey Electronics (Royston, UK). All hematological and biochemical studies57 were performed by Antech Diagnostics (Tampa, FL). Atomic absorption (AA) measurements were made on a Perkin-Elmer model 5100 PC (Norwalk, CT). Histopathological analysis was carried out by Florida Vet Path (Bushnell, FL).
Cannulation of Bile Duct in Non-Iron-Overloaded Rats
The cannulation has been described previously.57, 58 Bile samples were collected from male Sprague–Dawley rats (400–450 g) at 3 h intervals for 24 h. The urine sample was taken at 24 h. Sample collection and handling are as previously described.57, 58
Iron Loading of Rats
Male Sprague–Dawley rats initially weighing approximately 200–225 g were iron overloaded by the intraperitoneal administration of iron dextran (Sigma, 100 mg of iron/mL). The rats were given four doses of the iron (105 mg/kg/dose) over a two week period on a Monday, Friday, Monday, Friday schedule. After a two week equilibration period, the animals were weighed again and their total iron burden was determined (total mg of Fe/final body weight). The rats were then assigned to groups so that the body weight and iron burden between groups were within error of each other.
Iron Loading of C. apella Monkeys
The monkeys (3.5–4 kg) were iron overloaded with iv iron dextran as specified in earlier publications to provide about 500 mg of iron per kg of body weight;59 the serum transferrin iron saturation rose to between 70 and 80%. At least 20 half-lives, 60 days,60 elapsed before any of the animals were used in experiments evaluating iron-chelating agents.
Primate Fecal and Urine Samples
Fecal and urine samples were collected at 24 h intervals and processed as described previously.57, 58,61 Briefly, the collections began 4 days prior to the administration of the test drug and continued for an additional 5 days after the drug was given. Iron concentrations were determined by flame atomic absorption spectroscopy as presented in other publications.58, 62
Drug Preparation and Administration
In the iron clearing experiments the rats were given a single 50, 150, or 300 µmol/kg dose of the drugs po and/or sc. The compounds were administered as (1) a solution in water, 2 300 µmol/kg dose only or (2) as the monosodium salt of the compound of interest (prepared by addition of the free acid to 1 equivalent of NaOH). The chelators were given to the monkeys po and sc at a dose of 150 µmol/kg. The drugs were prepared as for the rats; 2 was given po and sc as a solution in water.
Calculation of Iron Chelator Efficiency
The theoretical iron outputs of the chelators were generated on the basis of a 2:1 ligand: iron complex. The efficiencies in the rats and monkeys were calculated as set forth elsewhere.52 Data are presented as the mean ± the standard error of the mean; p-values were generated via a one-tailed Student’s t-test in which the inequality of variances was assumed; and a p-value of <0.05 was considered significant.
Toxicity Evaluation in Rodents
Male Sprague–Dawley rats (250–300 g) were fasted overnight and were given 1, 2, or 3 po by gavage once daily for 10 days at a dose of 384 µmol/kg/day. This dose is equivalent to 100 mg/kg/day of the DFT sodium salt. The animals were fed ∼3 h postdrug and had access to food for 5 h before being fasted overnight. The rats were euthanized 24 h postdrug and extensive tissues were collected for histopathological analysis.
The rats given 1 or 2 in the 30 day experiments were given the drugs po at a dose that, in the primates, results in the excretion of 450 µg of Fe/kg, 119 µmol/kg/day and 63.3 µmol/kg/day, respectively. Rats treated with 1 had been previously iron overloaded to a level of 350 mg Fe/kg; the rodents treated with 2 for 30 days were not iron-loaded. Iron-overloaded and non-iron loaded rats were given 3 po at doses of 75, 150, and 300 µmol/kg/day for 28 days. Note that the doses chosen for 3 are approximately 1, 2, and 4 times the dose necessary to cause the excretion of 450 µg Fe/kg in the primates. Because of the protracted nature of the 28 or 30 days experiments, the animals were not fasted. To minimize food content in the stomach, the drug was not given until the afternoon. Additional animals served as age-matched controls. The rats were euthanized 24 h postdrug and extensive tissues were collected for histopathological analysis.
A Comparison of the Impact of 1, 2, and 3 on Rodent Kidneys
Male Sprague–Dawley rats (200– 250 g) were housed two to a cage and were fasted overnight. The rats were given 1, 2, or 3 po twice daily at a dose of 237 µmol/kg/dose (474 µmol/kg/day) for 7 days. The rats were fed approximately 3 h postdrug and had access to food for 5 h before being fasted again. An additional group of rodents was given 1 once daily at a dose of 474 µmol/kg/day for 7 days. The single dose was given in the mornings; the rats were fed and fasted as described for the b.i.d. dosed animals. Untreated rodents served as age-matched controls.
One day postdrug, the rats were anesthetized with sodium pentobarbital. The abdominal aorta was isolated and cleansed of extraneous tissue and cannulated. The kidneys were perfusion-fixed with glutaraldehyde in Tyrode’s buffer containing 3% PVP, removed, and immersed in a glass vial containing fresh fixative at room temperature. Four hours later, the kidneys were again rinsed with Tyrode’s buffer. The tissue samples were placed in sodium cacodylate. After two rinses with cacodylate buffer, the samples were dehydrated with graded concentrations of ethyl alcohol and infiltrated with propylene oxide overnight. Finally, they were embedded in TAAB with DMP-30. The TAAB was polymerized at 60 °C for 48 h.
Thick sections (500 nm) were cut from TAAB embedded tissue, mounted onto glass slides, and stained with Toluidine Blue. The tissue slices were photographed with a Zeiss Axioskop II at 400× magnification.
Collection of Tissue Samples from Rodents: Tissue Distribution
Male Sprague–Dawley rats (250–350 g) were given 1, 2, or 3 po and sc at a dose of 300 µmol/kg. The compounds were administered as (1) a solution in water, 2 (sc) or (2) as the monosodium salt of the compound of interest (prepared by addition of the free acid to 1 equivalent of NaOH) 1, 2 (po), and 3. At times 1, 2, and 4 h after dosing (n = 3 rats per time point), the animals were euthanized by exposure to C02 gas. Blood was obtained via cardiac puncture into vacutainers containing sodium citrate. The blood was centrifuged and the plasma separated for analysis. The liver, heart, kidneys, and pancreas were then removed from the animals.
Tissue Analytical Methods
Tissue samples from animals treated with 1–3 were prepared for HPLC analysis as previously described.45, 46 Analytical separation was performed on a Discovery RP Amide C16 HPLC system with UV detection at 310 nm as discussed previously.63, 64 Mobile phase and chromatographic conditions were as follows: solvent A, 5% CH3CN/95% buffer; solvent B, 60% CH3CN/40% buffer.
The concentrations were calculated from the peak area fitted to calibration curves by nonweighted least-squares linear regression with Rainin Dynamax HPLC Method Manager software (Rainin Instrument Co.). The method had a detection limit of 0.25 µM and was reproducible and linear over a range of 1–1000 µM.
Tissue distribution data are presented as the mean; p-values were generated via a one-tailed student’s t-test, in which the inequality of variances was assumed and a p-value of <0.05 was considered significant.
Synthetic Methods
Reagents were purchased from Aldrich Chemical Co. (Milwaukee, WI), and Fisher Optima-grade solvents were routinely used. Reactions were run under a nitrogen atmosphere, and organic extracts were dried with sodium sulfate. Silica gel 40–63 from SiliCycle, Inc. (Quebec City, QC, Canada) was used for column chromatography. Glassware that was presoaked in 3 N HCl for 15 min, washed with distilled water and distilled EtOH, and oven-dried was used in the isolation of 2 and 3. Optical rotations were run at 589 nm (sodium D line) utilizing a Perkin-Elmer 341 polarimeter, with c being concentration in grams of compound per 100 mL of CHC13 solution. Chemical shifts (δ) for 1H NMR spectra at 400 MHz are given in parts per million downfield from tetramethylsilane for CDC13 (not indicated) or sodium 3-(trimethylsilyl)propionate-2,2,3,3-d4for D2O. Chemical shifts (δ) for 13C NMR spectra at 100 MHz are given in parts per million referenced to 1,4-dioxane (5 67.19) in D2O or to the residual solvent resonance in CDCl3 (δ 77.16). Coupling constants (J) are in hertz. Elemental analyses were performed by Atlantic Microlabs (Norcross, GA).
(S)-4,5-Dihydro-2-[ 2-hydroxy-4-(3,6,9-trioxadecyloxy)phenyl]-4-methyl-4-thiazolecarboxylic Acid (2)
A solution of 50% (w/w) NaOH (10.4 mL, 199 mmol) in CH3OH (90 mL) was added to 6 (6.54 g, 15.3 mmol) in CH3OH (200 mL) with ice bath cooling. The reaction mixture was stirred at room temperature for 16 h, and the bulk of the solvent was removed by rotary evaporation. The residue was treated with dilute NaCl (150 mL) and was extracted with ether (3 × 150 mL). The basic aqueous phase was cooled in ice, acidified with 2 N HCl to a pH ≈ 2, and extracted with EtOAc (4 × 100 mL). The EtOAc extracts were washed with saturated NaCl (200 mL) and were concentrated in vacuo. Drying under high vacuum furnished 5.67 g of 245 (93%) as an orange oil: [α]25 +53.1° (c 0.98). 1H NMR (D2O) δ: 1.76 (s, 3 H), 3.35 (s, 3 H), 3.54–3.61 (m, 3 H), 3.64–3.72 (m, 4 H), 3.74–3.78 (m, 2 H), 3.90–3.94 (m, 2 H), 3.96 (d, 1 H, J = 12.0), 4.25–4.29 (m, 2 H), 6.53 (d, 1 H, J = 2.4), 6.64 (dd, 1 H, J = 9.0, 2.2), 7.61 (d, 1 H, J = 9.2). 13C NMR (D2O) δ: 23.65, 39.56, 58.65, 68.34, 69.33, 70.07, 70.18, 70.44, 71.62, 77.58, 102.11, 106.72, 109.66, 134.67, 161.27, 167.07, 176.86, 180.70. Anal. (C18H25NO7S) C, H, N.
(S)-4,5-Dihydro-2-[2-hydroxy-3-(3,6,9-trioxadecyloxy)phenyl]-4-methyl-4-thiazolecarboxylic Acid (3)
Compound 8 (7.63 g, 27.1 mmol), degassed 0.1 M pH 5.95 phosphate buffer (200 mL),65 9 (6.98 g, 40.7 mmol), and NaHCO3 (4.33 g, 51.5 mmol, in portions) were successively added to distilled, degassed CH3OH (200 mL). The reaction mixture, pH 6.2–6.6, was heated at 70 °C for 72 h. After cooling to room temperature, the bulk of the solvent was removed by rotary evaporation. The residue was dissolved in 8% NaHC03 (200 mL) and was extracted with CHCl3 (3 × 100 mL). The aqueous portion was cooled in an ice–water bath, acidified to pH ≈ 1 with 5 N HC1, and extracted with EtOAc (4 × 100 mL). The EtOAc extracts were washed with saturated NaCl and were concentrated in vacuo. Drying under high vacuum furnished 9.74 g of 346 (90%) as an orange oil: [α]20 +61.9° (c 1.55). 1H NMR (D2O) δ: 1.77 (s, 3 H), 3.35 (s, 3 H), 3.56–3.62 (m, 3 H), 3.64–3.73 (m, 4 H), 3.75–3.79 (m, 2 H), 3.92–3.96 (m, 2 H), 3.99 (d, 1 H, J = 11.6), 4.25–4.31 (m, 2 H), 6.99 (t, 1 H, J = 8.2), 7.26–7.33 (m, 2 H); 13C NMR δ 24.52, 39.93, 59.07, 69.04, 69.83, 70.49, 70.64, 70.86, 71.97, 83.21, 116.33, 117.94, 118.50, 122.80, 147.67, 150.24, 172.38, 176.10. HRMS m/z calcd for C18H26NO7S, 400.1429 (M + H); found, 400.1413.
Ethyl (S)-4,5-Dihydro-2-[2-hydroxy-4-(3,6,9-trioxadecyloxy)phenyl]-4-methyl-4-thiazole-carboxylate (6)
Flame activated K2CO3 (5.05 g, 36.6 mmol) followed by 5 (11.11 g, 34.9 mmol) in acetone (50 mL) were added to 448 (9.35 g, 33.2 mmol) in acetone (300 mL). The reaction mixture was heated at reflux for 3 days. Additional K2CO3 (4.59 g, 33.2 mmol) and 5 (2.12 g, 6.65 mmol) in acetone (5 mL) were added, and the reaction mixture was heated at reflux for 1 day. After cooling to room temperature, solids were filtered and the solvent was removed by rotary evaporation. The residue was dissolved in 1:1 0.5 M citric acid/saturated NaCl (320 mL) and was extracted with EtOAc (3 × 150 mL). The combined organic extracts were washed with distilled H2O (200 mL) and saturated NaCl (200 mL) and were concentrated in vacuo. Purification using flash column chromatography eluting with 50% EtOAc/petroleum ether generated 12.0 g of 645 (84%) as an oil: [α]23 +40.2 (c 1.09). 1H NMR δ: 1.30 (t, 3 H, J = 7.2) 1.66 (s, 3 H), 3.19 (d, 1 H, J = 11.2), 3.38 (s, 3 H), 3.54–3.57 (m, 2 H), 3.64–3.70 (m, 4 H), 3.72–3.76 (m, 2 H), 3.81–3.88 (m, 3 H), 4.12–4.17 (m, 2 H), 4.20–4.28 (m, 2 H), 6.46 (dd, 1 H, J = 8.8, 2.4), 6.49 (d, 1 H, J = 2.4), 7.28 (d, 1 H, J = 8.4), 12.69 (s, 1 H); 13C NMR δ 14.21, 24.58, 39.94, 59.17, 62.01, 67.65, 69.60, 70.69, 70.76, 70.98, 72.03, 83.22, 101.51, 107.41, 109.98, 131.77, 161.27, 163.09, 170.90, 172.95. Anal. (C20H29NO7S) C, H, N.
2-Hydroxy-3-(3,6,9-trioxadecyloxy)benzonitrile (8)
Compound 749 (5.3 g, 39.2 mmol) was added to a suspension of 60% NaH (3.13 g, 78.2 mmol) in DMSO (60 mL) using oven-dried glassware. After the reaction mixture was stirred at room temperature for 1 h, 5 (12.49 g, 39.22 mmol) in DMSO (25 mL) was introduced. After 24 h of stirring at room temperature, the reaction mixture was poured with stirring into cold water (100 mL) and was extracted with CHCl3 (3 × 100 mL). The aqueous phase was acidified to pH ≈ 1 with 6 N HC1 and was extracted with CHC13 (5 × 60 mL). The latter CHC13 extracts were concentrated in vacuo. Purification using column chromatography by gravity eluting with 10% CH3OH/CHCl3 gave 7.74 g of 8 (70%) as an oil. 1H NMR δ: 3.40 (s, 3 H), 3.58–3.62 (m, 2 H), 3.65–3.73 (m, 4 H), 3.75–3.78 (m, 2 H), 3.83–3.87 (m, 2 H), 4.14–4.18 (m, 2 H), 6.79–6.85 (m, 1 H), 7.09 (dd, 1 H, J = 7.8, 1.6), 7.15–7.18 (m, 1 H), 8.6 (s, 1 H). 13C NMR δ: 57.25, 67.76, 67.85, 68.79, 68.92, 69.06, 70.36, 98.38, 115.44, 116.55,118.51, 123.13, 145.98, 149.46. HRMS m/z calcd for C14H20NO5, 282.1341 (M + H); found, 282.1328.
Acknowledgment
The project described was supported by grant number R37DK049108 from the National Institute of Diabetes and Digestive and Kidney Diseases. The content is solely the responsibility of the authors and does not necessarily represent the official views of the National Institute of Diabetes and Digestive and Kidney Diseases or the National Institutes of Health. We thank Jill Verlander Reed and Hua Yao for the perfusion of the rodent kidneys, Elizabeth M. Nelson, Tanaya Lindstrom, and Katie Ratliff–Thompson for their technical assistance, and Carrie A. Blaustein for her editorial and organizational support.
Footnotes
b.i.d., twice a day; DFO, desferrioxamine B mesylate; DFT, desferrithiocin [(S)-4,5-dihydro-2-(3-hydroxy-2-pyridinyl)-4-methyl-4-thiazolecarboxylic acid]; ICE, iron-clearing efficiency; s.i.d., once a day
References
- 1.Raymond KN, Carrano CJ. Coordination Chemistry and Microbial Iron Transport. Acc. Chem. Res. 1979;12:183–190. doi: 10.1021/acs.accounts.5b00301. [DOI] [PMC free article] [PubMed] [Google Scholar]
- 2.Bernier G, Girijavallabhan V, Murray A, Niyaz N, Ding P, Miller MJ, Malouin F. Desketoneoenactin-Siderophore Conjugates for Candida: Evidence of Iron Transport-Dependent Species Selectivity. Antimicrob. Agents Chemother. 2005;49:241–248. doi: 10.1128/AAC.49.1.241-248.2005. [DOI] [PMC free article] [PubMed] [Google Scholar]
- 3.Walz AJ, Mollmann U, Miller MJ. Synthesis and Studies of Catechol-Containing Mycobactin S and T Analogs. Org. Biomol. Chem. 2007;5:1621–1628. doi: 10.1039/b703116e. [DOI] [PubMed] [Google Scholar]
- 4.Yuan WM, Gentil GD, Budde AD, Leong SA. Characterization of the Ustilago Maydis Sid2 GeneEncoding a Multidomain Peptide Synthetase in the Ferrichrome Biosynthetic Gene Cluster J. Bacteriol 20011834040–4051. [DOI] [PMC free article] [PubMed] [Google Scholar]
- 5.Byers BR, Arceneaux JE. Microbial Iron Transport: Iron Acquisition by Pathogenic Microorganisms. Met. Ions Biol. Syst. 1998;35:37–66. [PubMed] [Google Scholar]
- 6.Kalinowski DS, Richardson DR. The Evolution of Iron Chelators for the Treatment of Iron Overload Disease and Cancer. Pharmacol. Rev. 2005;57:547–583. doi: 10.1124/pr.57.4.2. [DOI] [PubMed] [Google Scholar]
- 7.Bergeron RJ. Iron: A Controlling Nutrient in Proliferative Processes. Trends Biochem. Sci. 1986;11:133–136. [Google Scholar]
- 8.Theil EC, Huynh BH. Ferritin Mineralization: Ferroxidation and Beyond. J. Inorg. Biochem. 1997;67:30. [Google Scholar]
- 9.Ponka P, Beaumont C, Richardson DR. Function and Regulation of Transferrin and Ferritin. Semin. Hematol. 1998;35:35–54. [PubMed] [Google Scholar]
- 10.Ponka P. Physiology and Pathophysiology of Iron Metabolism: Implications for Iron Chelation Therapy in Iron Overload. In: Bergeron RJ, Brittenham GM, editors. In The Development of Iron Chelators for Clinical Use. Boca Raton FL: CRC; 1994. pp. 1–29. [Google Scholar]
- 11.Olivieri NF, Brittenham GM. Iron-Chelating Therapy and the Treatment of Thalassemia. Blood. 1997;89:739–761. [PubMed] [Google Scholar]
- 12.Vichinsky EP. Current Issues with Blood Transfusions in Sickle Cell Disease. Semin. Hematol. 2001;38:14–22. doi: 10.1016/s0037-1963(01)90056-3. [DOI] [PubMed] [Google Scholar]
- 13.Kersten MJ, Lange R, Smeets ME, Vreugdenhil G, Roozendaal KJ, Lameijer W, Goudsmit R. Long-Term Treatment of Transfusional Iron Overload with the Oral Iron Chelator Deferiprone (L1): A Dutch Multicenter Trial. Ann. Hematol. 1996;73:247–252. doi: 10.1007/s002770050236. [DOI] [PubMed] [Google Scholar]
- 14.Conrad ME, Umbreit JN, Moore EG. Iron Absorption and Transport. Am. J. Med. Sci. 1999;318:213–229. doi: 10.1097/00000441-199910000-00002. [DOI] [PubMed] [Google Scholar]
- 15.Lieu PT, Heiskala M, Peterson PA, Yang Y. The Roles of Iron in Health and Disease. Mol. Aspects Med. 2001;22:1–87. doi: 10.1016/s0098-2997(00)00006-6. [DOI] [PubMed] [Google Scholar]
- 16.Angelucci E, Brittenham GM, McLaren CE, Ripalti M, Baronciani D, Giardini C, Galimberti M, Polchi P, Lucarelli G. Hepatic Iron Concentration and Total Body Iron Stores in Thalassemia Major. N. Engl. J. Med. 2000;343:327–331. doi: 10.1056/NEJM200008033430503. [DOI] [PubMed] [Google Scholar]
- 17.Bonkovsky HL, Lambrecht RW. Iron-Induced Liver Injury. Clin. Liver Dis. 2000;4:409–429. doi: 10.1016/s1089-3261(05)70116-1. vi–vii. [DOI] [PubMed] [Google Scholar]
- 18.Pietrangelo A. Mechanism of Iron Toxicity. Adv. Exp. Med. Biol. 2002;509:19–43. doi: 10.1007/978-1-4615-0593-8_2. [DOI] [PubMed] [Google Scholar]
- 19.Cario H, Holl RW, Debatin KM, Kohne E. Insulin Sensitivity and β-Cell Secretion in Thalassaemia Major with Secondary Haemochromatosis: Assessment by Oral Glucose Tolerance Test. Eur. J. Pediatr. 2003;162:139–146. doi: 10.1007/s00431-002-1121-7. [DOI] [PubMed] [Google Scholar]
- 20.Wojcik JP, Speechley MR, Kertesz AE, Chakrabarti S, Adams PC. Natural History of C282y Homozygotes for Hemochromatosis. Can. J. Gastroenterol. 2002;16:297–302. doi: 10.1155/2002/161569. [DOI] [PubMed] [Google Scholar]
- 21.Brittenham GM, Griffith PM, Nienhuis AW, McLaren CE, Young NS, Tucker EE, Allen CJ, Farrell DE, Harris JW. Efficacy of Deferoxamine in Preventing Complications of Iron Overload in Patients with Thalassemia Major. N. Engl. J. Med. 1994;331:567–573. doi: 10.1056/NEJM199409013310902. [DOI] [PubMed] [Google Scholar]
- 22.Brittenham GM. Disorders of Iron Metabolism:Iron Deficiency and Overload. In Hematology: Basic Principles and Practice. In: Hoffman R, Benz EJ, Shattil SJ, Furie B, Cohen HJ, Silberstein LE, McGave P, editors. 3rd ed. New York: Churchill Livingstone; 2000. pp. 397–428. [Google Scholar]
- 23.Zurlo MG, De Stefano P, Borgna-Pignatti C, Di Palma A, Piga A, Melevendi C, Di Gregorio F, Burattini MG, Terzoli S. Survival and Causes of Death in Thalassaemia Major. Lancet. 1989;2:27–30. doi: 10.1016/s0140-6736(89)90264-x. [DOI] [PubMed] [Google Scholar]
- 24.Graf E, Mahoney JR, Bryant RG, Eaton JW. Iron-Catalyzed Hydroxyl Radical Formation. Stringent Requirement for Free Iron Coordination Site. J. Biol. Chem. 1984;259:3620–3624. [PubMed] [Google Scholar]
- 25.Halliwell B. Free Radicals and Antioxidants: A Personal View. Nutr. Rev. 1994;52:253–265. doi: 10.1111/j.1753-4887.1994.tb01453.x. [DOI] [PubMed] [Google Scholar]
- 26.Halliwell B. Iron, Oxidative Damage, and Chelating Agents. In: Bergeron RJ, Brittenham GM, editors. The Development of Iron Chelators for Clinical Use. Boca Raton FL: CRC; 1994. pp. 33–56. [Google Scholar]
- 27.Koppenol W. Kinetics and Mechanism of the Fenton Reaction: Implications for Iron Toxicity. In: Badman DG, Bergeron RJ, Brittenham GM, editors. In Iron Chelators: New Development Strategies. Ponte Vedra Beach FL: Saratoga; 2000. pp. 3–10. [Google Scholar]
- 28.Babbs CF. Oxygen Radicals in Ulcerative Colitis. Free Radical Biol. Med. 1992;13:169–181. doi: 10.1016/0891-5849(92)90079-v. [DOI] [PubMed] [Google Scholar]
- 29.Hazen SL, d’Avignon A, Anderson MM, Hsu FF, Heinecke JW. Human Neutrophils Employ the Myeloperoxidase-Hydrogen Peroxide-Chloride System to Oxidize α-Amino Acids to a Family of Reactive Aldehydes. Mechanistic Studies Identifying Labile Intermediates Along the Reaction Pathway. J. Biol. Chem. 1998;273:4997–5005. doi: 10.1074/jbc.273.9.4997. [DOI] [PubMed] [Google Scholar]
- 30.Balla J, Vercellotti GM, Jeney V, Yachie A, Varga Z, Jacob HS, Eaton JW, Balla G. Heme,Heme Oxygenase, and Ferritin: How the Vascular Endothelium Survives (and Dies) in an Iron-Rich Environment. Antioxid. Redox. Signal. 2007;9:2119–2137. doi: 10.1089/ars.2007.1787. [DOI] [PubMed] [Google Scholar]
- 31.Bergeron RJ, McManis JS, Weimar WR, Wiegand J, Eiler-McManis E. Iron Chelators and Therapeutic Uses. In: Abraham DA, editor. In Burger's Medicinal Chemistry. 6th ed. Vol. III. New York: Wiley; 2003. pp. 479–561. [Google Scholar]
- 32.Brittenham GM. Iron Chelators and Iron Toxicity. Alcohol. 2003;30:151–158. doi: 10.1016/s0741-8329(03)00101-0. [DOI] [PubMed] [Google Scholar]
- 33.Hoffbrand AV, Al-Refaie F, Davis B, Siritanakatkul N, Jackson BFA, Cochrane J, Prescott E, Wonke B. Long-Term Trial of Deferiprone in 51 Transfusion-Dependent Iron Overloaded Patients. Blood. 1998;91:295–300. [PubMed] [Google Scholar]
- 34.Olivieri NF. Long-Term Therapy with Deferiprone. Acta Haematol. 1996;95:37–48. doi: 10.1159/000203854. [DOI] [PubMed] [Google Scholar]
- 35.Olivieri NF, Brittenham GM, McLaren CE, Templeton DM, Cameron RG, McClelland RA, Burt AD, Fleming KA. Long-Term Safety and Effectiveness of Iron-Chelation Therapy with Deferiprone for Thalassemia Major. N. Engl. J. Med. 1998;339:417–423. doi: 10.1056/NEJM199808133390701. [DOI] [PubMed] [Google Scholar]
- 36.Richardson DR. The Controversial Role of Deferiprone in the Treatment of Thalassemia. J. Lab. Clin. Med. 2001;137:324–329. doi: 10.1067/mlc.2001.114105. [DOI] [PubMed] [Google Scholar]
- 37.Nisbet-Brown E, Olivieri NF, Giardina PJ, Grady RW, Neufeld EJ, Sechaud R, Krebs-Brown AJ, Anderson JR, Alberti D, Sizer KC, Nathan DG. Effectiveness and Safety of ICL670 in Iron-Loaded Patients with Thalassaemia: A Randomised,Double-Blind, Placebo-Controlled,Dose-Escalation Trial. Lancet. 2003;361:1597–1602. doi: 10.1016/S0140-6736(03)13309-0. [DOI] [PubMed] [Google Scholar]
- 38.Galanello R, Piga A, Alberti D, Rouan MC, Bigler H, Sechaud R. Safety Tolerability and Pharmacokinetics of ICL670, a New Orally Active Iron-Chelating Agent in Patients with Transfusion-Dependent Iron Overload Due to β-Thalassemia. J. Clin. Pharmacol. 2003;43:565–572. [PubMed] [Google Scholar]
- 39.Cappellini MD. Iron-Chelating Therapy with the New Oral Agent ICL670 (Exjade) Best Pract. Res. Clin. Haematol. 2005;18:289–298. doi: 10.1016/j.beha.2004.09.002. [DOI] [PubMed] [Google Scholar]
- 40.Exjade prescribing information. December http://www.pharma.us.novartis.com/product/pi/pdf/exjade.pdf. [Google Scholar]
- 41.Bickel H, Hall GE, Keller-Schierlein W, Prelog V, Vischer E, Wettstein A. Metabolic Products of Actinomycetes.XXVII. Constitutional Formula of Ferrioxamine B. Helv. Chim. Acta. 1960;43:2129–2138. [Google Scholar]
- 42.Pippard MJ. Desferrioxamine-Induced Iron Excretion in Humans. Bailliere's Clin. Haematol. 1989;2:323–343. doi: 10.1016/s0950-3536(89)80020-4. [DOI] [PubMed] [Google Scholar]
- 43.Giardina PJ, Grady RW. Chelation Therapy in β-Thalassemia: An Optimistic Update. Semin. Hematol. 2001;38:360–366. doi: 10.1016/s0037-1963(01)90030-7. [DOI] [PubMed] [Google Scholar]
- 44.Galanello R, Forni G, Jones A, Kelly A, Willemsen A, He X, Johnston A, Fuller D, Donovan J, Piga A. A Dose Escalation Study of the Pharmacokinetics, Safety & Efficacy of Deferitrin, an Oral Iron Chelator in Beta Thalassaemia Patients. ASH Annu. Meet. Abstr. 2007:110. Abstract 2669. [Google Scholar]
- 45.Bergeron RJ, Wiegand J, McManis JS, Vinson JRT, Yao H, Bharti N, Rocca JR. (S)-4,5-Dihydro-2-(2-Hydroxy-4-Hydroxyphenyl)-4-Methyl-4-Thiazolecarboxylic Acid Polyethers: A Solution to Nephrotoxicity. J. Med. Chem. 2006;49:2772–2783. doi: 10.1021/jm0508944. [DOI] [PMC free article] [PubMed] [Google Scholar]
- 46.Bergeron RJ, Wiegand J, Bharti N, Singh S, Rocca JR. Impact of the 3,6,9-Trioxadecyloxy Group on Desazadesferrithiocin Analogue Iron Clearance and Organ Distribution. J. Med. Chem. 2007;50:3302–3313. doi: 10.1021/jm070214s. [DOI] [PMC free article] [PubMed] [Google Scholar]
- 47.Bergeron RJ, Wiegand J, McManis JS, Bharti N. The Design, Synthesis, and Evaluation of Organ-Specific Iron Chelators. J. Med. Chem. 2006;49:7032–7043. doi: 10.1021/jm0608816. [DOI] [PMC free article] [PubMed] [Google Scholar]
- 48.Bergeron RJ, Bharti N, Wiegand J, McManis JS, Yao H, Prokai L. Polyamine-Vectored Iron Chelators: The Role of Charge. J. Med. Chem. 2005;48:4120–4137. doi: 10.1021/jm048974f. [DOI] [PubMed] [Google Scholar]
- 49.Bergeron RJ, Wiegand J, McManis JS, Weimar WR, Park JH, Eiler-McManis E, Bergeron J, Brittenham GM. Partition-Variant Desferrithiocin Analogues: Organ Targeting and Increased Iron Clearance. J. Med. Chem. 2005;48:821–831. doi: 10.1021/jm049306x. [DOI] [PubMed] [Google Scholar]
- 50.Kocian O, Chiu KW, Demeure R, Gallez B, Jones CJ, Thornback JR. Synthesis and Characterization of New Polyethyleneoxy Substituted Salicylaldimine Schiff Bases and Some Corresponding Reduced Tetra- and Penta-Aza Ligands and Their Gadolinium(III) Complexes: New Potential Contrast Agents in Magnetic Resonance Imaging. J. Chem. Soc., Perkin Trans. 1994;1:527–534. [Google Scholar]
- 51.Bergeron RJ, Wiegand J, McManis JS, Bussenius J, Smith RE, Weimar WR. Methoxylation of Desazadesferrithiocin Analogues: Enhanced Iron Clearing Efficiency. J. Med. Chem. 2003;46:1470–1477. doi: 10.1021/jm020412d. [DOI] [PubMed] [Google Scholar]
- 52.Bergeron RJ, Wiegand J, McManis JS, McCosar BH, Weimar WR, Brittenham GM, Smith RE. Effects of C-4 Stereochemistry and C-4′ Hydroxylation on the Iron Clearing Efficiency and Toxicity of Desferrithiocin Analogues. J. Med. Chem. 1999;42:2432–2440. doi: 10.1021/jm990058s. [DOI] [PubMed] [Google Scholar]
- 53.Bergeron RJ, Wiegand J, McManis JS, Weimar WR, Huang G. Structure-Activity Relationships among Desazadesferrithiocin Analogues. Adv. Exp. Med. Biol. 2002;509:167–184. doi: 10.1007/978-1-4615-0593-8_9. [DOI] [PubMed] [Google Scholar]
- 54.Porter JB, Morgan J, Hoyes KP, Burke LC, Huehns ER, Hider RC. Relative Oral Efficacy and Acute Toxicity of Hydroxypyridin-4-one Iron Chelators in Mice. Blood. 1990;76:2389–2396. [PubMed] [Google Scholar]
- 55.Porter JB, Hoyes KP, Abeysinghe RD, Brooks PN, Huehns ER, Hider RC. Comparison of the Subacute Toxicity and Efficacy of 3-Hydroxypyridin-4-one Iron Chelators in Overloaded and Nonoverloaded Mice. Blood. 1991;78:2727–2734. [PubMed] [Google Scholar]
- 56.Brittenham GM. Pyridoxal Isonicotinoyl Hydrazone (PIH): Effective Iron Chelation after Oral Administration. Ann. N.Y. Acad. Sci. 1990;612:315–326. doi: 10.1111/j.1749-6632.1990.tb24319.x. [DOI] [PubMed] [Google Scholar]
- 57.Bergeron RJ, Streiff RR, Creary EA, Daniels RD, Jr, King W, Luchetta G, Wiegand J, Moerker T, Peter HH. A Comparative Study of the Iron-Clearing Properties of Desferrithiocin Analogues with Desferrioxamine B in a Cebus Monkey Model. Blood. 1993;81:2166–2173. [PubMed] [Google Scholar]
- 58.Bergeron RJ, Streiff RR, Wiegand J, Vinson JRT, Luchetta G, Evans KM, Peter H, Jenny H-B. A Comparative Evaluation of Iron Clearance Models. Ann. N.Y. Acad. Sci. 1990;612:378–393. doi: 10.1111/j.1749-6632.1990.tb24325.x. [DOI] [PubMed] [Google Scholar]
- 59.Bergeron RJ, Streiff RR, Wiegand J, Luchetta G, Creary EA, Peter HHA. Comparison of the Iron-Clearing Properties of l2-Dimethyl-3-Hydroxypyrid-4-onel 2-Diethyl-3-Hydroxypyrid-4-one and Deferoxamine. Blood. 1992;79:1882–1890. [PubMed] [Google Scholar]
- 60.Wood JK, Milner PF, Pathak UN. The Metabolism of Iron-Dextran Given as a Total-Dose Infusion to Iron Deficient Jamaican Subjects. Br. J. Haematol. 1968;14:119–129. doi: 10.1111/j.1365-2141.1968.tb01481.x. [DOI] [PubMed] [Google Scholar]
- 61.Bergeron RJ, Wiegand J, Brittenham GM. HBED: A Potential Alternative to Deferoxamine for Iron-Chelating Therapy. Blood. 1998;91:1446–1452. [PubMed] [Google Scholar]
- 62.Bergeron RJ, Wiegand J, Wollenweber M, McManis JS, Algee SE, Ratliff-Thompson K. Synthesis and Biological Evaluation of Naphthyldesferrithiocin Iron Chelators. J. Med. Chem. 1996;39:1575–1581. doi: 10.1021/jm9508752. [DOI] [PubMed] [Google Scholar]
- 63.Bergeron RJ, Wiegand J, Weimar WR, McManis JS, Smith RE, Abboud KA. Iron Chelation Promoted by Desazadesferrithiocin Analogues: An Enantioselective Barrier. Chirality. 2003;15:593–599. doi: 10.1002/chir.10248. [DOI] [PubMed] [Google Scholar]
- 64.Bergeron RJ, Wiegand J, Ratliff-Thompson K, Weimar WR. The Origin of the Differences in (R)- and (S)-Desmethyldesferrithiocin: Iron-Clearing Properties. Ann. N.Y. Acad. Sci. 1998;850:202–216. doi: 10.1111/j.1749-6632.1998.tb10476.x. [DOI] [PubMed] [Google Scholar]
- 65.Gomori G. Preparation of Buffers for Use in Enzyme Studies. Methods Enzymol. 1955;1:138–146. [Google Scholar]


