Abstract
The peroxisome proliferator-activated receptor-α (PPARα) regulates lipid homeostasis, particularly in the liver. This study was aimed at elucidating the relationship between hepatosteatosis and oxidative stress during fasting. Fasted Ppara-null mice exhibited marked hepatosteatosis, which was associated with elevated levels of lipid peroxidation, nitric oxide synthase activity, and hydrogen peroxide accumulation. Total glutathione (GSH), mitochondrial GSH, and the activities of major anti-oxidant enzymes were also lower in the fasted Ppara-null mice. Consequently, the number and extent of nitrated proteins were markedly increased in the fasted Ppara-null mice, although high levels of protein nitration were still detected in the fed Ppara-null mice while many oxidatively-modified proteins were only found in the fasted Ppara-null mice. However, the role of inflammation in increased oxidative stress in the fasted Ppara-null mice was minimal based on the similar levels of tumor necrosis factor-α change in all groups. These results with increased oxidative stress observed in the fasted Ppara-null mice compared with other groups demonstrate a role for PPARα in fasting-mediated oxidative stress and that inhibition of PPARα functions may increase the susceptibility to oxidative damage in the presence of another toxic agent.
Keywords: PPAR-α, null mice, fasting, steatosis, liver, oxidative stress, lipid peroxidation, protein nitration, protein oxidation, superoxide dismutase, aldehyde dehydrogenase
Introduction
The peroxisome proliferator-activated receptor (PPAR) family consists of three isotypes, PPARα [1], PPARβ/δ [2], and PPARγ [3]. PPARs are members of the nuclear hormone receptor superfamily that upon ligand binding, form a heterodimer with retinoid X receptor, another member of the nuclear receptor superfamily, and bind to PPAR response elements (PPRE) present in the 5′-flanking region of their target genes, resulting in the activation or repression of gene transcription [4].
PPARα is highly expressed in metabolically active tissues such as heart, kidney, intestinal mucosa, skeletal muscle, brown fat, and liver where it plays a central role in the control of lipid metabolism, gluconeogenesis, and amino acid metabolism [5]. PPARα has been well-established as a key modulator of lipid transport [6] and metabolism, notably mitochondrial and peroxisomal fatty acid beta-oxidation [7,8]. Thus, PPARα is positioned to coordinate lipid metabolism and glucose homeostasis during the feeding and fasting cycles. Studies using Ppara-null mice showed unequivocally the critical role of PPARα in maintaining lipid homeostasis during fasting for 24 and up to 72 h, conditions that require hepatic fatty acid oxidation to provide energy [9–12]. Collectively, these reports revealed that fasted Ppara-null mice exhibited hepatic steatosis, myocardial lipid accumulation, hypoglycemia, hypothermia, hypoketonemia, and alteration of phospholipids and triacylglycerol homeostasis, mainly due to the lack of hepatic fatty acid oxidation [8].
Cytochrome P450-2E1 (CYP2E1), known to produce reactive oxygen species (ROS), is up-regulated in rat liver during fasting [13,14]. In addition, it was reported that livers isolated from rats fasted for 36 h exhibited increased free radicals and decreased anti-oxidant levels, however, there was no effect on lipid peroxidation [15]. Another study showed that fasting for 36 h increases oxidative stress due to free radical generation from mitochondria, another main site of ROS generation in the cell, by increasing the sensitivity of membranes to oxidative damage from lipid and protein oxidation [16]. In contrast, studies with mouse liver isolated following 24 or 48 h fasting, revealed up-regulation of a battery of anti-oxidant factors for protection from oxidative stress [17]. This study further implicated an important role for PPARα in protecting hepatocytes from potential oxidative damage developed during fasting. Liver steatosis resulting from nonalcoholic fatty liver diseases (NAFLD), might sensitize the liver to oxidative stress, even with the basal levels of ROS produced by hepatocytes, since it provides an environment that is rich in oxidizable unsaturated fatty acids [18]. Lipid peroxidation is known to increase dramatically in response to different treatments causing acute or chronic steatosis in mice [19] or steatosis due to a choline/methionine-deficient diet [20], producing several aldehydes such as malondialdehyde (MDA) and 4-hydroxynonenal (HNE) [18] that can attack cellular macromolecules such as proteins, DNA, and phospholipids [21]. Additionally, nitrotyrosine (3-NT), produced as consequence of oxidative/nitrosative stress and known to cause dysfunction and degradation of many functional proteins in the body, was suggested to play a critical role in the development of NASH after exposure to a choline-deficient diet [22]. Both lipid peroxidation and 3-NT formation can deplete cellular anti-oxidants, induce mitochondrial dysfunction, and further aggravate organ damage [18].
Since Ppara-null mice exhibit liver steatosis during fasting, it is thus logical to hypothesize that steatotic livers from Ppara-null mice fasted for 36 h would be more susceptible than non-steatotic livers of their wild-type counterparts to oxidative stress related effects. The main aim of this study was to elucidate the relationship between lipid accumulation and the development of oxidative stress during fasting. We further studied whether tumor necrosis factor-alpha (TNF-α) plays a role in steatosis-induced oxidative stress in the fasted Ppara-null mice since PPARα has been reported to protect against steatosis-induced inflammation through inhibition of inflammatory genes, including TNF-α [23].
Experimental Procedures (Materials and Methods)
Materials
Biotin-conjugated-N-maleimide (biotin-NM), N-ethylmaleimide (NEM), 3-[(3-cholamidopropyl)-1-dimethylammonio]-propanesulfonic acid (CHAPS), dithiothreitol (DTT), p-nitrophenol (PNP), propionyl aldehyde, and all other chemicals used in this study were obtained from Sigma Chemical (St. Louis, MO), unless indicated otherwise. Protease inhibitor and phosphatase inhibitor cocktails were obtained from Calbiochem (San Diego, CA). Horseradish peroxidase-conjugated goat anti-rabbit and goat anti-mouse antibodies were purchased from Bio-Rad (Hercules, CA). Specific antibodies to 3-NT and SOD2 were purchased from Abcam Inc. (Cambridge, MA). Horseradish peroxidase-conjugated monoclonal antibody (mAb)-biotin was obtained from Oncogene Science (Cambridge, MA). Protein A/G agarose beads were purchased from Santa Cruz Biotechnology (Santa Cruz, CA). Enhanced chemiluminescence reagents were obtained from Thermo Scientific (Rockford, IL).
Animals
Age- and gender-matched inbred Ppara-null mice on 129/Svj background and wild-type mice [stock number 2448 from the Jackson Laboratory (Bar Harbor, Maine)] [24] were used in this study. All mice were housed in a temperature-controlled room (23–25°C) on a 12 h light (06:30–18:30) – 12 h dark cycle (18:30–06:30) and were fed standard rodent chow.
Animal treatment and histopathology analysis
All experiments were performed with 6 to 7-week-old female mice (15–20 g). Mice were randomly assigned into 4 different groups of 3 animals: (1) wild-type-fed; (2) wild-type-fast; (3) Ppara-null-fed; and (4) Ppara-null-fast. Wild-type and Ppara-null were either fed standard rodent chow or deprived of food for 36 h with free access to water. Fasted mouse groups were deprived of food at the beginning of the light cycle (06:30) and were weighed before euthanization at the beginning of the dark cycle on the following day (18:30). The whole liver was excised immediately and weighed. Small liver section from the largest lobe of each mouse was fixed in 10% formalin in PBS and subjected to hematoxylin and eosin (H&E) staining by American HistoLabs, Inc. (Gaithersburg, MD). Histological examination was performed under a light microscope (200 x). The rest of the liver samples were frozen immediately at −80°C until used. All animal experiments were conducted in accordance with the National Institutes of Health guidelines and approved by the Institutional Animal Care and Use Committee.
Sample preparation
Liver tissues (approximately 500 mg) from each mouse of the 4 different groups were homogenized on ice in 5 volumes of extraction buffer (50 mM Tris-Cl, pH 7.5, 1 mM EDTA, 1% CHAPS with protease inhibitor and phosphatase inhibitor cocktails). The buffer used in this study was freshly pre-equilibrated with nitrogen gas for 1 h to remove dissolved oxygen, as described [25]. The homogenates were then subjected to centrifugation at 13,000 × g for 30 min at 4°C to remove cell debris and insoluble proteins. The resultant supernatant was used to perform different experiments. Mitochondrial fractions were prepared from mouse livers in different groups by using differential centrifugation followed by 2 separate washing steps, as described [31,33]. The concentration of the proteins was determined using the BioRad protein assay kit, as described previously [26].
Determination of the transaminase activities
The activities of alanine aminotransferase (ALT) and aspartate aminotransferase (AST) were measured in plasma sample from each animal using a clinical IDEXX Vet Test chemistry analyzer system from IDEXX Laboratories (West brook, ME).
Determination of MDA concentrations, GSH concentration, nitric oxide synthase (NOS) activity, hydrogen peroxide (H2O2) concentrations, and CYP2E1 activity
The amounts of MDA and GSH were measured using the commercially available kits from Oxford Biomedical research Inc. (Oxford, MI) following the manufacturer’s protocol for each measurement. MDA and total GSH concentrations (μM) in each sample were measured using 20 and 200 μg whole liver lysates, respectively. Mitochondrial GSH content was determined with 200 μg mitochondrial proteins in each animal. NOS activity was evaluated using the commercially available kit from Oxford Biomedical research Inc. (Oxford, MI) following the manufacturer’s protocol by using 50 μg whole liver lysates per sample. One unit of NOS activity was defined as the amount of NO (nM) produced per 1 mg protein/min. H2O2 produced from total liver lysates was determined during 30 min incubation by using the Amplex®Red hydrogen peroxide assay kit obtained from Molecular Probes (Eugene, OR) by following the manufacturer’s instructions [27,28]. CYP2E1 activity was measured by the rate of PNP oxidation to p-nitrocatechol with 2 mg whole liver lysates/sample [29].
Anti-oxidant enzyme activities assays
The enzyme activities of SOD, CAT, and GPx were measured using the commercial kits from Calbiochem (San Diego, CA) following the manufacturer’s protocol. Total SOD activity was determined using 20 μg of whole liver lysates where one unit of enzyme activity corresponds to the amount of enzyme needed to exhibit 50% dismutation of the superoxide radical. CAT activity was measured with 250 μg of whole liver lysates and one unit of enzyme activity stands for the amount of formaldehyde (μM) production per min. GPx activity was determined by using 100 μg of whole liver lysates and one unit of enzyme activity represents the amount of enzyme that causes the oxidation of 1.0 nmol of NADPH to NADP+ per min × mL at 25°C.
Immunoblot (IB) analysis
Total liver lysates (10–40 μg) were separated by 10 or 12 % SDS-polyacrylamide gel electrophoresis (SDS-PAGE) and electrophoretically transferred to nitrocellulose membranes. Upon completion of electric transfer of the proteins, membranes were blocked for 1 h in 5% milk powder in Tris-HCl buffered saline containing 0.01% Tween 20 (TBS-T). Membranes were then probed with specific primary antibodies (1:1,000 dilution) for 3-NT and SOD2 detection or horseradish peroxidase-conjugated monoclonal antibody (mAb)-biotin (1:2,000 dilution) in 5% milk powder in TBS-T, overnight at 4°C. After washing steps to remove the primary antibodies, the membranes were either incubated with goat anti-mouse (anti-3-NT) or goat anti-rabbit (anti-SOD2) horseradish peroxidase-conjugated secondary antibody (1:5,000 dilution in 5% milk powder in TBS-T). Protein bands were detected by enhanced chemiluminescence on Kodak X-OMAT film and their densities quantified using UNSCAN-IT gel version 6.1 from Silk Scientific Corporation (Orem, UTAH) [28].
Immunoprecipitation (IP) and IB analyses
A separate aliquot of total liver lysates pooled from three mouse livers per group (1 mg) was incubated with 2 μg of anti-SOD2 antibody overnight at 4°C with constant head-to-tail rotation followed by addition of protein A/G-agarose for an additional 1 h. Proteins bound to the protein A/G-agarose were washed three times with PBS containing 1% CHAPS to remove nonspecifically bound proteins. After centrifugation, bound proteins were dissolved in Laemmli buffer and separated on 12% SDS-PAGE gels for IB analysis using the specific antibodies against 3-NT or SOD2, as mentioned above [30].
Protein oxidation determination
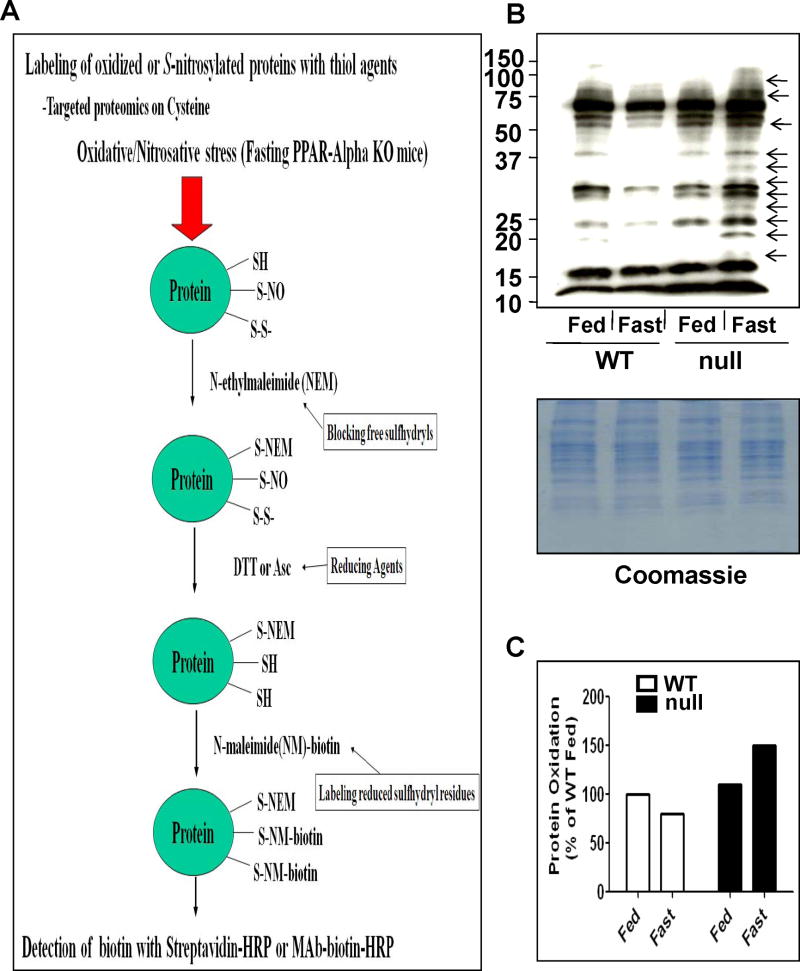
Whole liver lysates were pooled from three mouse livers per group (10 mg/group) and labeled with NEM, as described in details [31,32], and as illustrated in Figure 9A. The NEM-labeled proteins were then treated with 15 mM DTT for 30 min to reduce the oxidatively-modified Cys residues before they were incubated with biotin-N-maleimide. Equal amounts of biotin-labeled protein (10 μg/well) were separated on 12% SDS–PAGE, transferred to nitro-cellulose membranes, and subjected to immunoblot analysis with the specific antibody against biotin, as previously described in details.
Fig. 9.
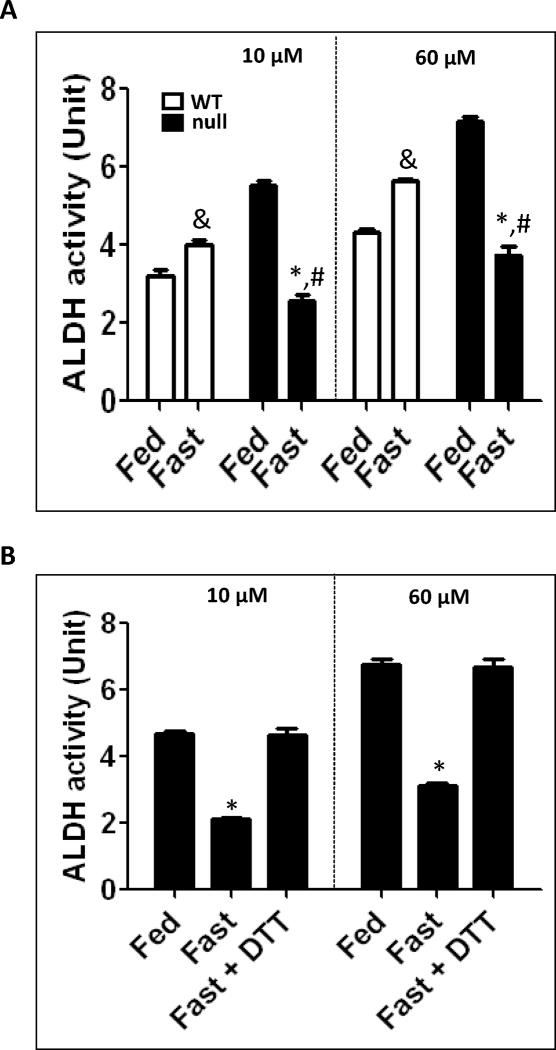
Inactivation of ALDH in fasted Ppara-null mice for 36 h. (A) Catalytic activities of mitochondrial ALDH2 (by using 10 μM propionaldehyde) and cytosolic ALDH1 (by using 60 μM propionaldehyde) in the indicated liver samples were determined. (B) Reversal of the suppressed mitochondrial ALDH2 and cytosolic ALDH1 from the fed- or fasted- Ppara-null mouse livers was determined in the absence and presence of 15 mM DTT. &Significantly different from fed wild-type; *significantly different from corresponding wild-type group (A) or from other groups (B); #significantly different from fed Ppara-null mice.
Aldehyde dehydrogenase (ALDH) activity measurements
Activities of mitochondrial low Km ALDH2 and cytosolic ALDH1 were measured, without or with pre-incubation of whole liver lysates with 15 mM DTT for 1 h, by monitoring the increased production of NADH at 340 nm in the presence of 10 μM and 60 μM propionyl aldehyde, respectively, used as the substrate [31–33].
TNF-α determination
Individual whole liver cell lysates (200 μg/sample) were used to measure TNF-α protein content using an ELISA kit from Assay Design (Ann Arbor, Michigan), by following the manufacturer’s protocol. TNF-α protein can be detected at levels as low as 3.5 pg/ml level.
Data processing and statistical analysis
All data were obtained from two separate experiments with at least three different measurements, unless otherwise stated. Statistical analyses were performed using the two tailed Student’s t-test at the 95% confidence level (Prism5 software) and p<0.05 was considered statistically significant. Other methods not specifically described were the same as previously reported [28,30–33].
Results
Induction of fatty liver in fasted Ppara-null mice
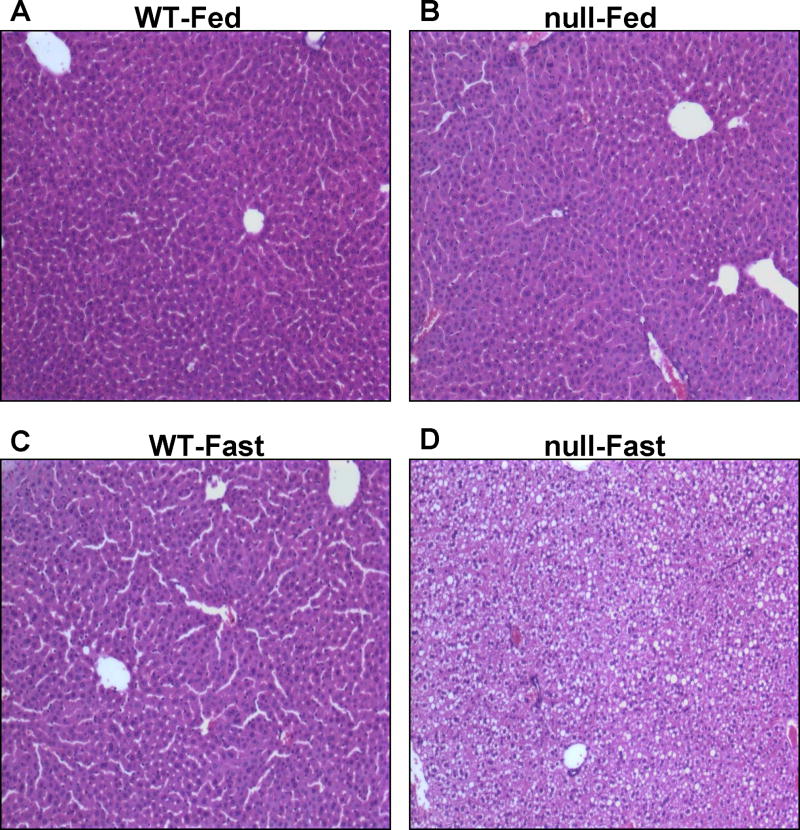
Livers of age- and gender-matched wild-type and Ppara-null mice under non-fasting conditions were grossly (not shown) and histologically normal (Fig. 1A and B). In contrast, livers isolated from the fasted Ppara-null mice for 36-h exhibited much paler liver color compared with that of the wild-type mice which exhibited the normal reddish-burgundy color (not shown). Histological analysis of fasted Ppara-null groups revealed the accumulation of micro- and macro-vesicular intracellular lipid droplets that were not observed in the fasted wild-type mice (Fig. 1C and D). In addition, hepatocyte ballooning, displacement of nuclei, and collapsed sinusoidal spaces, were noted only in the fasted Ppara-null mice (Fig. 1D). These results suggest that mice lacking PPARα subjected to fasting for 36 h are much more susceptible to a significant alteration of hepatic lipid metabolism, as previously reported [9–12].
Fig. 1.
Effect of fasting on intracellular lipids accumulation in wild-type and Ppara-null mice. Wild-type and Ppara-null mice were either fed or deprived of food for 36 h with free access to water. Removal of standard rodent chow was started at the beginning of the light cycle and mice were euthanized at the beginning of the dark cycle on the next day. Photomicrographs (200×) after H&E staining from the left hepatic lobes of indicated mouse livers are presented: (A) Wild-type fed standard chow, (B) Ppara-null fed standard chow, (C) Fasted wild-type, and (D) Fasted Ppara-null mice. Fasted wild-type mice (C) were normal as compared to Ppara-null-fasted mice (D) which showed pleomorphic foamy hepatocytes due to accumulation of micro- and macro-vesicular lipid droplets. Photomicrographs are representative of different treatment groups (n = 3 per group), and all mice exhibited a very similar pattern of response.
Limited effect of 36 h fasting on plasma transaminase activities
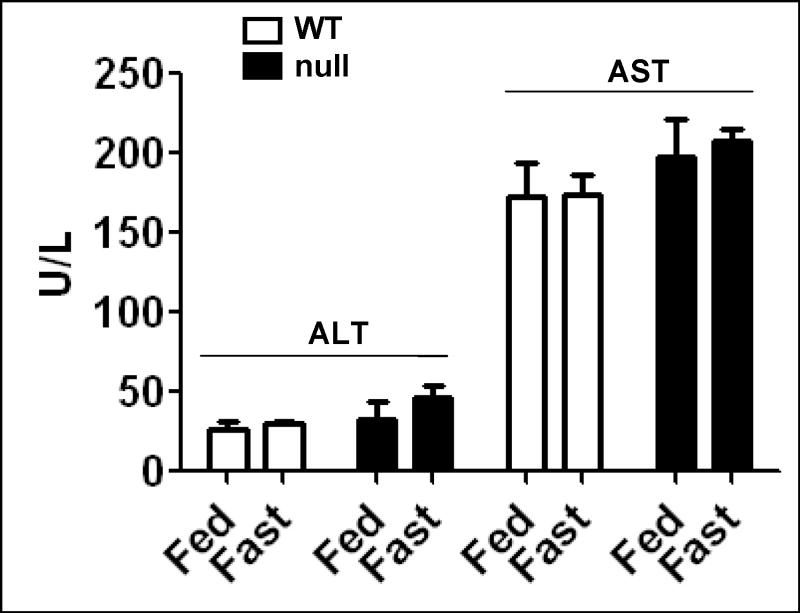
The plasma activities of ALT and AST were evaluated in response to fasting in wild-type and Ppara-null mice (Fig. 2). We only detected minimal changes between the groups. Although ALT and AST tend to be higher in the fasted Ppara-null mice, all values were within the normal ranges for plasma transaminases.
Fig. 2.
Effect of 36 h fasting on plasma transaminase activities. The activities of ALT and AST were measured in plasma samples from each animal in different groups by using a clinical chemistry analyzer system and presented. Data are expressed as mean ± S.E.M. of 3 mice per group.
Weight change and increased liver/body weight ratio in fasted Ppara-null mice
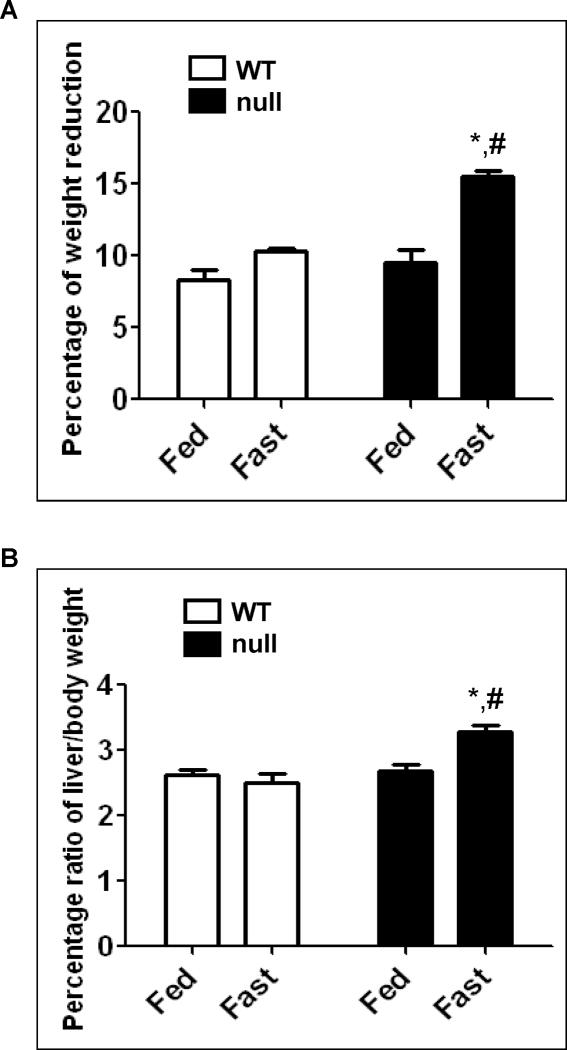
We observed similar reduction of total body weight (~8–9%) in the fed- and fasted wild-type, and the fed Ppara-null mice (Fig. 3A). However, the fasted Ppara-null group exhibited a maximum reduction of weight (~15%), which was significantly different from the fasted wild-type or the fed Ppara-null groups (Fig. 3A). In contrast to the body weight loss, the ratios of liver/total body weight were significantly (~33% and 22%) higher compared with that of the fasted wild-type and the fed Ppara-null groups, respectively (Fig. 3B). Taken together, the increased liver/body weight ratio observed in the livers of the fasted Ppara-null mice could be, at least in part, due to hepatic steatosis. These results are in agreement with previous studies [9–12].
Fig. 3.
Changes in body and liver weights of wild-type and Ppara-null mice following 36 h fasting. (A) Body weight of each mouse was measured before and after 36 h feeding or fasting with free access to water. The changes of weight are presented as percentage of weight reduction. (B) When mice were euthanized, the whole liver was excised and immediately weighed. Liver weights are presented as percentage of the body weight. Data are expressed as mean ± S.E.M. of 3 mice per group. *Significantly different from corresponding wild type group; #significantly different from fed Ppara-null mice.
Increased oxidative stress in the fasted Ppara-null mice
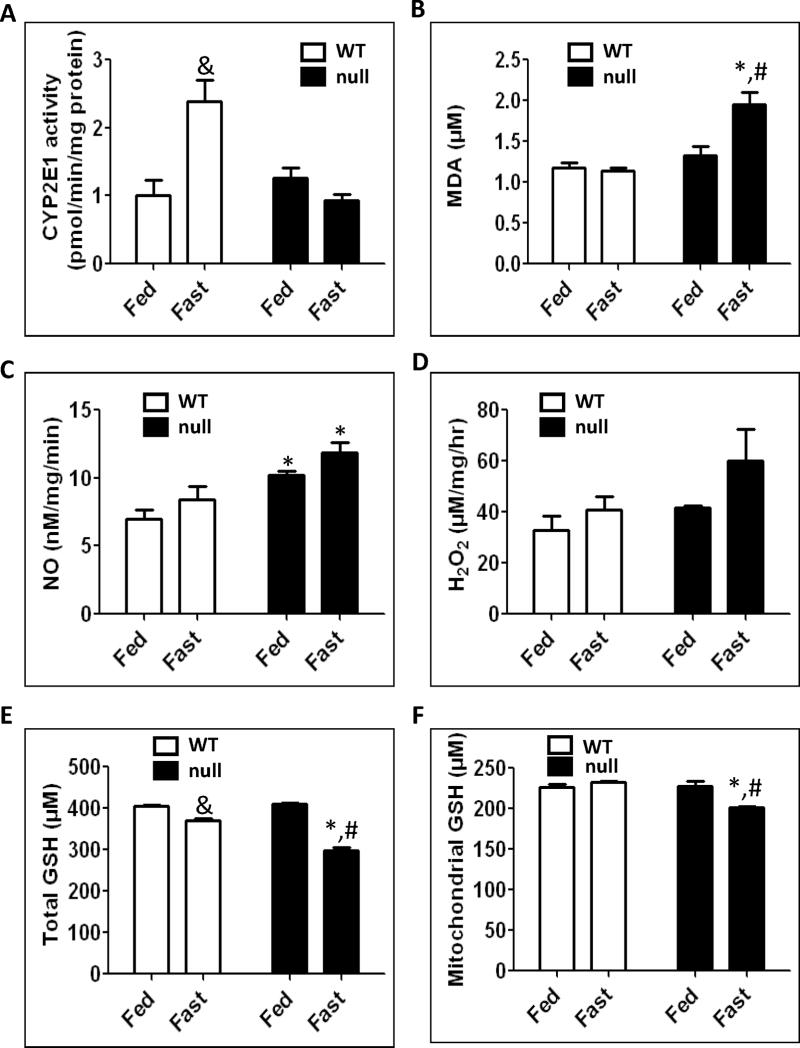
It is well-established that fasting induces CYP2E1, an enzyme involved in biotransformation of several low molecular weight xenobiotics (e.g., halogenated hydrocarbons, primary alcohols, nitrosamines, etc), therapeutic agents (e.g., acetaminophen), and endogenous compounds (e.g., fatty acids and ketone bodies) [34,35]. CYP2E1 is also known to produce reactive oxygen species and thus serves as a generator of oxidative stress [13,14,35]. Because CYP2E1 activity was reported to increase in response to a high fat diet [36,37], we determined whether the fatty liver increased the activity of CYP2E1 in different mouse strains. Interestingly, the activity of CYP2E1 increased only in the fasted wild-type mice, by 2.1- and 2.6-fold compared with their fed wild-type counterparts and the fasted Ppara-null mice, respectively (Fig. 4A). In contrast, CYP2E1 activity did not change significantly in the fasted Ppara-null mice (Fig. 4A).
Fig. 4.
Effect of 36 h fasting on CYP2E1 activity, MDA formation, NOS activity, H2O2 production, and total and mitochondrial GSH. Equal amounts of whole liver lysates or mitochondrial proteins from different groups were used to determine (A) CYP2E1 activity by measuring the rate of PNP oxidation to p-nitrocatechol, (B) hepatic malondialdehyde (MDA), (C) NOS activity, (D) H2O2 production rates, (E) total GSH and (F) mitochondrial GSH levels, as described in Materials and Methods. Data are expressed as mean ± S.E.M. of 3 mice per group. &Significantly different from fed wild-type; *significantly different from corresponding wild-type group; #significantly different from fed Ppara-null mice.
We previously reported that oxidative stress was markedly elevated in rat fatty liver [33,37]. However, it is unknown whether similar effects may occur under conditions of fasting-induced steatosis in Ppara-null mice. Therefore, we evaluated the levels of different oxidative stress parameters (Figs. 4B–F). The lipid peroxidation marker, MDA, was significantly higher in the fasted Ppara-null mice by 80% and 50% compared with the fasted wild-type mice and their fed Ppara-null counterparts, respectively (Fig. 4B). The activity of NOS was 40% and ~20% higher in the fasted Ppara-null mice compared with the fasted wild-type and the fed Ppara-null mice, respectively; however, the increase was only significant between the fasted Ppara-null mice and the fasted wild-type group (Fig. 4C). It is noteworthy to also mention that the activity of NOS was significantly higher in the fed Ppara-null mice compared with their wild-type counterparts by ~60% (Fig. 4C). The rate of H2O2 production were also assessed (Fig. 4D). Albeit not significant, we clearly observed that the H2O2 level in the fasted Ppara-null mice was markedly increased by ~50% compared with both the fasted wild-type and the fed Ppara-null mice (Fig. 4D). The levels of total GSH, an antioxidant that protects cells against oxidative radical damage, were significantly decreased in both the fasted wild-type and the fasted Ppara-null groups by 10% and ~27%, respectively, compared with their corresponding controls (Fig. 4E). The levels of GSH in the fasted Ppara-null mice were also significantly lower by 20% than the fasted wild-type mice (Fig. 4E). However, the mitochondrial GSH content, which may be more critical than the total GSH levels, was significantly inhibited by ~10% in the fasted Ppara-null mice compared with the fasted wild-type mice and their corresponding fed mice (Fig. 4F). Taken together, these data suggest that the levels of oxidative/nitrosative stress are more prominent in the fasted Ppara-null mice than the corresponding wild-type or the fed Ppara-null group.
Suppression of Anti-oxidant enzyme activities in fasted Ppara-null mice
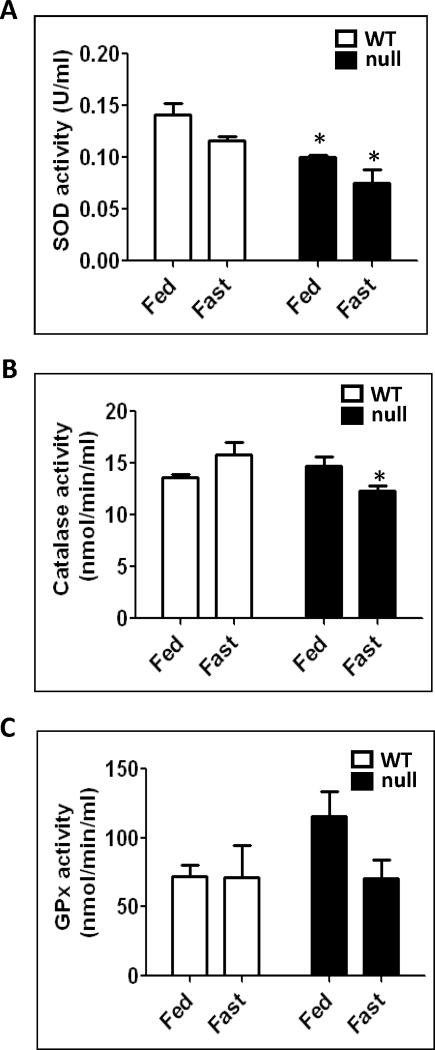
Lipid peroxidation and other parameters of oxidative stress observed in animal models of non-alcoholic steatohepatitis (NASH) have been suggested to increase oxidative radical production and decrease anti-oxidant enzyme activities with decreased GSH contents [18]. In addition, it was reported that livers isolated from rats fasted for 36 h exhibit decreased levels of anti-oxidant enzyme activities [15]. Therefore, we evaluated the activities of SOD, CAT, and GPx activities (Fig. 5). Fig. 5A shows significantly (34% and 25%) lower SOD activities in the fasted Ppara-null mice compared with the fasted wild-type and the fed Ppara-null mice, respectively. In addition, the SOD activity in the fed Ppara-null mice was significantly decreased by ~40% as compared to their wild-type counterparts (Fig. 5A). The CAT activities were also 22% and 17% lower in the fasted Ppara-null mice compared with the fasted wild-type and the fed Ppara-null mice, but the significant level was only reached when compared with the fasted wild-type group (Fig. 5B). Approximately 40% inhibition of GPx activity was observed in the fasted Ppara-null mice compared with their fed controls, albeit not significant (Fig. 5C). Together, these data clearly demonstrate that the levels of anti-oxidant enzyme activities were at their lowest levels in the fasted-Ppara-null groups.
Fig. 5.
Changes in the anti-oxidant enzyme activities following 36 h fasting in wild-type and Ppara-null mice. Equal amounts of whole liver lysates were used to measure: (A) superoxide dismutase activity, (B) catalase activity, and (C) glutathione peroxidase activity according to the manufacturer’s protocols. Data are expressed as mean ± S.E.M. of 3 mice per group. *significantly different from corresponding wild-type group.
Increased protein nitration in mice lacking PPARα
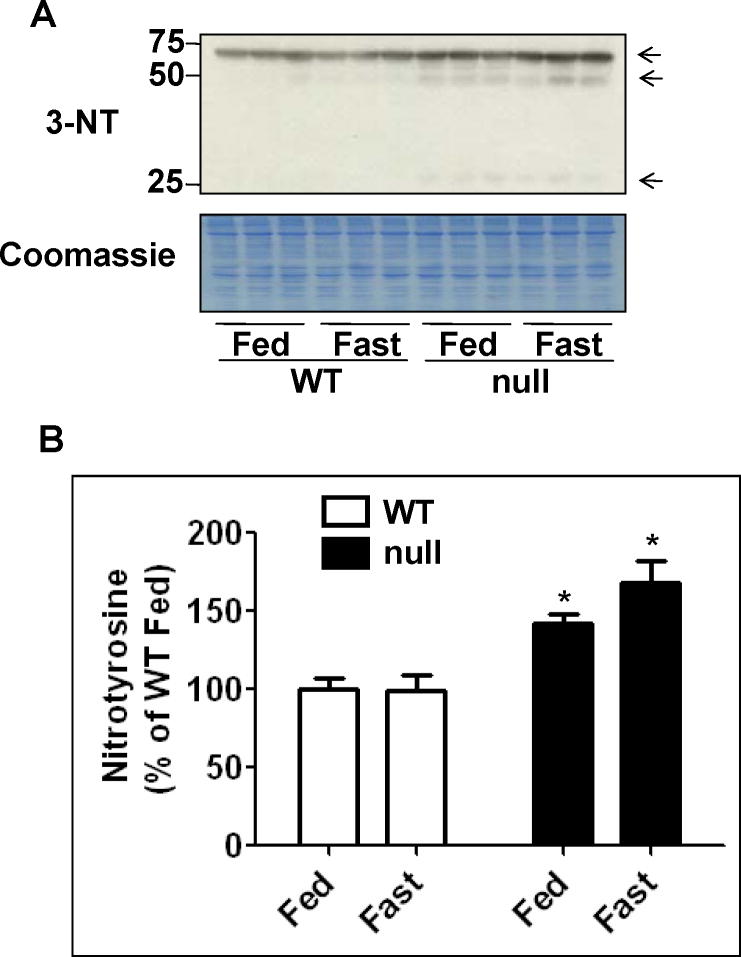
Bailey and coworkers [38,39] reported that elevated production of ROS and reactive nitrogen species (RNS) was proposed to play a causative role in the pathogenesis of non-alcoholic steatohepatitis (NASH). Thus, the level of 3-NT, a marker for nitrative stress, was evaluated by immunoblot analysis (Figs. 6A and B). The levels of 3-NT were 70% and 25% higher in the fasted Ppara-null mice compared with the fasted wild-type and the fed Ppara-null, respectively, although significance was only reached when compared with the fasted wild-type group (Figs. 6A and B). In addition, the 3-NT levels were significantly higher in the fed Ppara-null mice compared with their corresponding wild-type mice (Figs. 6A and B). These results are in agreement with NOS activity data shown in Fig. 4C.
Fig. 6.
Levels of hepatic protein nitration in wild-type and Ppara-null mice subjected to fasting for 36 h. (A) Equal amounts of whole liver lysates (40 μg/well) from different groups were separated on 12% SDS–PAGE, transferred to nitro-cellulose membrane, and subjected to immunoblot analysis (IB) by using anti-3-NT antibody (upper panel). Coomassie-stained gel is presented to show equal protein loading. (B) Density of 3-NT band in each lane was calculated by quantitative densitometry, normalized to that of the corresponding Coomassie-stained protein bands, and is presented as a percentage of the 3-NT level detected in the wild-type fed group. Data are expressed as mean ± S.E.M of 3 mice per group. *significantly different from corresponding wild-type group.
Nitration of mitochondrial SOD2 in Ppara-null mice
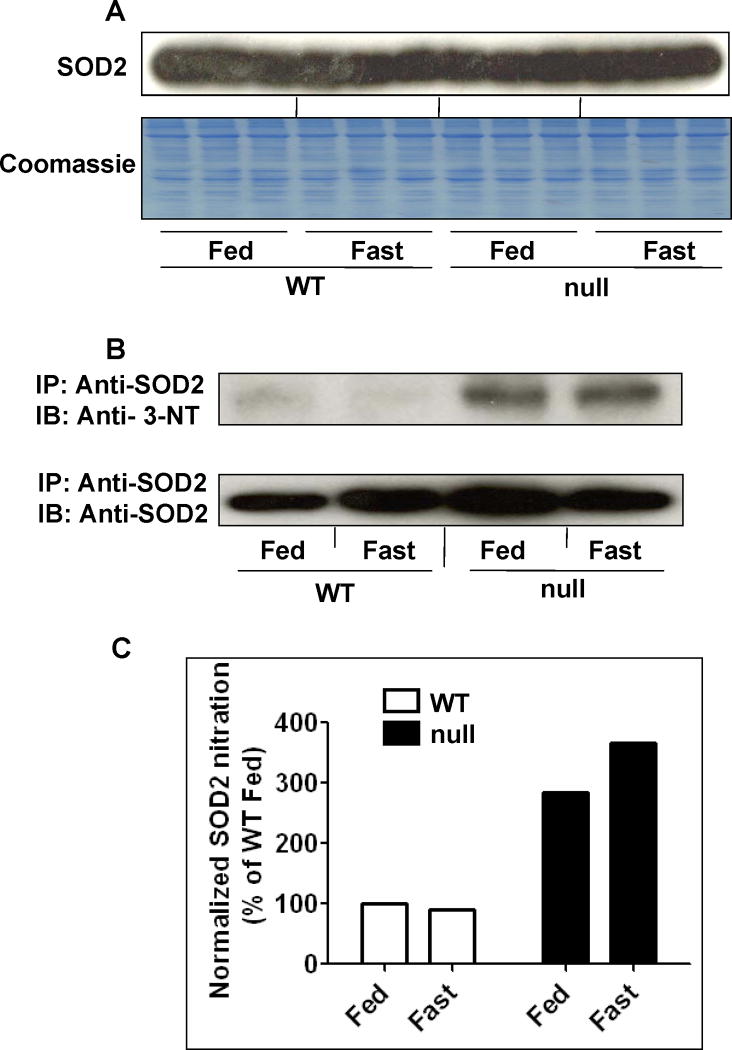
Nitration of many proteins may decrease their functions. A prominent example of decreased enzyme activity due to protein nitration is mitochondrial SOD2 [40]. Based on our data of increased NOS activity and protein nitration with suppressed SOD activity in both the fed- and fasted-Ppara-null groups, albeit higher in the fasted Ppara-null group, we further evaluated whether mitochondrial SOD2 activity was inhibited through nitration. Indeed, immunoblot analysis revealed that the amounts of SOD2 protein were not changed in any of the groups when equal or similar amounts of proteins are loaded (Fig. 7A). However, the amounts of nitrated SOD2 were clearly higher in the Ppara-null mouse groups, as evident by immunoblot analysis of immunoprecipitated SOD2 proteins (Fig. 7B). In contrast, the levels of nitrated SOD2 were very low or undetectable in both wild-type groups, regardless of feeding or fasting (Fig. 7B). Densitometric analysis data revealed that the SOD levels in the fed- and fasted-Ppara-null mice were 2.9- and 3.7-fold higher than those of their corresponding wild-type groups, respectively (Fig. 7C). The nitrated SOD2 levels were 28% higher in the fasted Ppara-null mice compared with their fed counterparts (Figs. 7B and C). Taken together, these data revealed that Ppara-null mice are more susceptible to protein nitration and that this susceptibility is further enhanced by fasting for 36 h.
Fig. 7.
Levels of mitochondrial superoxide-dismutase 2 (SOD2) and nitrated (SOD2) in wild-type and Ppara-null mice following 36 h of food deprivation. (A) Equal amounts of whole liver lysates (40 μg protein/well) from different groups were separated on 12% SDS–PAGE, transferred to nitro-cellulose membrane, and subjected to immunoblot analysis (IB) by using the specific anti-SOD2 antibody (upper panel). Coomassie blue-stained gel is presented to show equal protein loading (lower panel). (B) Whole liver lysates (1 mg/sample) were pooled from 3 mouse livers per group for the 4 different groups and were immunoprecipitated (IP) with the specific anti-SOD2 antibody, as described in the “Methods” section. Immunoprecipitated proteins from each group were then subjected to 12% SDS–PAGE, transferred to nitrocellulose membrane, and subjected to immunoblot analysis with the anti-3-NT (upper panel) or anti-SOD2 antibody (lower panel). (C) Density of 3-NT bands was normalized to that of the corresponding SOD2 band and is plotted as a percentage of the nitro-tyrosine level detected in the wild-type fed group.
Oxidatively-modified proteins identified in fasted Ppara-null mice
Our laboratory recently reported that increased levels of oxidatively-modified proteins in mitochondria contribute to mitochondrial dysfunction long before full-blown liver diseases caused by many hepatotoxic agents or pathological conditions that increase oxidative/nitrosative stress [25,28,30–32,37]. Since the fasted Ppara-null mice exhibited elevated levels of oxidative stress, we hypothesized that many hepatic proteins are oxidized and/or S-nitrosylated in the Ppara-null mice fasted for 36 h. Immunoblot analysis with specific antibody against biotin demonstrated that the levels of biotin-NM-labeled oxidized proteins (as illustrated in Fig. 8A) were markedly increased only in the fasted Ppara-null groups (Fig. 8B, upper panel) despite equal amounts of proteins analyzed for all groups (Fig. 8B, lower panel). While there was no increase in oxidized proteins in the fasted-wild-type mice compared with their controls, the levels of oxidized proteins were increased by ~45% in the fasted Ppara-null mice compared with their control and was the highest among all the groups (Figs. 8B and C).
Fig. 8.
Comparison of oxidized proteins in the four groups following 36 h fasting. (A) Schematic diagram of the method used to identify oxidatively-modified Cys residues. (B) Whole liver lysates were pooled from 3 mouse livers per group (10 mg/group) and labeled with N-EM. The N-EM-labeled proteins were then treated with 15 mM DTT for 30 min to reduce the oxidatively-modified Cys residues before they were incubated with biotin-N-maleimide. Equal amounts of biotin-labeled protein (10 μg/well) were separated on 12% SDS–PAGE, transferred to nitro-cellulose membrane, and subjected to immunoblot analysis with the anti-biotin antibody (upper panel). Coomassie blue-stained gel is presented to show equal protein loading (lower panel). (C) Densities of oxidized-protein bands were normalized to that of the corresponding Coomassie blue-stained bands and are plotted as a percentage of the oxidized-protein level in the wild-type fed group.
Reversible inhibition of ALDH activities in fasted Ppara-null mice
We previously demonstrated that ALDH activities in multiple, distinct specimens are inhibited through reversible modifications of Cys residues such as S-nitrosylation, S-glutathionylation, sulfenic acid, and disulfide [28,30–32]. Since the data in Fig. 8 showed that oxidatively-modified proteins were markedly increased in fasted Ppara-null mice, we evaluated whether the catalytic activities of ALDH enzymes were altered in the fasted Ppara-null mice and whether their activities could be restored by DTT. Different concentrations (10 or 60 μM) of the specific substrate propionaldehyde were used to evaluate the mitochondrial ALDH2 and the cytosolic ALDH1 activities, respectively (Fig. 9). While ALDH activities in the fasted wild-type mice increased significantly compared with their control (Fig. 9A), ALDH activities were significantly decreased by ~50% in the fasted Ppara-null mice compared with their control and was the lowest among all the groups (Fig. 9A). The basal ALDH activities in the fed Ppara-null mice were significantly higher by ~60 to 70% compared with their wild-type counterparts (Fig. 9A). The inhibition of ALDH enzyme activities was completely reversed when liver extracts were pre-incubated with DTT before measuring enzyme activities, suggesting that ALDH activities were inhibited through oxidative modifications of Cys residues (Fig. 9B).
Limited role of TNF-α in fasted Ppara-null mice
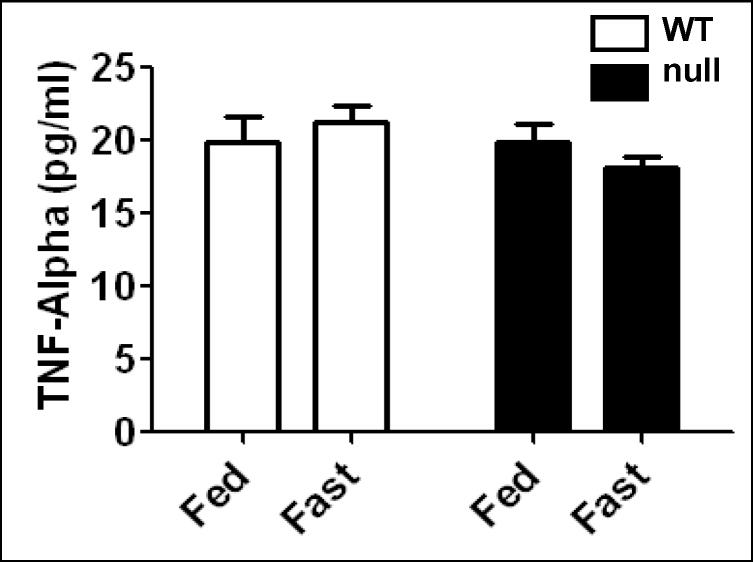
It was reported that obesity-induced inflammation, as revealed by increased TNF-α levels and other cytokines in Ppara-null mice fed with a high fat diet [23]. In addition, increased cytokine levels were correlated with increased oxidative stress levels [18]. Therefore, we evaluated whether TNF-α plays a role in steatosis-induced oxidative stress in the fasted Ppara-null mice (Fig. 10). ELISA data showed that TNF-α levels were not altered in any of the groups, suggesting that inflammation plays no or a limited role in oxidative stress observed in the fasted Ppara-null mice for 36 h.
Fig. 10.
Effect of 36 h fasting on tumor necrosis factor-alpha (TNF-α) levels in wild-type and Ppara-null mice. Equal amounts of whole liver lysates were used to measure the contents of TNF-α by ELISA according to the manufacturer’s protocol and findings are presented.
Discussion
During fasting, low insulin levels lead to lypolysis and the release of free fatty acids (FFAs) from adipose tissue. The released free fatty acids undergo β-oxidation in the hepatic peroxisomes and mitochondria to produce ketone bodies (mainly acetoacetate and β–hydroxybutyrate) [18]. Ketone bodies released from the liver are essential sources of energy during fasting in skeletal muscles, brain, and other peripheral tissues through the tricarboxylic acid cycle [18]. The fasting-induced hepatic peroxisomal and mitochondrial β-oxidation is largely mediated by PPARα, which becomes activated in response to long chain FFAs, and up-regulates the expression of several target genes involved in fatty acid uptake, transport and metabolism, and lipoprotein synthesis and assembly. Some of the PPARα target genes include mitochondrial carnitine palmitoyltransferase (CPT), medium-chain acyl CoA dehydrogenase (both of which play a role in β-oxidation), 3-hydroxy-3-methylglutaryl-CoA synthase (the rate limiting enzyme of ketogenesis), peroxisomal acyl-CoA oxidase (peroxisomal β-oxidation), and microsomal cytochrome P450 omega hydroxylases (fatty acid omega hydroxylases) [41–43]. Indeed, our data show that the fasted Ppara-null mice exhibited marked accumulation of intracellular lipid droplets, which is at least partially responsible for the increased liver/body weight ratios. These results are in agreement with data reported earlier [9–12]. In addition, the decreased body weights, especially observed in the fed groups, can be explained by the time-frame of our protocol where we started the experiment by measuring animal weights (and food removal for the fasted mouse groups) at the end of the dark cycle (feeding cycle) at around 6:30 AM. Mouse livers were then collected after measuring the body and liver weights at the end of the light cycle (non-feeding cycle) at around 6:30 PM on the following date. Consequently, the initial weights determined at 6:30 AM on the first date were slightly higher than the final weights at 6:30 PM on the second date (36-h later), because the mice did not seem to eat during the light cycle even in the fed-mouse groups, as evidenced by empty stomachs observed when the animals were sacrificed. Thus, the decreased body weights in the fed mice may reflect artificial observations depending on the time points of weight measurements under our experimental protocol. Nonetheless, the decreased body weights in fasted Ppara-null mice compared to other groups are significant.
Hepatic steatosis may render (prime) the liver susceptible to more serious conditions such as inflammation and fibrosis due to the increased production of ROS/RNS and the presence of oxidizable unsaturated fatty acids [18,38]. Oxidation of unstaturated fatty acids can produce MDA and 4-HNE, both of which can activate hepatic stellate cells resulting in fibrosis with increased production of collagen and a-smooth muscle actin [44]. Therefore, the main aim of the current study was to characterize the effects of fasting-induced hepatic steatosis in mice lacking PPARα on the production of ROS/RNS, which would make the liver more susceptible to oxidative/nitrative/nitrosative stress. We found that CYP2E1, an enzyme known to produce reactive oxygen species [34,35], was only elevated in response to 36 h fasting in the wild-type group. CYP2E1 protein and/or activity have been positively correlated with the levels of hyperketonemia in animal models [36,45,46]. In addition, ketone bodies induce CYP2E1 protein expression in primary cultured rat hepatocytes [46]. The amounts of ketone bodies are significantly increased in the fasted wild-type mice while they are markedly decreased in the fasted Ppara-null mice compared with their controls [9,12]. The low levels of ketone bodies in fasted Ppara-null mice likely explain one reason why CYP2E1 was not induced in these mice despite fasting. We, however, can not totally exclude the possibility of CYP2E1 involvement because it might have been activated at earlier time points and returned to basal level at later time points. We also observed altered levels of other markers of increased oxidative stress: (1) MDA, which likely participates in acute liver injury or chronic fibrosis [38]; (2) NOS activity, which produces NO, leading to synthesis of a more potent oxidant peroxinitrite (ONOO−) in the presence of ROS and plays a key role in the development/progression of NASH [22]; (3) H2O2, produced from the mitochondria, as demonstrated in alcoholic fatty liver [37]; (4) decreased amounts of total and mitochondrial GSH, one of the most important non-enzymatic anti-oxidants [47], and has been reported to be decreased in liver of obese ob/ob mice [48]. While the highest levels of MDA, NOS activity, and H2O2 were found in the fasted Ppara-null mice, the lowest levels of total and mitochondrial GSH were detected in the same group. All results thus indicate increased oxidative stress in fasted Ppara-null mice as compared to wild-type mice. In addition, we determined some parameters of mitochondrial functions to evaluate a possible source of the oxygen species. Our data showed that mitochondrial GSH levels (Fig. 4F) and ATP-synthase activity (not shown) were the lowest in the fasted Ppara-null mice among all the groups, suggesting potential oxidative inhibition of mitochondrial complexes and subsequent production of ROS, contributing to increased oxidative stress in this mouse group, as we described [28,32,33]. In contrast, the lower oxidative stress status in the fasted wild-type mice (than the fasted Ppara-null mice) are somewhat counter-intuitive, since increased availability of fatty acids in the fasted wild-type mice and subsequent oxidation of these fatty acids through elevated CYP2E1 (Fig. 4A), cytochrome P450 4A isozymes, and peroxisomal enzymes such as acyl-CoA oxidase likely increases ROS production leading to increased oxidative stress, as previously reported [20,42,43]. Interestingly, the levels of NOS activity and nitrated proteins were also elevated in the fed Ppara-null group, suggesting that PPARα by itself may have an anti-oxidant role. Together, our data suggest that steatosis caused by PPARα deficiency likely contributes to ROS production and that inhibition of PPARα functions may increase the susceptibility to organ damage in the presence of another toxic agent or factor when compared with the wild-type mice. Further studies are needed to establish the mechanism of increased oxidative stress observed in fasted Ppara-null mice.
Most tissues including the liver contain specific enzymes that protect against ROS-induced oxidative damage. Cell morphology, integrity, and organelle structures can be negatively affected by increased oxidative stress when the production of active oxidants exceeds the capacity of and/or inhibit the anti-oxidant defense mechanism [18,49,50]. The systematic elimination of oxygen radicals (O2.−, H2O2, etc) by the coordinated action of SODs, CAT and GPx is very important in maintaining the healthy status by preventing the formation of highly toxic hydroxyl radicals. Disruption or suppression of the CAT, GPx and SOD activities likely contribute to the induction and/or exacerbation of oxidative stress. In this study, we found that the catalytic activities of anti-oxidant SODs were significantly decreased, while CAT and GPx were slightly inhibited in the fasted Ppara-null mice, but not in the fasted wild-type mice. Since the decreased activity of any of these antioxidant enzymes would compromise the elimination of oxygen radicals, the elevated H2O2 production rate in the fasted Ppara-null mice can be explained. SOD activity, however, was also suppressed in the fed Ppara-null mice, suggesting a role of PPARα in regulating the SOD activity possibly through controlling the extent of oxidative stress. This notion is in agreement with the earlier data that PPARα activation results in up-regulation of certain anti-oxidant enzymes including the mitochondrial SOD2 [51]. Taken together, these data suggest that PPARα may play a protective role against the oxidative stress-induced cellular damage, at least in part, through its regulation of anti-oxidant enzymes.
Nitration of Tyr (3-NT formation) is mediated by RNSs such as peroxynitrite anion (ONOO.−) and nitrogen dioxide (NO2.−), formed as secondary products of NO.− metabolism in the presence of oxidants such as superoxide radicals (O2.−), H2O2, and transition metal centers, and is believed to be an excellent biomarker of NO-dependent oxidant stress [52]. The amounts of nitrated proteins were increased in the liver of obese ob/ob mice, implicating a role for NO in causing low mitochondrial respiratory chain activity in the liver of patients with NASH [53]. In our experiments, 3-NT formation was mostly increased in the steatotic livers of the fasted Ppara-null mice, although the level of nitrated proteins was also increased in the fed Ppara-null group. Protein nitration may cause functional loss of many proteins through inhibition of critical Tyr residues as demonstrated by mitochondrial SOD2 with nitrated Tyr34 [40,54] or rapid degradation of the nitrated proteins [55,56]. Furthermore, protein nitration may inhibit or interfere with the normal cellular signaling pathways mediated through phosphorylation of Tyr residues by a variety of Tyr-specific protein kinases [57,58]. In fact, we observed that SOD2 was nitrated both in the fed- and fasted Ppara-null mice with the highest amount of nitrated-SOD2 in the fasted Ppara-null mice, while the protein levels were not changed. These data with nitrated SOD2 protein with decreased activity in the fasted Ppara-null mice, could explain the decreased SOD activity shown in Fig. 5A and is in agreement with the elevated levels of both NOS activity (Fig. 4C) and 3-NT formation (Fig. 6).
We have recently studied the mechanism of oxidative Cys modifications of mitochondrial proteins and functional consequence of mitochondrial dysfunction, prior to full-blown liver injury, upon exposure to many hepatotoxic agents or under pathological conditions that increase oxidative/nitrosative stress [25,28,31–33,37]. Our current data also showed that many proteins in the fasted Ppara-null only underwent oxidative modifications. One of the oxidized proteins described in our previous studies was mitochondrial ALDH2 [28,31–33,37], which contains a Cys residue in its active site [59] and is responsible for removal of acetaldehyde produced from ethanol metabolism and lipid aldehydes (MDA and HNE) produced from lipid peroxidation [60]. Mitochondrial ALDH2 has been also reported to be inactivated by HNE [61]. In addition, cytosolic ALDH1 was also found to be inhibited through reversible modifications of Cys residue(s) [32]. We observed that ALDH activities were elevated in the fasted wild-type mice. Similarly, ALDH activities were much higher in the fed Ppara-null mice compared with their wild-type counterparts, which may represent a compensatory mechanism for removal of reactive aldehydes encoded by the PPARα gene. Although we do not know the exact reason for the elevation of ALDH activity, our data are similar to that reported earlier [62]. Nonetheless, ALDH activities were significantly inhibited in the fasted Ppara-null mice compared to those in the fed Ppara-null mice and this inhibition was completely reversed by incubation with a reducing agent DTT, suggesting reversible inactivation of ALDH activities through oxidative modifications of active site Cys as discussed above. Because of highly conserved sequences in the active site Cys and its vicinity, we expect that other ALDH enzymes would also be inhibited in the fasted- Ppara-null mice, as reported earlier [32]. The inhibition of ALDH activities would provide a possible explanation for the persistent elevation of MDA levels encountered in the fasted Ppara-null mice (Fig. 4B). These results together with the results (shown in Figs. 4 – 6) indicate that PPARα may have an anti-oxidant role, whether directly or indirectly, and that increased oxidative stress may play a more profound role than nitrosative stress alone in promoting cellular damage in Ppara-null mice mainly because the levels of NOS and protein nitration were also higher in our system in the fed Ppara-null mice.
TNF-α, one of the proinflammatory cytokines increased during liver steatosis in Ppara-null mice [23] that may enhance levels of oxidative stress [18], does not seem to play a major role in the increased levels of oxidative stress in the fasted Ppara-null mice based on minor changes in TNF-α (Fig. 10) and no signs of inflammation (i.e., infiltration of immune cells) in the liver histological evaluations (Fig. 1), suggesting that the initiation of oxidative stress is not dependent on elevation of inflammatory cytokines under our experimental conditions. Alternatively, oxidative stress takes place before development of inflammation.
Anderson et al. [63] reported that intact livers or primary hepatocytes isolated from Ppara-null mice were more sensitive to damage after exposure to toxic chemicals such carbon tetrachloride, paraquat, and cadmium. The authors attributed the damaging effects to the ability of PPARα to regulate many proteins that are involved in maintaining protein integrity such as chaperone and chaperonin proteins that bind to unfolded proteins and prevent aggregation and accompanying cytotoxicity, and proteasome family members involved in the degradation of damaged or excess proteins, all of which were absent in the Ppara-null mice. In addition, the activation of PPARα protects against acetaminophen-mediated liver toxicity [64]. Our data are not only consistent with these reports but also provide another possible underlying mechanism for these findings. Furthermore, based on our data, it is likely that inhibition of PPARα functions likely increases the susceptibility to oxidative damage, especially under fasting-induced steatosis conditions, to hepatotoxic agents that also cause elevated oxidative stress levels. It is thus recommended to interpret data with caution when the experiments are conducted with Ppara-null mice under overnight fasting conditions, a standard procedure in many toxicological studies, since food could cause variability in the metabolic status of the hepatocytes.
In summary, the current study demonstrated that in steatotic livers of mice lacking PPARα, the increased production of ROS/RNS together with the overall reduced antioxidant capacity with decreased ALDH activities, likely lead to increased MDA (lipid peroxidation), protein nitration, protein oxidation, all of which can inactivate proteins. When the functions of mitochondrial proteins are negatively affected, this will trigger a vicious cycle of ROS/RNS formation due to additional oxygen radicals that leak from the mitochondrial electron transport chain. Based on the little difference in the levels of nitrated proteins in the fed and fasted Ppara-null female mice, our data not only demonstrate evidence for an anti-oxidant role of PPARα but may also provide a potential mechanism for the elevated oxidative stress and consequences reported earlier by other studies.
Acknowledgments
This research was supported by the Intramural Research Program of National Institute on Alcohol Abuse and Alcoholism. We are thankful to Dr. Klaus Gawrisch for supporting this study.
Abbreviations
- ALDH
aldehyde dehydrogenase
- Biotin-NM
biotin-conjugated-N-maleimide
- CAT
catalase
- CHAPS
3-[(3-cholamidopropyl)-1-dimethylammonio]-propanesulfonic acid
- CYP2E1
cytochrome P450-2E1
- DTT
1,4-dithiothreitol
- GSH
glutathione
- GPx
glutathione peroxidase
- H2O2
hydrogen peroxide
- HNE
4-hydroxynonenal
- MDA
malondialdehyde
- NEM
N-ethylmaleimide
- NOS
nitric oxide synthase
- 3-NT
3-nitrotyrosine
- NAFLD
nonalcoholic fatty liver diseases
- NASH
nonalcoholic steatohepatitis
- PPARα
peroxisome proliferator-activated receptor-α
- PNP
p-nitrophenol
- SOD
superoxide dismutase
- TNF-α
tumor necrosis factor-alpha
Footnotes
Publisher's Disclaimer: This is a PDF file of an unedited manuscript that has been accepted for publication. As a service to our customers we are providing this early version of the manuscript. The manuscript will undergo copyediting, typesetting, and review of the resulting proof before it is published in its final citable form. Please note that during the production process errors may be discovered which could affect the content, and all legal disclaimers that apply to the journal pertain.
References
- 1.Kliewer SA, Forman BM, Blumberg B, Ong ES, Borgmeyer U, Mangelsdorf DJ, Umesono K, Evans RM. Differential expression and activation of a family of murine peroxisome proliferator-activated receptors. Proc Natl Acad Sci U S A. 1994;91:7355–7359. doi: 10.1073/pnas.91.15.7355. [DOI] [PMC free article] [PubMed] [Google Scholar]
- 2.Braissant O, Foufelle F, Scotto C, Dauca M, Wahli W. Differential expression of peroxisome proliferator-activated receptors (PPARs): tissue distribution of PPAR-alpha, -beta, and -gamma in the adult rat. Endocrinology. 1996;137:354–366. doi: 10.1210/endo.137.1.8536636. [DOI] [PubMed] [Google Scholar]
- 3.Greene ME, Blumberg B, McBride OW, Yi HF, Kronquist K, Kwan K, Hsieh L, Greene G, Nimer SD. Isolation of the human peroxisome proliferator activated receptor gamma cDNA: expression in hematopoietic cells and chromosomal mapping. Gene Expr. 1995;4:281–299. [PMC free article] [PubMed] [Google Scholar]
- 4.Desvergne B, Wahli W. Peroxisome proliferator-activated receptors: nuclear control of metabolism. Endocr Rev. 1999;20:649–688. doi: 10.1210/edrv.20.5.0380. [DOI] [PubMed] [Google Scholar]
- 5.Mandard S, Muller M, Kersten S. Peroxisome proliferator-activated receptor alpha target genes. Cell Mol Life Sci. 2004;61:393–416. doi: 10.1007/s00018-003-3216-3. [DOI] [PMC free article] [PubMed] [Google Scholar]
- 6.Poirier H, Niot I, Monnot MC, Braissant O, Meunier-Durmort C, Costet P, Pineau T, Wahli W, Willson TM, Besnard P. Differential involvement of peroxisome-proliferator-activated receptors alpha and delta in fibrate and fatty-acid-mediated inductions of the gene encoding liver fatty-acid-binding protein in the liver and the small intestine. Biochem J. 2001;355:481–488. doi: 10.1042/0264-6021:3550481. [DOI] [PMC free article] [PubMed] [Google Scholar]
- 7.Rodriguez JC, Gil-Gomez G, Hegardt FG, Haro D. Peroxisome proliferator-activated receptor mediates induction of the mitochondrial 3-hydroxy-3-methylglutaryl-CoA synthase gene by fatty acids. J Biol Chem. 1994;269:18767–18772. [PubMed] [Google Scholar]
- 8.Aoyama T, Peters JM, Iritani N, Nakajima T, Furihata K, Hashimoto T, Gonzalez FJ. Altered constitutive expression of fatty acid-metabolizing enzymes in mice lacking the peroxisome proliferator-activated receptor alpha (PPARalpha) J Biol Chem. 1998;273:5678–5684. doi: 10.1074/jbc.273.10.5678. [DOI] [PubMed] [Google Scholar]
- 9.Kersten S, Seydoux J, Peters JM, Gonzalez FJ, Desvergne B, Wahli W. Peroxisome proliferator-activated receptor alpha mediates the adaptive response to fasting. J Clin Invest. 1999;103:1489–1498. doi: 10.1172/JCI6223. [DOI] [PMC free article] [PubMed] [Google Scholar]
- 10.Leone TC, Weinheimer CJ, Kelly DP. A critical role for the peroxisome proliferator-activated receptor alpha (PPARalpha) in the cellular fasting response: the PPARalpha-null mouse as a model of fatty acid oxidation disorders. Proc Natl Acad Sci U S A. 1999;96:7473–7478. doi: 10.1073/pnas.96.13.7473. [DOI] [PMC free article] [PubMed] [Google Scholar]
- 11.Hashimoto T, Cook WS, Qi C, Yeldandi AV, Reddy JK, Rao MS. Defect in peroxisome proliferator-activated receptor alpha-inducible fatty acid oxidation determines the severity of hepatic steatosis in response to fasting. J Biol Chem. 2000;275:28918–28928. doi: 10.1074/jbc.M910350199. [DOI] [PubMed] [Google Scholar]
- 12.Lee SS, Chan WY, Lo CK, Wan DC, Tsang DS, Cheung WT. Requirement of PPARalpha in maintaining phospholipid and triacylglycerol homeostasis during energy deprivation. J Lipid Res. 2004;45:2025–2037. doi: 10.1194/jlr.M400078-JLR200. [DOI] [PubMed] [Google Scholar]
- 13.Hong JY, Pan JM, Gonzalez FJ, Gelboin HV, Yang CS. The induction of a specific form of cytochrome P-450 (P-450j) by fasting. Biochem Biophys Res Commun. 1987;142:1077–1083. doi: 10.1016/0006-291x(87)91525-7. [DOI] [PubMed] [Google Scholar]
- 14.Brown BL, Allis JW, Simmons JE, House DE. Fasting for less than 24 h induces cytochrome P450 2E1 and 2B1/2 activities in rats. Toxicol Lett. 1995;81:39–44. doi: 10.1016/0378-4274(95)03407-2. [DOI] [PubMed] [Google Scholar]
- 15.Marczuk-Krynicka D, Hryniewiecki T, Piatek J, Paluszak J. The effect of brief food withdrawal on the level of free radicals and other parameters of oxidative status in the liver. Med Sci Monit. 2003;9:BR131–135. [PubMed] [Google Scholar]
- 16.Sorensen M, Sanz A, Gomez J, Pamplona R, Portero-Otin M, Gredilla R, Barja G. Effects of fasting on oxidative stress in rat liver mitochondria. Free Radic Res. 2006;40:339–347. doi: 10.1080/10715760500250182. [DOI] [PubMed] [Google Scholar]
- 17.Bauer M, Hamm AC, Bonaus M, Jacob A, Jaekel J, Schorle H, Pankratz MJ, Katzenberger JD. Starvation response in mouse liver shows strong correlation with life-span-prolonging processes. Physiol Genomics. 2004;17:230–244. doi: 10.1152/physiolgenomics.00203.2003. [DOI] [PubMed] [Google Scholar]
- 18.Begriche K, Igoudjil A, Pessayre D, Fromenty B. Mitochondrial dysfunction in NASH: causes, consequences and possible means to prevent it. Mitochondrion. 2006;6:1–28. doi: 10.1016/j.mito.2005.10.004. [DOI] [PubMed] [Google Scholar]
- 19.Letteron P, Fromenty B, Terris B, Degott C, Pessayre D. Acute and chronic hepatic steatosis lead to in vivo lipid peroxidation in mice. J Hepatol. 1996;24:200–208. doi: 10.1016/s0168-8278(96)80030-4. [DOI] [PubMed] [Google Scholar]
- 20.Leclercq IA, Farrell GC, Field J, Bell DR, Gonzalez FJ, Robertson GR. CYP2E1 and CYP4A as microsomal catalysts of lipid peroxides in murine nonalcoholic steatohepatitis. J Clin Invest. 2000;105:1067–1075. doi: 10.1172/JCI8814. [DOI] [PMC free article] [PubMed] [Google Scholar]
- 21.Catala A. Lipid peroxidation of membrane phospholipids generates hydroxy-alkenals and oxidized phospholipids active in physiological and/or pathological conditions. Chem Phys Lipids. 2009;157:1–11. doi: 10.1016/j.chemphyslip.2008.09.004. [DOI] [PubMed] [Google Scholar]
- 22.Fujita K, Nozaki Y, Yoneda M, Wada K, Takahashi H, Kirikoshi H, Inamori M, Saito S, Iwasaki T, Terauchi Y, Maeyama S, Nakajima A. Nitric Oxide plays a crucial role in the development/progression of nonalcoholic steatohepatitis in the choline-deficient, l-amino acid-defined diet-fed rat model. Alcohol Clin Exp Res. 2008 Oct 30; doi: 10.1111/j.1530-0277.2008.00756.x. [Epub ahead of print] [DOI] [PubMed] [Google Scholar]
- 23.Stienstra R, Mandard S, Patsouris D, Maass C, Kersten S, Muller M. Peroxisome proliferator-activated receptor alpha protects against obesity-induced hepatic inflammation. Endocrinology. 2007;148:2753–2763. doi: 10.1210/en.2007-0014. [DOI] [PubMed] [Google Scholar]
- 24.Lee SS, Pineau T, Drago J, Lee EJ, Owens JW, Kroetz DL, Fernandez-Salguero PM, Westphal H, Gonzalez FJ. Targeted disruption of the alpha isoform of the peroxisome proliferator-activated receptor gene in mice results in abolishment of the pleiotropic effects of peroxisome proliferators. Mol Cell Biol. 1995;15:3012–3022. doi: 10.1128/mcb.15.6.3012. [DOI] [PMC free article] [PubMed] [Google Scholar]
- 25.Suh SK, Hood BL, Kim BJ, Conrads TP, Veenstra TD, Song BJ. Identification of oxidized mitochondrial proteins in alcohol-exposed human hepatoma cells and mouse liver. Proteomics. 2004;4:3401–3412. doi: 10.1002/pmic.200400971. [DOI] [PubMed] [Google Scholar]
- 26.Bae MA, Song BJ. Critical role of c-Jun N-terminal protein kinase activation in troglitazone-induced apoptosis of human HepG2 hepatoma cells. Mol Pharmacol. 2003;63:401–408. doi: 10.1124/mol.63.2.401. [DOI] [PubMed] [Google Scholar]
- 27.Chen Q, Vazquez EJ, Moghaddas S, Hoppel CL, Lesnefsky EJ. Production of reactive oxygen species by mitochondria: central role of complex III. J Biol Chem. 2003;278:36027–36031. doi: 10.1074/jbc.M304854200. [DOI] [PubMed] [Google Scholar]
- 28.Moon KH, Upreti VV, Yu LR, Lee IJ, Ye X, Eddington ND, Veenstra TD, Song BJ. Mechanism of 3,4-methylenedioxymethamphetamine (MDMA, ecstasy)-mediated mitochondrial dysfunction in rat liver. Proteomics. 2008;8:3906–3918. doi: 10.1002/pmic.200800215. [DOI] [PMC free article] [PubMed] [Google Scholar]
- 29.Reinke LA, Moyer MJ. p-Nitrophenol hydroxylation. A microsomal oxidation which is highly inducible by ethanol. Drug Metab Dispos. 1985;13:548–552. [PubMed] [Google Scholar]
- 30.Kim BJ, Ryu SW, Song BJ. JNK- and p38 kinase-mediated phosphorylation of Bax leads to its activation and mitochondrial translocation and to apoptosis of human hepatoma HepG2 cells. J Biol Chem. 2006;281:21256–21265. doi: 10.1074/jbc.M510644200. [DOI] [PubMed] [Google Scholar]
- 31.Moon KH, Hood BL, Mukhopadhyay P, Rajesh M, Abdelmegeed MA, Kwon YI, Conrads TP, Veenstra TD, Song BJ, Pacher P. Oxidative inactivation of key mitochondrial proteins leads to dysfunction and injury in hepatic ischemia reperfusion. Gastroenterology. 2008;135:1344–1357. doi: 10.1053/j.gastro.2008.06.048. [DOI] [PMC free article] [PubMed] [Google Scholar]
- 32.Moon KH, Abdelmegeed MA, Song BJ. Inactivation of cytosolic aldehyde dehydrogenase via S-nitrosylation in ethanol-exposed rat liver. FEBS Lett. 2007;581:3967–3972. doi: 10.1016/j.febslet.2007.07.037. [DOI] [PMC free article] [PubMed] [Google Scholar]
- 33.Moon KH, Hood BL, Kim BJ, Hardwick JP, Conrads TP, Veenstra TD, Song BJ. Inactivation of oxidized and S-nitrosylated mitochondrial proteins in alcoholic fatty liver of rats. Hepatology. 2006;44:1218–1230. doi: 10.1002/hep.21372. [DOI] [PubMed] [Google Scholar]
- 34.Novak RF, Woodcroft KJ. The alcohol-inducible form of cytochrome P450 (CYP2E1): role in toxicology and regulation of expression. Arch Pharm Res. 2000;23:267–282. doi: 10.1007/BF02975435. [DOI] [PubMed] [Google Scholar]
- 35.Caro AA, Cederbaum AI. Oxidative stress, toxicology, and pharmacology of CYP2E1. Annu Rev Pharmacol Toxicol. 2004;44:27–42. doi: 10.1146/annurev.pharmtox.44.101802.121704. [DOI] [PubMed] [Google Scholar]
- 36.Yun YP, Casazza JP, Sohn DH, Veech RL, Song BJ. Pretranslational activation of cytochrome P450IIE during ketosis induced by a high fat diet. Mol Pharmacol. 1992;41:474–479. [PubMed] [Google Scholar]
- 37.Song BJ, Moon KH, Olsson NU, Salem N., Jr Prevention of alcoholic fatty liver and mitochondrial dysfunction in the rat by long-chain polyunsaturated fatty acids. J Hepatol. 2008;49:262–273. doi: 10.1016/j.jhep.2008.04.023. [DOI] [PMC free article] [PubMed] [Google Scholar]
- 38.Mantena SK, King AL, Andringa KK, Eccleston HB, Bailey SM. Mitochondrial dysfunction and oxidative stress in the pathogenesis of alcohol- and obesity-induced fatty liver diseases. Free Radic Biol Med. 2008;44:1259–1272. doi: 10.1016/j.freeradbiomed.2007.12.029. [DOI] [PMC free article] [PubMed] [Google Scholar]
- 39.Mantena SK, Vaughn DP, Andringa KK, Eccleston HB, King AL, Abrams GA, Doeller JE, Kraus DW, Darley-Usmar VM, Bailey SM. High fat diet induces dysregulation of hepatic oxygen gradients and mitochondrial function in vivo. Biochem J. 2009;417:183–193. doi: 10.1042/BJ20080868. [DOI] [PMC free article] [PubMed] [Google Scholar]
- 40.Yamakura F, Taka H, Fujimura T, Murayama K. Inactivation of human manganese-superoxide dismutase by peroxynitrite is caused by exclusive nitration of tyrosine 34 to 3-nitrotyrosine. J Biol Chem. 1998;273:14085–14089. doi: 10.1074/jbc.273.23.14085. [DOI] [PubMed] [Google Scholar]
- 41.Gonzalez FJ, Shah YM. PPARalpha: mechanism of species differences and hepatocarcinogenesis of peroxisome proliferators. Toxicology. 2008;246:2–8. doi: 10.1016/j.tox.2007.09.030. [DOI] [PubMed] [Google Scholar]
- 42.Yu S, Rao S, Reddy JK. Peroxisome proliferator-activated receptors, fatty acid oxidation, steatohepatitis and hepatocarcinogenesis. Curr Mol Med. 2003;3:561–572. doi: 10.2174/1566524033479537. [DOI] [PubMed] [Google Scholar]
- 43.Hardwick JP. Cytochrome P450 omega hydroxylase (CYP4) function in fatty acid metabolism and metablic diseases. Biochem Pharmacol. 2008;75:2263–2275. doi: 10.1016/j.bcp.2008.03.004. [DOI] [PubMed] [Google Scholar]
- 44.Zern MA, Leo MA, Giambrone MA, Lieber CS. Increased type I procollagen mRNA levels and in vitro protein synthesis in the baboon model of chronic alcoholic liver disease. Gastroenterology. 1985;89:1123–1131. doi: 10.1016/0016-5085(85)90219-7. [DOI] [PubMed] [Google Scholar]
- 45.Shimojo N. Cytochrome P450 changes in rats with streptozocin-induced diabetes. Int J Biochem. 1994;26:1261–1268. doi: 10.1016/0020-711x(94)90095-7. [DOI] [PubMed] [Google Scholar]
- 46.Abdelmegeed MA, Carruthers NJ, Woodcroft KJ, Kim SK, Novak RF. Acetoacetate induces CYP2E1 protein and suppresses CYP2E1 mRNA in primary cultured rat hepatocytes. J Pharmacol Exp Ther. 2005;315:203–213. doi: 10.1124/jpet.105.084608. [DOI] [PubMed] [Google Scholar]
- 47.Meister A, Anderson ME. Glutathione. Annu Rev Biochem. 1983;52:711–760. doi: 10.1146/annurev.bi.52.070183.003431. [DOI] [PubMed] [Google Scholar]
- 48.Barnett CR, Abbott RA, Bailey CJ, Flatt PR, Ioannides C. Cytochrome P-450-dependent mixed-function oxidase and glutathione S-transferase activities in spontaneous obesity-diabetes. Biochem Pharmacol. 1992;43:1868–1871. doi: 10.1016/0006-2952(92)90724-w. [DOI] [PubMed] [Google Scholar]
- 49.Halliwell B, Gutteridge JM, Cross CE. Free radicals, antioxidants, and human disease: where are we now? J Lab Clin Med. 1992;119:598–620. [PubMed] [Google Scholar]
- 50.Yu BP. Cellular defenses against damage from reactive oxygen species. Physiol Rev. 1994;74:139–162. doi: 10.1152/physrev.1994.74.1.139. [DOI] [PubMed] [Google Scholar]
- 51.Takahashi M, Tsuboyama-Kasaoka N, Nakatani T, Ishii M, Tsutsumi S, Aburatani H, Ezaki O. Fish oil feeding alters liver gene expressions to defend against PPARalpha activation and ROS production. Am J Physiol Gastrointest Liver Physiol. 2002;282:G338–348. doi: 10.1152/ajpgi.00376.2001. [DOI] [PubMed] [Google Scholar]
- 52.Radi R. Nitric oxide, oxidants, and protein tyrosine nitration. Proc Natl Acad Sci U S A. 2004;101:4003–4008. doi: 10.1073/pnas.0307446101. [DOI] [PMC free article] [PubMed] [Google Scholar]
- 53.Garcia-Ruiz I, Rodriguez-Juan C, Diaz-Sanjuan T, del Hoyo P, Colina F, Munoz-Yague T, Solis-Herruzo JA. Uric acid and anti-TNF antibody improve mitochondrial dysfunction in ob/ob mice. Hepatology. 2006;44:581–591. doi: 10.1002/hep.21313. [DOI] [PubMed] [Google Scholar]
- 54.Quint P, Reutzel R, Mikulski R, McKenna R, Silverman DN. Crystal structure of nitrated human manganese superoxide dismutase: mechanism of inactivation. Free Radic Biol Med. 2006;40:453–458. doi: 10.1016/j.freeradbiomed.2005.08.045. [DOI] [PubMed] [Google Scholar]
- 55.Souza JM, Choi I, Chen Q, Weisse M, Daikhin E, Yudkoff M, Obin M, Ara J, Horwitz J, Ischiropoulos H. Proteolytic degradation of tyrosine nitrated proteins. Arch Biochem Biophys. 2000;380:360–366. doi: 10.1006/abbi.2000.1940. [DOI] [PubMed] [Google Scholar]
- 56.Elfering SL, Haynes VL, Traaseth NJ, Ettl A, Giulivi C. Aspects, mechanism, and biological relevance of mitochondrial protein nitration sustained by mitochondrial nitric oxide synthase. Am J Physiol Heart Circ Physiol. 2004;286:H22–29. doi: 10.1152/ajpheart.00766.2003. [DOI] [PubMed] [Google Scholar]
- 57.Gow AJ, Duran D, Malcolm S, Ischiropoulos H. Effects of peroxynitrite-induced protein modifications on tyrosine phosphorylation and degradation. FEBS Lett. 1996;385:63–66. doi: 10.1016/0014-5793(96)00347-x. [DOI] [PubMed] [Google Scholar]
- 58.Pacher P, Beckman JS, Liaudet L. Nitric oxide and peroxynitrite in health and disease. Physiol Rev. 2007;87:315–424. doi: 10.1152/physrev.00029.2006. [DOI] [PMC free article] [PubMed] [Google Scholar]
- 59.Farres J, Wang TT, Cunningham SJ, Weiner H. Investigation of the active site cysteine residue of rat liver mitochondrial aldehyde dehydrogenase by site-directed mutagenesis. Biochemistry. 1995;34:2592–2598. doi: 10.1021/bi00008a025. [DOI] [PubMed] [Google Scholar]
- 60.Hartley DP, Ruth JA, Petersen DR. The hepatocellular metabolism of 4-hydroxynonenal by alcohol dehydrogenase, aldehyde dehydrogenase, and glutathione S-transferase. Arch Biochem Biophys. 1995;316:197–205. doi: 10.1006/abbi.1995.1028. [DOI] [PubMed] [Google Scholar]
- 61.Doorn JA, Hurley TD, Petersen DR. Inhibition of human mitochondrial aldehyde dehydrogenase by 4-hydroxynon-2-enal and 4-oxonon-2-enal. Chem Res Toxicol. 2006;19:102–110. doi: 10.1021/tx0501839. [DOI] [PubMed] [Google Scholar]
- 62.You M, Fischer M, Cho WK, Crabb D. Transcriptional control of the human aldehyde dehydrogenase 2 promoter by hepatocyte nuclear factor 4: inhibition by cyclic AMP and COUP transcription factors. Arch Biochem Biophys. 2002;398:79–86. doi: 10.1006/abbi.2001.2713. [DOI] [PubMed] [Google Scholar]
- 63.Anderson SP, Howroyd P, Liu J, Qian X, Bahnemann R, Swanson C, Kwak MK, Kensler TW, Corton JC. The transcriptional response to a peroxisome proliferator-activated receptor alpha agonist includes increased expression of proteome maintenance genes. J Biol Chem. 2004;279:52390–52398. doi: 10.1074/jbc.M409347200. [DOI] [PubMed] [Google Scholar]
- 64.Shankar K, Vaidya VS, Corton JC, Bucci TJ, Liu J, Waalkes MP, Mehendale HM. Activation of PPAR-alpha in streptozotocin-induced diabetes is essential for resistance against acetaminophen toxicity. FASEB J. 2003;17:1748–1750. doi: 10.1096/fj.02-1186fje. [DOI] [PubMed] [Google Scholar]


