

Abstract
The resonant cavity imaging biosensor (RCIB) is an optical technique for detecting molecular binding interactions label free at many locations in parallel that employs an optical resonant cavity for high sensitivity. Near-infrared light centered at 1512.5 nm couples resonantly through a Fabry–Perot cavity constructed from dielectric reflectors (Si/SiO2), one of which serves as the binding surface. As the wavelength is swept using a tunable laser, a near-infrared digital camera monitors cavity transmittance at each pixel. A wavelength shift in the local resonant response of the optical cavity indicates binding. Positioning the sensing surface with respect to the standing wave pattern of the electric field within the cavity controls the sensitivity with which the presence of bound molecules is detected. Transmitted intensity at thousands of pixel locations is recorded simultaneously in a 10 s, 5 nm scan. An initial proof-of-principle setup has been constructed. A test sample was fabricated with 25, 100-μm wide square features, each with a different density of 1-μm square depressions etched 12 nm into the SiO2 surface. The average depth of each etched region was found with 0.05 nm rms precision. In a second test, avidin, bound selectively to biotin conjugated bovine serum albumin, was detected.
Index Terms: Biochemistry, chemical transducers, optical resonance
I. Introduction
Much of the mechanisms of life—cell physiology, regulation of gene expression, and cell replication—and even the development of disease rely heavily on binding events. These entail the physical association of proteins and/or nucleic acid to form multicomponent complexes, associations that often exhibit exquisite specificity. There exists, as such, a continued drive in both biological research and medicine for tools to interrogate these interactions with greater efficiency, accuracy, and simplicity. The ability to scale throughput and simultaneously measure binding in complex arrays has become the basis for DNA and protein microarray technology, which has led to new fields of exploration in genomics and proteomics [1]–[3]. Protein microarray technology may hold particular benefit in medicine for the detection of protein biomarkers that can provide a wealth of information about a particular patient’s health [4]. Label-free detection schemes for interrogating molecular interactions, such as surface plasmon resonance (SPR) that do not require the labeling of one or the other binding components with a fluorescent dye, radiolabel, or other modification, are preferable [5]. This is particularly true in the case of protein assays, where direct labeling methods may unpredictably alter the binding properties of the target protein, whereas alternative indirect labeling methods may suffer from significant nonspecific binding or cross reactivity [6]. We present a technique based on a Fabry–Perot cavity for interrogating binding interactions label free that detects from many locations in parallel on the surface of one of the reflectors with the capacity to scale readily to much greater throughput.
The present approach measures molecule binding to a surface by monitoring the resulting change in optical transmission characteristics of a resonant cavity structure. This change can be the result of a thickness increase of a thin layer of molecules on the surface (height change), a refractive index change, or a combination of height and index change. Interference microscopes have long been used in the biological sciences for deducing the amount of material present on a glass slide by measuring the optical path difference, product of the thickness and refractive index [7]. In addition, optical surface profilers that detect height changes across a surface by interference are standard tools in many semiconductor-processing laboratories [8]. Similar interference techniques optimized for detecting molecules bound to a dielectric surface such as SiO2 have been developed specifically for biosensing applications [9]–[18]. What differentiates the present work from previous interference-based efforts is the use of a Fabry–Perot cavity, where one reflector serves as the binding surface. The key advantage is the high throughput, or the number of spots detected in parallel that becomes immediately available with this configuration combined with the high sensitivity that optical resonance can provide. In the present demonstration, 16384 pixels on the camera perform independent simultaneous measurements, a number that scales readily with higher pixel density cameras. In addition, the setup can be made simple and cost effective to operate.
In comparison with imaging SPR, it is worth noting that the present technique makes use of a SiO2 surface rather than a metallic surface [19], [20]. The use of SiO2 provides a different set of surface activation chemistries. The choice of SiO2/Si also benefits from mature semiconductor processing technology that may offer reduced cost and enables easy integration with electronics for potential lab-on-a-chip applications. It is also noted that SPR detection is generally performed real-time in solution, which can enable one to observe binding dynamics [19]. Whereas binding dynamics are important for a number of applications, there often remains great value in observing the endpoint alone, particularly when doing so provides improved test simplicity, cost effectiveness, or speed. Nearly the entire present day DNA and protein microarray market, including commercially available medical diagnostics, observe only the binding endpoint [1]–[4], [21]. As well, many low-throughput protein-based medical diagnostics forgo observing binding dynamics [22]. In the present system, real time, in solution measurements, have been avoided along with the challenge they present to cavity stability. The value that the present technique offers over state-of-the-art label-free sensing is that the setup is simple, tests can be fast and cost effective, and the technique scales readily to very high throughput. These attributes may well be most significant for widespread use in medical diagnostics.
II. Principles
A. Operation
Two partially reflecting surfaces are positioned facing one another to form a Fabry–Perot cavity (see Fig. 1). The capturing agents are patterned on one of the reflecting surfaces. A collimated beam of light is incident on the cavity through one of the reflectors, and the wavelength is swept in time. A camera images the transmitted intensity mapping the resonance characteristic from each location along the planar cavity surface to a pixel on the camera. Target molecules bound to their corresponding capturing agents fixed to the reflector surface shift the local resonant condition of the cavity. Essentially, on-resonance light is stored inside the cavity, and sensitivity to changes in index or layer thickness at a point is enhanced proportional to the local optical field. Tuning the wavelength of the excitation light and monitoring the transmitted light with a detector array (camera) allows simultaneous recording of the transmission spectra of the entire structure, i.e., all individual binding features. The number of spots evaluated simultaneously is essentially limited by the number of pixels available on the camera, and thus, can scale readily to achieve very high throughput. State-of-the-art tunable lasers provide robust and precise control of the excitation wavelength.
Fig. 1.

Light enters the cavity through the reverse side of the first reflector. The wavelength is swept, and wavelength versus transmission curves are recorded by a camera positioned beyond the cavity. The capturing agents are fixed to one of the reflector surfaces, and binding to the surface is indicated by a local shift in the resonant response of the cavity.
B. Resonant Cavity
The reflectors in the present demonstration consist of alternating layers of Si and SiO2. The optical field within the cavity forms a standing wave pattern with periodic maxima and minima. The reflector which serves as the sensing surface is given an extra SiO2 layer, approximately a quarter wavelength thick, such that the sensing surface is at a field maximum within the cavity. When the sensing surface is in a field maximum, thickness (or index) changes at that surface have a maximum effect on the field distribution, thereby shifting the resonant wavelength by maximum amount. For a surface placed in a standing wave minimum, a small change in thickness (or index) has almost no effect on the optical field, and hence, the transmission spectra. The ability to control the sensitivity by controlling the thickness of the final oxide layer is highly advantageous. By eliminating the extra oxide layer from the far reflector, the local resonant condition can be made insensitive to any contaminants that may be bound on the far reflector. Though it was not performed presently, the oxide may similarly be removed in the background regions of the probe reflector (between capturing agent spots). This would cause the background regions to become insensitive to nonspecific binding and serve as important reference surfaces.
The sensitivity and its control can be understood by modeling the optical cavity. The principles of basic resonant optical cavities have been described previously [23], [24]. The amount of light transmitted through a planar optical cavity formed between two reflectors is found by setting up a boundary value problem for the electric field, as described by Yeh [25]. The solution for the transmittance T in the simplest case of two identical reflectors takes the form
| (1) |
where ni and nf are the refractive indices for the starting medium and ending medium, respectively (typically air), t is the transmission coefficient for each reflector, r is the reflection coefficient for each reflector, d is the separation of the reflectors, and k = 2nπ/λ, where λ is the wavelength of light in free space. In (1), when 2kd is an integer multiple of 2π, resonance is observed. As d changes, the resonant wavelengths shift.
The present case, however, is not as simple as the case where the reflector separation d changes. The adsorption of molecules can be modeled in this case as a small extension of the SiO2 sensing interface, or a small deviation in the position d1, as shown in Fig. 2. The boundary value problem for the electric field, as shown in Fig. 2, is given by:
| (2) |
Fig. 2.

Boundary value problem in the present case consists of three boundaries: the boundary at either reflector (x = 0 and x = d2) and the boundary between the low-index layer and the cavity medium (x = d1). The r’s indicate the coefficient of reflection at the three boundaries (0, 1, and 2), and t’s indicate the coefficient of transmission through each boundary.
The solution for the transmittance T [see (3)] now has three terms in the denominator, which correspond to three optical cavities: one between the boundaries at x = 0 and d1 (cavity medium), one between the boundaries at d1 and d2 (dΔ = d2 − d1; low-index layer), and one between the boundaries at x = 0 and d2 (cavity medium + low-index layer)
| (3) |
When the thickness dΔ increases slightly, the optical path length of the cavity described by the third term is increased, while the optical path length of the cavity described by the second term is decreased. When the thickness dΔ is nearly zero, these effects work against each other to diminish sensitivity (zero sensitivity in the limit of a small change in thickness dΔ = 0). When the thickness dΔ is a quarter wavelength, a π phase shift is introduced, and the effects add optimally for high sensitivity. Similar calculation shows that for a thin layer (few nanometers), the sensitivity to slight index changes within the thin sensing layer follows a similar behavior: namely, that the sensitivity can be made nearly zero or maximum with the addition or omission of an extra SiO2 layer that would place the sensing surface in a field maximum.
C. Sensitivity
From the model discussed in the previous section, one finds that for a thin layer of additional material, the shift in the resonant wavelength for small changes in height or refractive index is approximately linear. The surface concentration of adsorbed proteins has been modeled previously in solution using a fixed height for the adsorbed layer based on the size of the molecule and an incremental refractive index of 0.18 cm3/g for numerous proteins [26], [27]. The surface concentration for protein has been alternatively modeled using a fixed index equal to that of SiO2 (n = 1.44) and variable average height, where a 1 pm increase is approximately equivalent to a 1 pg/mm2 increase in surface concentration [10], [15]. The latter approximation will be used presently, but it is noted that assuming a 0.18-cm3/g incremental refractive index with the present technique yields similar results within a factor of 2.
The ability to accurately measure slight shifts in the resonant curves collected is critical. The resonant curve width and the resulting shift are strong functions of the reflector spacing. Closely spaced reflectors result in broader resonant curves and larger shifts when material is added. The ratio of the shift in frequency to the curve width, however, is constant and proportional to finesse. Finesse, defined in frequency as the ratio of the spectral width of the resonance to the free spectral range is hence the appropriate figure of merit. The ability to measure the shift is then influenced by finesse, the wavelength resolution with which the curves can be characterized, and the uncertainty or noise in each measured point. Measured resonant curves are fitted in a least squares sense to the model.
To understand the benefit that high finesse may offer, a simulation was performed in which 500 curves were calculated from (3) with random shifts, noise was added, the curves were fit, and the deviations in shift from the original curves were observed. The reflectivity of the reflectors was varied to achieve a finesse of 2, 15, and 30, corresponding to 11.5- 1.9-, and 0.9-nm full-width at half-maximum (FWHM) resonant curves, respectively (40-μm cavity spacing). As an approximation, white Gaussian noise was added to the curves with a SNR ranging from 25 to 50 dB, the noisy curves were sampled at 0.01 nm steps and fit. Improving the finesse from 2 to 30 reduced the wavelength deviation 100-fold from 5 to 0.05 pm using an SNR of 50 dB (see Fig. 3). It is noted that using (3), the percent modulation of the transmittance is not independent of the finesse (drops to 10% at a finesse of 2). However, even if 100% modulation could be maintained, similar calculation shows that a finesse of 30 as compared to 2 still provides a 10-fold improvement. This simulation demonstrates how higher finesse can improve the accuracy with which the resonant wavelength can be determined in the presence of noise. Whereas increasing the finesse improves the axial resolution, the finesse cannot be increased arbitrarily while maintaining high lateral resolution. It has been previously considered in filter design that diverging light effectively reduces finesse [28]. What is unique in the present case is that the cavity is being imaged, and it is the numerical aperture (NA) of the imaging system that determines the divergence of the collected light. The broadening effect due to divergence is negligible when the NA is 0.1 and the reflectors are spaced 40 μm apart as is the case in the present demonstration.
Fig. 3.

Curves were calculated based on a 40-μm cavity spacing using (3). Noise was added and the curves were fit in a least squares sense. The reflectivity was adjusted to provide finesse F of 2, 15, and 30. The ability to detect slight changes in wavelength, as shown on the x-axis for different SNRs, is greatly improved by cavity finesse. For 40-μm cavity spacing, 1 nm height = 40 pm wavelength deviation.
III. Experimental Setup
A. Setup
A preliminary resonant cavity imaging biosensor (RCIB) setup has been constructed (see Fig. 4). A tunable wavelength laser serves as the light source and provides 15 μW of continuous power. The laser has a linewidth of 100 MHz and is swept from 1510 to 1515 nm at a rate of 0.5 nm/s. The fiber-coupled light is expanded to 10 mm FWHM using a pair of plano-convex lenses. The cavity is formed between two reflectors held by positioning stages. The first reflector is fixed to a tip-tilt stage with 0.8 arc minute resolution to position the reflectors parallel. The second stage is a translational stage for setting the reflector separation. The cavity is imaged with 5× magnification using a 45-mm focal length achromatic doublet and aperture for setting the NA to 0.1. The 12 μm × 12 μm areas on the sample are imaged to 60 μm × 60 μm pixels on the 128 × 128 pixel infrared camera featuring an indium–gallium–arsenide photodetector array. Antireflection (AR) coatings on all components reduce resonant behavior within and between components.
Fig. 4.

The cavity is formed between two reflectors held by stages (one translation and one tip-tilt). The cavity is illuminated with collimated light from a tunable wavelength laser (Agilent 81640A). Local cavity transmission is imaged on an indium–gallium–arsenide camera (Sensors Unlimited SU128-1.7R).
It is noted that the choice of near-infrared light was dictated by two factors: 1) the availability of Si-supported reflectors that met the requirements described in the following section and which are transparent in this wavelength range; and 2) the availability of high quality tunable lasers also available in this wavelength range. As quality tunable lasers become available in the visible spectrum and with appropriate reflectors, the present setup might benefit from a move to the visible spectrum given the availability of inexpensive high pixel density cameras.
B. Reflectors
The technique requires reflectors that are highly reflecting with low loss (high finesse), smooth, flat, and inexpensive enough to permit one-time-use avoiding cross contamination. Reflectors that meet these requirements have been described previously, and consist of two buried layers of SiO2 in Si [29]. The reflectors achieve 95% reflectivity in the wavelength range used (1510–1515 nm) and provide a measured finesse of 38. The surface roughness as measured by atomic force microscope (AFM) is 1 nm rms over a 25 μm2 area, and the layer thicknesses are uniform to better than 8 nm across the 150-mm wafer, which is diced to 15 mm × 15 mm pieces for use in the setup. In the present case, the final SiO2 coating is thinner (230 nm) than the targeted 270 nm for 1550-nm light, and therefore, the wavelength range is shifted to the low end of the laser range (1510–1515 nm) to compensate. The reverse side of either wafer is polished and given an AR coating to minimize resonant effects within the 600-μm-thick Si substrate.
C. Noise
The detector array provides 12 b digital output for each pixel, where each of the 4096 camera levels corresponds to approximately 1000 photons with a 16.3 ms exposure. Intensity fluctuations contribute 120 camera levels rms, which can be reduced to 15 camera levels by characterizing the fluctuations and normalizing subsequent scans. Calculations indicate for fitted curves shot noise, camera noise, and intensity fluctuations account for less than 8 pm of uncertainty in determining the height of features on the reflector surface when the reflectors are positioned 40 μm apart. The technique is inherently sensitive to reflector separation, which presents another source of noise. In the present setup, the reflector separation is observed to drift 40 pm within the measurement time. Calculations and qualitative tests confirm that the drift is caused by thermal expansion of components. Surface roughness also contributes to the uncertainty in the present measurement process since the signal from a particular feature is found by comparing the resonant wavelength for that region with the average resonant wavelength for the surrounding surface. Roughness from both reflector surfaces contributes to the 300 pm of height uncertainty, and is found to contribute similarly when averaging over different size regions ranging from 10 to 200 μm across. The primary noise contributors, at present, then, are thermal drift of the reflector spacing (40 pm uncertainty) and surface roughness (300 pm uncertainty). In the absence of reflector position drift, surface roughness, intensity fluctuations, and camera noise, for the present cavity configuration (reflectors spaced 40 μm apart and a finesse of 38) and measurement (curves sampled in 0.0167 nm increments) shot noise would limit height sensitivity to 1 pm.
D. Collecting Data
Initial measurements are used to characterize the dark current of the detector array and the wavelength dependency of the recorded intensity at each pixel. The reflectors are positioned approximately 40 μm apart, parallel, and in resonance at 1512.5 nm by adjusting the tip-tilt stage and the axial translation stage while monitoring the transmission. Once aligned, the wavelength is quickly tuned to find two resonant wavelengths for a single pixel, which can be used to calculate the precise reflector separation. Data is collected by sweeping the wavelength from 1510 to 1515 nm in 10 s while collecting frames exposed for 16.3 ms at a rate of 30 fps (0.0167 nm steps). The cavity model is used together with the determined reflector separation to find the relation between wavelength shift and apparent surface height. From (3), one can understand that this apparent height profile may equivalently be the result of local refractive index changes in a thin layer on the SiO2 surface or local increases in layer thickness. The surface is next fit with a second-order 2-D polynomial that is subtracted to remove the effect of reflector curvature and any remaining tilt. The apparent height of features in the data is determined by averaging over the pixels that comprise the feature and comparing their height to the average apparent height of a similar number of neighboring pixels.
IV. Validation
A. Etched Feature Fabrication
As a benchmark for testing the sensitivity of the system, test samples have been fabricated with etched SiO2 depressions that act as artificial binding features. There are 25 features, each being a box region of lateral dimension 100 μm × 100 μm. The regions contain etched depressions, each with a lateral extent of 1 μm × 1 μm square and a depth of approximately 12 nm. The lateral extent of each depression is less than the lateral resolution of the imaging system, and hence, contributes to an average observed height in a similar way that bound molecules contribute to an average observed height. The density is varied from 0 depressions/25 μm2 (unetched) to 24 depressions/25μm2 (nearly all etched) in steps of 1 depression/25 μm2. The depressions were randomly placed in each box feature, and the different density features were randomly placed within a 1 mm2 region on the reflector. Along with the 25 features of interest, an additional 36 squares of similar lateral extent etched 80 nm deep were placed around each variable density feature and appear dark in the resulting image. These deep squares neighboring the features of interest were included to help locate the variable density features for later interrogation with AFM.
The features were created by photolithography. During the processing, the reverse side of the reflector, which had been polished and coated, was protected from damage using a microscope cover slip adhered with photoresist (Shipley, S1813). The top side of the reflector was spun with hexamethyldisilazane, spun with positive photoresist (Shipley, S1805), exposed through a metal-on-glass mask fabricated for creating the pattern described, and lastly developed. The sample was, then, ashed in oxygen plasma before being wet etched with buffered oxide etch (6 NH4 F:1 HF diluted to 1% in deionized water). The depressions measured using AFM were between 10–14 nm deep. The wide variation in depression depth was attributed to uneven ashing, etching, and initial surface roughness.
B. Etched Feature Results and Discussion
Collected resonant curves shown in Fig. 5 have a finesse of 38, and fit the model with a standard deviation that is 4% of the peak intensity. With a sample loaded, the depth of a given feature of depressions, as determined by averaging over the box area (see Fig. 6), was measured with a deviation of better than 0.05 nm rms over multiple scans. The heights were found deviated from a linear dependence on the density of depressions by 0.5 nm rms, which can be expected from the 2 nm variation in depression depth as measured with AFM. Two additional 25-feature sets were fabricated and measured with similar results (not shown). When the sample is removed from the setup, placed back, aligned laterally to the same position, and scanned with a different cavity spacing, the deviation from the previously measured values is 0.3 nm rms. In the new configuration, the features are again measured repeatedly with 0.05 nm rms deviation.
Fig. 5.

Two recorded curves from two different pixels. The 0.3 nm shift, shown here, indicates a 7 nm apparent height difference on the surface for the cavity separation used (~40 μm).
Fig. 6.

(a) Image intensity indicates height. The 36 dark squares and the crosses were deeply etched for alignment purposes. The 25 variable intensity boxes are the 100 μm × 100 μm regions with varying densities of 12-nm deep depressions. Lighter features indicate fewer depressions. The white boxes indicate areas averaged for determining feature height, which for the boxed feature shown was 4.20 nm below the background surface. (b) Average depth is plotted for all 25 features. Five scans were taken (three shown) with 0.05 nm rms deviation from scan to scan and 0.5 nm rms deviation from a linear dependence on depression density.
Both the deviation observed between scans and between alignments can be understood in the context of the previous discussion (Section III) on thermal drift and surface roughness. Shifting the averaging box by one full pixel (corresponds to 12 μm translation) changes the average height values 0.4 nm rms, demonstrating the importance of realignment between scans. Precise alignment presents a challenge since it requires that both reflectors be registered laterally to the camera within a pixel length (lateral adjustments can be difficult to monitor since they generally perturb the cavity resonance). In the case of protein binding, precise alignment would enable the roughness to be characterized initially, and its contribution to be subtracted from the final result. When not subtracted, the roughness adds background signal in a manner akin to the autofluorescence contribution from the slide in a labeled microarray experiment. Finally, it is noted that the 95% reflectivity of the two period Si/SiO2 Bragg structures afforded a finesse of 38, a number that could be greatly improved with optimized reflector design. Sensitivity in the present test was limited by thermal drift of the reflector spacing and surface roughness, both of which could be addressed and improved.
C. Avidin Binding Assay
The presence of avidin specifically bound to bovine serum albumin (BSA) conjugated with biotin (BSA-biotin) was detected. Reagents were introduced to the reflector surface offline via three polydimethylsiloxane (PDMS) flow channels that were 30 μm high, 100 μm wide, and extended 10 mm. PDMS channel fabrication has been described previously [30]. The PDMS block and the reflector surface, when treated with oxygen plasma, formed a watertight seal that could be easily removed later for detection without leaving residue.
Solutions were delivered to the surface in three channels (#1, #2, and #3) via a syringe that pumped fluid at a rate of 10 μl/min through each channel. Phosphate buffer saline (PBS) was first flushed through each channel by pumping for 2 min to load the solution in the channel, and then, pumping for an additional 30 s to thoroughly flush the channel with at least 20 times its own volume. The BSA solution (Sigma, 1 mg/ml in PBS) was similarly introduced to each channel. The BSA used for channel #2 had been conjugated with biotin (BSA-biotin, Sigma, 1 mg/ml biotinamidocaproyl labeled bovine albumin in PBS). The three channels were flushed again with PBS. Avidin (Sigma, from egg white, 1 mg/ml in PBS) was then similarly introduced to channel #2 and channel #3, while channel #1 received a pure PBS solution. The three channels were again flushed with PBS. The sample was next placed in a 100-mm Petri dish with PBS and the PDMS block was removed by applying gentle torsion. The sample was washed on a shaker first in fresh PBS for 30 min and then twice in deionized water for 5 min. The sample was dried briefly with argon before being imaged with the RCIB setup. The apparent height of each channel was recorded by averaging over the measured channel area, which was 100 μm × 1500 μm, and comparing the average value to the signal from an equal area in the adjacent background region.
D. Results With Avidin
The success of any surface-based molecule sensing assay is influenced by a number of critical factors including surface activation, the fluidics system through which targets find their fixed counterparts, incubation conditions such as temperature and pH, and, importantly, the dissociation constant for the interaction being detected [2], [3], [31]. We note that the use of a SiO2 surface provides compatibility of the present technique with most microarray chemistries and incubation procedures. In an effort to decouple the present demonstration from the limitations of surface activation and mass transport, the assay was kept simple and the target concentrations were chosen sufficiently high.
BSA exhibits strong affinity for SiO2 surfaces, a property commonly exploited for blocking glass surfaces [32]. In the present test, the BSA was adsorbed to the SiO2 surface in each channel region and served as the fixed capturing agent. The BSA in the center channel (#2) had been conjugated with biotin for capturing avidin, whereas the BSA not conjugated (channels #1 and #3) is expected to have little affinity for avidin. While there are at least a few biotins conjugated to each BSA molecule, the 244 Da molecular weight of each adds negligibly to 65 kDa BSA molecule, such that the capturing agents have similar mass in each channel. Since avidin is of similar mass (65 kDa) to the BSA-biotin, and since steric hindrance is expected to limit binding to a 1:1 ratio, an approximately doubled signal is expected for the complex formed in channel #2.
The signals observed after washing for channel #1, #2, and #3 were 3.4, 12.2, and 4.9 nm, respectively, and correspond to the case of BSA alone, BSA-biotin with avidin, and BSA with nonspecific avidin (see Fig. 7). The results clearly indicate that channel #2 specifically captured avidin as compared to channel #3. These values are slightly higher than those reported elsewhere, which may be the result of aggregate binding, a greater than 1:1 binding ratio, or nonspecific binding in different channels [20], [33].
Fig. 7.
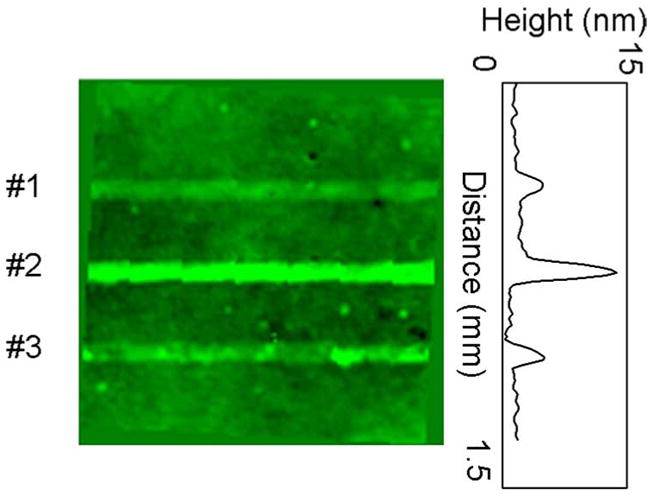
RCIB result for avidin binding. Intensity indicates apparent height in the 1.5 mm × 1.5 mm area shown. The bright horizontal lines indicate molecules bound on the surface in each of the three channel regions designated by the numbers on the left side of the image. Avidin was introduced to channel #2 and channel #3. The signal was strongest from channel #2 (12.2 nm) where the avidin was expected to form a complex with the BSA-biotin on the surface. Channel #3 was lower (4.9 nm) since the BSA not conjugated with biotin did not specifically bind the avidin introduced. The signal in channel #1 with BSA alone was lowest (3.4 nm).
Based on the calculations in Section III and the results with etched features, the minimum detectable surface concentration is projected to be 300 pg/mm2 limited by surface roughness. However, if alignment could be maintained such that before and after measurements could remove the surface roughness contribution, calculations in Section III and the tests with etched features indicate concentrations on the order of 50 pg/mm2 may be detectable. The results demonstrate the ability of the sensing technique to detect protein mass bound specifically to a region of the surface.
V. Conclusion
We have demonstrated the use of a Fabry–Perot optical resonant cavity for detecting protein binding label-free from numerous locations simultaneously. The tests with etched features confirmed the noise approximations and indicated that the height of features could be measured with 50 pm precision (~50 pg/mm2 for protein) when alignment was maintained and 300 pm precision (~300 pg/mm2 for protein) when alignment was not maintained.
A particular advantage of the present technique is the ability to readily scale the number of spots evaluated in parallel afforded by the use of a tunable laser and a digital camera. Though in the demonstration with etched features, only 25 regions of interest were defined, and in the demonstration with avidin, only three regions of interest were defined, the 128 × 128 pixels on the current camera can be used to collect independent data from thousands of binding locations simultaneously. It is noted that if the present technique were to be adapted to the visible spectrum, high pixel density cameras visible cameras would offer an even greater number of parallel detection spots. The present setup is inexpensive to operate and relatively inexpensive and simple to construct. The commercially available tunable laser and camera are the most expensive elements of the setup and continue to decrease in cost with technology advancements. Most importantly, the currently used Bragg reflectors based on mature Si processing technology can be made inexpensive enough for cost-effective one-time use.
Acknowledgments
This work was supported in part by the National Institute of General and Medical Sciences under Grant NIH R21 GM 074872-02, in part by the U.S. Army Research Laboratory under Grant DAAD17-99-2-0070, and in part by the Boston University Office of Technology Development. The views and conclusions contained in this document are those of the authors and should not be interpreted as representing the U.S. Army Research Laboratory or the U.S. Government.
Biographies
David A. Bergstein was born in Allentown, PA, in 1975. He received the Bachelors degree in electrical engineering from the University of Delaware, Newark, in 1999, and the M.S. and Ph.D. degrees in electrical engineering from Boston University, Boston, MA, in 2002 and 2007, respectively.
He was with the Lutron Electronics, Coopersburg, PA, and later, with the Optical Characterization and Nanophotonics Laboratory, Boston University, where he is currently a Postoctoral Fellow. His current research interests include biomedical optics, biological sensing and imaging systems, and molecular binding assays.
Emre Özkumur (S’07) was born in Uşak, Turkey, in 1982. He received the B.S. degree in electrical and electronics engineering and the second B.S. degree in physics from Koç University, İstanbul, Turkey, in 2004. He is currently working toward the Ph.D. degree in electrical engineering from the College of Engineering, Boston University, Boston, MA.
His current research interests include manipulation and optical detection of biomolecules, interferometric sensing and imaging, and high-throughput detection system.
Mr. Özkumur is a member of IEEE Lasers and Electro-Optics Society (LEOS).
Arthur C. Wu (M’06) was born in East Patchogue, NY, in 1982. He received the B.S. degree in electrical engineering with a minor in biomedical engineering from the University of Illinois at Urbana-Champaign, Urbana-Champaign, in 2004, and the M.S. degree in biomedical engineering from Boston University, Boston, MA, in 2007.
His current research interests include medical devices, bioMems, and biological sensing.
Ayça Yalçin (S’04) was born in Istanbul, Turkey, in 1982. She received the B.S. degree in electrical and electronics engineering from Bilkent University, Ankara, Turkey, in 2003, and the M.S. degree in 2005 in photonics from Boston University, Boston, MA, where she is currently working toward the Ph.D. degree in electrical and computer engineering.
Ms. Yalçin is a member of the IEEE Lasers and Electro-Optics Society (LEOS) and the American Physical Society (APS).
Jeremy R. Colson received the B.A. degree in mathematics and the M.S. degree in electrical engineering from Boston University, Boston, MA, in 2000 and 2007, respectively.
He was with the Boston University Optical Characterization and Nanophotonics Laboratory as a Research Assistant in microarray fabrication and biosensing. He is currently a Signal Delivery Engineer at Teradyne, Inc., Reading, MA.
James W. Needham was born in Ellsworth AFB, SD, in 1980. He received the B.S. degree in physics from the University of Memphis, Memphis, TN. He is currently working toward the Ph.D. degree in biomedical engineering at the College of Engineering, Boston University, Boston, MA.
He was a Pre-Intramural Research Training Award (IRTA) Postbaccalaureate Fellow at the Center for Biologics Evaluation and Research, U.S. Food and Drug Administration.
Rostem J. Irani was born in Mumbai, India, in 1972. He received the B.S. degree in biochemistry from Louisiana State University, Baton Rouge, in 1995, and the Ph.D. degree in chemistry from Wayne State University, Detroit, MI, in 2001.
He is currently a Research Assistant Professor at the Center for Advanced Genomic Technology, Boston University, Boston, MA. His current research interests include DNA microarray fabrication and study of DNA-protein interactions.
Jonathan M. Gershoni was born in Haifa, Israel, in 1950. He received the B.Sc. degree in biology and the Ph.D. degree in biochemistry from the Hebrew University of Jerusalem, Jerusalem, Israel, in 1975 and 1980, respectively.
He was with Yale School of Medicine, New Haven, CT, as a Postdoctoral Fellow, and later, with the Department of Biophysics, Weizmann Institute of Science, Rehovot, Israel. During 1988, he was engaged in research on virus receptor interactions and HIV at the Laboratory of Tumor Cell Biology, National Cancer Institute, National Institutes of Health (NIH), Bethesda, MD. During 2006–2007, he was with Boston University, Boston, MA, as part of a sabbatical collaborating on the development of novel biophotonic devices. Since 1990, he has been with the Department of Cell Research and Immunology, Tel Aviv University, Tel Aviv, Israel. His current research interests include the molecular mechanisms of the immune response toward virus infections such as the human immunodeficiency virus (HIV), the Hepatitis C virus (HCV), and the severe acute respiratory syndrome (SARS).
Bennett B. Goldberg was born in Boston, MA, in 1959. He received the B.A. degree from Harvard College, Cambridge, MA, in 1982, and the M.S. and Ph.D. degrees in physics from Brown University, Providence, RI, in 1984 and 1987, respectively.
He was a Postdoctoral Fellow at the Massachusetts Institute of Technology, Cambridge, and the Francis Bitter National Magnet Laboratory. Since 1989, he has been with Boston University, Boston, as a Professor of Physics, and is currently the Chair of the Department of Physics, a Professor of Electrical and Computer Engineering, and a Professor of Biomedical Engineering. He was engaged in research on near-field imaging of photonic bandgap, ring microcavity, and single-mode waveguide devices, and has, recently, developed subsurface solid immersion microscopy for Si inspection. He is also the Director of the Center for Nanoscience and Nanobiotechnology, Boston University. His current research interests include ultrahigh resolution microscopy, spectroscopy techniques for hard and soft material systems, subcellular imaging with interferometric fluorescenent techniques, biosensor fabrication, and waveguide evanescent bioimaging techniques.
Prof. Goldberg is a member of the American Physical Society, the Materials Research Society (MRS), and the IEEE Lasers and Electro-Optics Society (LEOS).
Charles DeLisi received the B.A. degree in physics from City College of New York, in 1963 and the Ph.D. degree in physics from New York University, in 1969.
During 1990–2000, he was the Arthur GB Metcalf Professor of Science and Engineering and the Dean of the College of Engineering, Boston University, Boston, MA. He was a Professor and the Chair of Biomathematical Sciences and a Professor of Molecular Biology at the Mount Sinai Medical School from 1987 to 1999, the Director of the Department of Energy’s Health and Environmental Research Programs from 1985 to 1987, the Section Chief at the National Institutes of Health (NIH) from 1975 to 1985, and a Theoretical Division Staff Scientist at Los Alamos National Laboratory from 1972 to 1975. During 1999, heinitiated the Boston University Graduate Program in Bioinformatics. He was with some 18 industrial, federal, and university advisory boards. He is the author or coauthor of more than 250 papers. He is the holder of eight patents.
Dr. DeLisi is the Fellow of the American Association for the Advancement of Science (AAAS) and the American Institute of Medical and Biological Engineers. He was the recipient of the Smithsonian Platinum Technology Laureate for Pioneering Leadership, the Department of Energy’s Distinguished Associate Award from Secretary Eliot Richardson, and the Presidential Citizens Medal for his role in initiating the Human Genome Project.
Michael F. Ruane (S’68–M’73–SM’96) received the B.E.E. degree from Villanova University, Villanova, PA, in 1969, and the M.S.E.E. and Ph.D. degrees in systems engineering from Massachusetts Institute of Technology, Cambridge, MA, in 1973 and 1980, respectively.
During 1969–1971, he was a Peace Corps Volunteer in Sierra Leone. During 1973–1977, he was a Research Staff Member of Massachusetts Institute of Technology Energy Laboratory in the Electric Power Group. During 1980, he was with Boston University, Boston, MA, as an Assistant Professor. During 1993–1994, he was a Visiting Scientist at the University of Arizona Optical Science Center. He is currently a Professor of Electrical and Computer Engineering (ECE) at the College of Engineering, Boston University, where he is an Associate Chair of ECE for Graduate Studies and Associate Dean ad interim. His current research interests include photonic materials and devices, magnetic materials, and engineering design, education, and outreach.
Dr. Ruane was an Electricity Member on the Massachusetts Energy Siting Council from 1990 to 1993, the Chair of the IEEE Lasers and Electro-Optics Society, Boston Chapter, from 1996 to 1998, and an Education Coordinator for the National Science Foundation (NSF) Engineering Research Center for Subsurface Sensing and Imaging Systems (CenSSIS).
M. Selim Ünlü (M’90–SM’95’F’07) received the B.S. degree from the Middle East Technical University, Ankara, Turkey, in 1986, and the M.S.E.E. and Ph.D. degrees from the University of Illinois, Urbana-Champaign, in 1988 and 1992, respectively, all in electrical engineering.
He is a Professor of Electrical and Computer Engineering, Biomedical Engineering, and Physics at Boston University, Boston, MA. He is currently the Associate Dean for Research and Graduate Programs in Engineering and the Associate Director of the Center for Nanoscience and Nanobiotechnology. Since 1992, he has been with the Department of Electrical and Computer Engineering, College of Engineering, Boston University. His current research interests include nanophotonics and biophotonics, photonic materials, semiconductor optoelectronic devices, high-resolution microscopy and spectroscopy of semiconductor and biological materials, and biological sensing and imaging.
Dr. Ünlü was the recipient of the National Science Foundation Research Initiation Award in 1993, the United Nations TOKTEN Award in 1995 and 1996, the National Science Foundation CAREER Award in 1996, the Office of Naval Research Young Investigator Award in 1996, and the IEEE Lasers and Electro-Optics Society (LEOS) Chapter-of-the-Year Award. He was the Chair of the LEOS, Boston Chapter, from 1994 to 1995. He was also the Chair of the IEEE/LEOS Technical Committee on Photodetectors and Imaging, and is currently the Chair of IEEE/LEOS Nanophotonics Committee. He is an Associate Editor for the IEEE Journal of Quantum Electronics and the Vice-President of LEOS for Membership and Regional Activities—Americas. He was selected as a LEOS Distinguished Lecturer for 2005–2007 and an Australian Research Council Nanotechnology Network (ARCNN) Distinguished Lecturer for 2007.
Footnotes
Color versions of one or more of the figures in this paper are available online at http://ieeexplore.ieee.org.
References
- 1.Zhu H, Bilgin M, Bangham R, Hall D, Casamayor A, Bertone P, Lan N, Jansen R, Bidlingmaier S, Houfek T, Mitchell T, Miller P, Dean RA, Gerstein RAM, Snyder M. Global analysis of protein activities using proteome chips. Science. 2001;293(14):2101–2105. doi: 10.1126/science.1062191. [DOI] [PubMed] [Google Scholar]
- 2.Hardiman G. Microarray technologies—An overview. Pharmacogenomics. 2002;3(3):1–5. doi: 10.1517/14622416.3.3.293. [DOI] [PubMed] [Google Scholar]
- 3.Stears RL, Martinsky T, Schena M. Trends in microarray analysis. Nature Med. 2003 Jan;9(1):140–145. doi: 10.1038/nm0103-140. [DOI] [PubMed] [Google Scholar]
- 4.Liotta LA, Espina V, Mehta AI, Calvert V, Rosenblatt K, Geho D, Munson PJ, Young L, Wulfkuhle J, Petricoin EF. Protein microarrays: Meeting analytical challenges for clinical applications. Cancer Cell. 2003;3:317–325. doi: 10.1016/s1535-6108(03)00086-2. [DOI] [PubMed] [Google Scholar]
- 5.Kandra V, Kariuki JK, Harrison DJ, McDermott MT. Label-free reading of microarray-based immunoassays with surface plasmon resonance imaging. Anal Chem. 2004 Dec;76(24):7257–7262. doi: 10.1021/ac049318q. [DOI] [PubMed] [Google Scholar]
- 6.Mitchell P. A perspective on protein microarrays. Nature Biotechnol. 2002 Mar;20:225–229. doi: 10.1038/nbt0302-225. [DOI] [PubMed] [Google Scholar]
- 7.Spencer M. Fundamentals of Light Microscopy. Cambridge: Cambridge Univ. Press; 1982. [Google Scholar]
- 8.Deck L, de Groot P. High-speed noncontact profile based on scanning white-light interferometry. Appl Opt. 1994 Nov;33(31):7334–7338. doi: 10.1364/AO.33.007334. [DOI] [PubMed] [Google Scholar]
- 9.Sandström T, Stenberg M, Nygren H. Visual detection of organic monomolecular films by interference colors. Appl Opt. 1985 Feb;24(4):472–479. doi: 10.1364/ao.24.000472. [DOI] [PubMed] [Google Scholar]
- 10.Piehler J, Brecht A, Gauglitz G. Affinity detection of low molecular weight analytes. Anal Chem. 1996 Jan;68(1):139–143. doi: 10.1021/ac9504878. [DOI] [PubMed] [Google Scholar]
- 11.Lin VSY, Motesharei K, Dancil KPS, Sailor MJ, Ghadiri MR. A porous silicon-based optical interferometric biosensor. Science. 1997 Oct;278:840–843. doi: 10.1126/science.278.5339.840. [DOI] [PubMed] [Google Scholar]
- 12.Jenison R, Yang S, Haeberli A, Polisky B. Interference-based detection of nucleic acid targets on optically coated silicon. Nature Biotechnol. 2001 Jan;19:62–65. doi: 10.1038/83530. [DOI] [PubMed] [Google Scholar]
- 13.Lin B, Qiu J, Gerstenmeier J, Li P, Pien H, Pepper J, Cunningham B. A label-free optical technique for detecting small molecule interactions. Biosens Bioelecton. 2002;17:827–834. doi: 10.1016/s0956-5663(02)00077-5. [DOI] [PubMed] [Google Scholar]
- 14.Vollmer F, Braun D, Libchaber A. Protein detection by optical shift of a resonant microcavity. Appl Phys Lett. 2002 May;80(21):4057–4059. [Google Scholar]
- 15.Nikitin PI, Valeiko MV, Gorshkov BG. New direct optical biosensors for multi-analyte detection. Sens Actuators B. 2003;90:46–51. [Google Scholar]
- 16.Lu J, Strohsahl CM, Miller BL, Rothberg LJ. Reflective interferometric detection of label-free oligonucleotides. Anal Chem. 2004 Aug;76(15):4416–4420. doi: 10.1021/ac0499165. [DOI] [PubMed] [Google Scholar]
- 17.Varma MM, Nolte DD, Inerowicz HD, Regnier FE. Spinning-disk self-referencing interferometry of antigen-antibody recognition. Opt Lett. 2004 May;29(9):950–952. doi: 10.1364/ol.29.000950. [DOI] [PubMed] [Google Scholar]
- 18.Landry JP, Zhu XD, Gregg JP. Label-free detection of microarrays of biomolecules by oblique-incidence reflectivity difference microscopy. Opt Lett. 2004 Mar;29(6):581–583. doi: 10.1364/ol.29.000581. [DOI] [PubMed] [Google Scholar]
- 19.Baggio R, Carven GJ, Chiulli A, Palmer M, Stern LJ, Arenas JE. Induced fit of an epitope peptide to a monoclonal antibody probed with a novel parallel surface plasmon resonance assay. J Biol Chem. 2005 Feb;280(6):4188–4194. doi: 10.1074/jbc.M410687200. [DOI] [PubMed] [Google Scholar]
- 20.Shumaker-Parry JS, Campbell CT. Quantitative methods for spatially resolved adsorption/desorption measurements in real time by surface plasmon resonance microsopy. Anal Chem. 2004 Feb;76(4):907–917. doi: 10.1021/ac034962a. [DOI] [PubMed] [Google Scholar]
- 21.Juran B, Egan L, Lazaridis K. The AmpliChip CYP450 test: Principles, challenges, and future clinical utility in digestive disease. Clin Gastoenterol Hepatol. 2006 Jul;4(7):822–830. doi: 10.1016/j.cgh.2006.05.002. [DOI] [PubMed] [Google Scholar]
- 22.Sacchetti L, Ferrajolo A, Salerno G, Esposito P, Lofrano MM, Oriani G, Micillo M, Paparo F, Troncone R, Auricchio S, Salvatore F. Diagnostic value of various serum antibodies detected by diverse methods in childhood celiac disease. Clin Chem. 1996;42(11):1838–1842. [PubMed] [Google Scholar]
- 23.Perot A, Fabry C. On the application of interference phenomena to the solution for various problems of spectroscopy and metrology. Astrophys J. 1899;9:87–115. [Google Scholar]
- 24.Ünlü MS, Strite S. Resonant cavity enhanced photonic devices. Appl Phys Rev. 1995;78:607–639. [Google Scholar]
- 25.Yeh P. Optical Waves in Layered Media. New York: Wiley; 1988. [Google Scholar]
- 26.DeFeijter JA, Benjamins J, Veer FA. Ellipsometry as a tool to study the adsorption behavior of synthetic and biopolymers at the air-water interface. Biopolymers. 1978;17:1759–1772. [Google Scholar]
- 27.Schaaf P, Dejardin P, Schmitt A. Reflectometry as a technique to study the adsorption of human fibrinogen at the silica/solution interface. Langmuir. 1987;3(6):1131–1135. [Google Scholar]
- 28.Atherton PD, Reay NK, Ring J, Hicks TR. Tunable Fabry–Perot filters. Opt Eng. 1981 Nov/Dec;20(6):806–814. [Google Scholar]
- 29.Emsley MK, Dosunmu O, Ünlü MS. Silicon substrates with buried distributed Bragg reflectors for resonant cavity-enhanced optoelectronics. IEEE J Sel Topics Quantum Electron. 2002 Jul/Aug;8(4):948–955. [Google Scholar]
- 30.McDonald JC, Whitesides GM. Poly(dimethylsiloxane) as a material for fabricating microfluidic devices. Acc Chem Res. 2002;35(7):491–499. doi: 10.1021/ar010110q. [DOI] [PubMed] [Google Scholar]
- 31.Kusnezow W, Syagailo YV, Rüffer S, Klenin K, Sebald W, Hoheisel JD, Gauer C, Goychuk I. Kinetics of antigen binding to antibody microspots: Strong limitation by mass transport to the surface. Proteomics. 2006;6:794–803. doi: 10.1002/pmic.200500149. [DOI] [PubMed] [Google Scholar]
- 32.Delamarche E, Bernard A, Schmid H, Michel B, Biebuyck H. Patterned delivery of immunoglobulins to surfaces using microfluidic networks. Science. 1997 May;276:779–781. doi: 10.1126/science.276.5313.779. [DOI] [PubMed] [Google Scholar]
- 33.Seitz R, Brings R, Geiger R. Protein adsorption on solid-liquid interfaces monitored by laser-ellipsometry. Appl Surf Sci. 2005;252:154–157. [Google Scholar]