

Abstract
Objectives. We examined changes in meal selection by patrons of university food-service operations when nutrition labels were provided at the point of selection.
Methods. We used a quasi-experimental, single-group, interrupted time-series design to examine daily sales before, during, and after provision of point-of-selection nutrition labels. Piecewise linear regression was employed to examine changes in the average energy content of entrées and a paired t test was used to detect differences in sales across the periods.
Results. The average energy content of entrées purchased by patrons dropped immediately when nutrition labels were made available at point of selection and increased gradually when nutrition information was removed. There was no significant change in number of entrées sold or in revenues between the 2 periods.
Conclusions. Use of nutrition labels reduced the average energy content of entrées purchased without reducing overall sales. These results provide support for strengthening the nutrition labeling policy in food-service operations.
In 1990, the Nutrition Labeling and Education Act (NLEA) mandated food manufacturers to disclose the nutrition content of packaged foods. Increased transparency of nutrition content was intended to allow consumers to make informed decisions to select foods consistent with the Dietary Guidelines for Americans.1,2 Since the act's adoption, individuals who read nutrition labels follow a healthier diet and consume less dietary fat than those who do not read such labels.3,4
Although labeling has had a positive impact on dietary behavior,3,5 labels are not universally available to consumers. For instance, under the NLEA, food-service operations (i.e., restaurants and other facilities that sell food for immediate consumption) are exempted from the requirement to disclose the nutrition content of prepared meals.6 Americans spent $555.7 billion in 2007 on meals prepared away from home—up from $331.8 billion in 1997.7 Increased spending on meals away from home (such as fast food and meals at restaurants, schools, and other public places) affects the nutritional status of Americans. In 1995, Americans obtained more than 30% of their total energy intake from meals away from home, which tend to have higher energy and total fat content than meals prepared at home.8 Public health advocacy groups such as the Center for Sciences in the Public Interest have advocated for nutrition labeling in food-service operations. Many chain food-service operations in the United States responded by disclosing nutrition information on posters, brochures, the Internet, or tray liners.9 This information, however, is rarely provided to consumers at the point of selection, where potentially it could most influence their meal choice.9,10
Policymakers at all levels of government are seeking to address the shortcomings of current labeling policy. The proposed Menu Education and Labeling (MEAL) Act, which was introduced in the US House of Representatives11,12 and most recently in the Senate,13 would amend the Federal Food, Drug and Cosmetic Act to require food-service operations to disclose nutrition information. With reintroduction of the bill in 2008,13 policymakers are facing challenges to protect public health, especially because of likely opposition by the multibillion-dollar restaurant industry. To mitigate potential legal challenges that could suspend the debate over or the implementation of the MEAL Act, Pomeranz and Brownell emphasized the need for careful consideration of labeling laws by policymakers.14
While the MEAL Act is being considered in Congress, cities and states such as New York City, Seattle, and California are taking proactive measures by passing laws requiring food-service operations to disclose nutrition information to customers at the point of selection.15 Such policy movements are discordant with a US Department of Agriculture report that suggests that disclosure of nutrition information at food-service operations would not yield substantial changes in consumer behavior.16 To inform the debate over whether or not such nutrition labeling can be of public benefit, further evidence is needed.
In their review of literature on the availability of nutrition information for all items on the menu at point of selection in cafeterias or restaurants, Harnack and French concurred with the need for more evidence.17 Of the 6 studies identified, 5 reported a modest effect on meal selection by consumers.18–22 The observed results may be attributable to methodological limitations in reviewed studies, which include socially desirable responses and the lack of randomization of participants in a quasi-experimental design.17 We address these limitations and provide evidence supporting the need for policies that mandate disclosure of nutrition information at the point of selection.
We sought to determine whether the display of nutrition information at the point of selection for all entrées available in a food-service operation would alter patrons' meal selection. We present data from a dining center in a large land-grant university that resembled most chain food-service operations. A quasi-experimental design was employed to test the hypotheses that (1) the average energy content of entrées sold per day decreases when nutrition labels are present at the point of selection, (2) entrées with highest energy content have the greatest decrease in sales, and (3) this change can occur without any negative impact on overall sales.
METHODS
The study was conducted between October 25 and December 8, 2004, at Ohio State University, Columbus. At the study dining center, patrons could make independent choices from various options of salads, soups, sandwiches, deli, pizza, and other hot entrées. Although the dining center catered mainly to college students with meal contracts, patrons unaffiliated with the university also ate there. Twelve hot entrées were targeted for this study to capture the majority of patrons' meal choices. The nutritional content for each entrée was calculated with Food Processor Nutrition Analysis software version 7.1 (ESHA Research, Salem, Oregon). The entrée recipes remained unchanged throughout the study.
We employed a quasi-experimental, single-group, interrupted time-series design capturing daily sales data for 3 periods: pretreatment, treatment, and posttreatment.23 During the 14-day pretreatment period, only descriptions of the study entrées developed by the dining center were posted on a menu board measuring 31 inches by 37 inches (height by width). During the 14-day treatment period, entrée descriptions and simplified nutrition labels measuring 5 inches by 3 inches (height and width) were posted at the point of selection. We used a word processor to create simplified nutrition labels that adhered to the same format as that of the Food and Drug Administration's Nutrition Facts Label.24 The labels included the following macronutrient data: total energy, serving size (grams), fat (grams), protein (grams), and carbohydrates (grams). We focused on these macronutrients because prior studies found that college students used this information when selecting meals.25–27 Patrons were guided by a space divider to view the menu board, which was hung approximately 6.5 feet above the ground on the wall to their right. Patrons would then go around the end of the divider to a counter to place their order, and they exited on the opposite side of the divider as they picked up their order. During the 13-day posttreatment period, the menu board was taken down, with descriptions of study entrées left on an 8.5-by-11-inch (width by height) paper on a floor stand for patrons, as was typical practice before the study.
Sales data for the study entrées were collected electronically with a point-of-sales machine for the 41 days of the study. In the posttreatment period, the sales data for the 4 days of Thanksgiving holiday break were not obtained. To examine the trend without interruption, the 13 days of posttreatment data were analyzed, excluding 4 days in the sequence when data were not obtained. The data were stored in a server operated by University Dining Services until the end of the study.
To test the hypothesis that the energy content of entrées sold during the treatment period was different than during the other 2 periods, the average number of kilocalories of entrées sold per day was calculated by aggregating across the 12 hot entrées. Piecewise regression28 was employed to test differences in average daily energy content of entrées purchased by dining center patrons for pretreatment vs treatment period and treatment vs posttreatment period. The following piecewise linear regression equation was used:
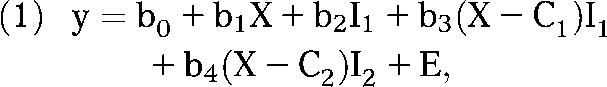 |
where y is energy content, X is number of days elapsed in the study (with 1 being the first day of the pretreatment period), C1 is the last day of the pretreatment period, C2 is the last day of the treatment period, I1 is an indicator variable that equals 0 if in the pretreatment period and 1 otherwise, I2 is an indicator variable that equals 1 if in the posttreatment period and 0 otherwise, the b's are regression coefficients to be estimated, and E is the residual. The regression equation modeled and tested the pretreatment slope (b1), a discontinuity in average energy content (b2) and difference in slope (b3) at C1, and a difference in slope (b4) at C2. The relationship between the energy content of entrées and the differences in overall sales from one period to the next was tested with a linear regression. Paired t tests were used to detect differences in total sales between successive periods. STATA version 10.0 software (StataCorp LP, College Station, Texas) was used to perform the analyses.
RESULTS
The average energy content of entrées sold at the start of the pretreatment period was 646.5 kcal (Figure 1; Table 1). The slope during the pretreatment period was near zero (0.094 kcal/day), meaning that the average energy content of entrées sold did not change in the pretreatment period. The average energy content of entrées sold decreased 12.4 kcal from the last day of pretreatment to the first day of the treatment period (P = .007). A negative slope, small in magnitude, was observed during the treatment period (−0.298 kcal/day). At the beginning of the posttreatment period, the daily average energy content immediately began to increase. Across the posttreatment period, the daily average energy content increased at a rate of 1.512 kcal/day (P = .013).
FIGURE 1.

Average energy content of entrées sold per day in a food-service operation before, during, and after provision of nutrition information at point of selection: Columbus, Ohio, October 25–December 8, 2004.
TABLE 1.
Average Energy Content of Entrées Sold per Day in a Food-Service Operation Before, During, and After Provision of Nutrition Data at Point of Selection, Modeled by Piecewise Regression: Columbus, Ohio, October 25–December 8, 2004
| Parameter | Description | Estimate | P |
| b0 | Level at start of pretreatment, kcal | 646.5 | .001 |
| b1 | Pretreatment slope, kcal/d | 0.094 | .81 |
| b2 | Difference between pretreatment last day and treatment first day, kcal | −12.4 | .007 |
| b3 | Difference in slope pretreatment to treatment, kcal/d | −0.298 | .56 |
| b4 | Difference in slope treatment to posttreatment, kcal/d | 1.512 | .013 |
Note. Adjusted R2 = 51.1%; root mean square error = 5.90 kcal.
In examining the impact of nutrition labels on the sale of the entrées with the highest energy content, we found a significant decrease during the treatment period compared with the pretreatment period (slope = −0.766; P = .007). Furthermore, after the treatment period, the sale of entrées with the highest energy content again increased (slope = 1.541; P = .005) (Table 2). Daily sales data revealed substantial day-to-day variation in the average energy content of entrées sold per day. Most of this variation was attributable to day-of-the-week differences in sales, as can be seen by comparing the plots of pretreatment and treatment daily sales of entrées aligned by day of the week (Figure 2). The difference in sales between the study periods was not significant (Table 2). The revenue per entrée remained consistent for all 3 periods (pretreatment, $4.94 per entrée; treatment, $4.94 per entrée; posttreatment, $4.95 per entrée), meaning that the dining center had no loss of revenue.
TABLE 2.
Entrees Sold to Patrons at Food-Service Operation Before, During, and After Provision of Nutrition Information at Point of Selection: Columbus, Ohio, October 25–December 8, 2004
| Energy Content (kcal) | No. of Entrees Solda |
Difference in No. of Entrees Sold |
% Difference in No. of Entrees Sold |
||||
| Pretreatment | Treatment | Posttreatment | Between Treatment and Pretreatmentb | Between Posttreatment and Treatmentc | Between Treatment and Pretreatment | Between Posttreatment and Treatment | |
| 839 | 3 507 | 3 317 | 3 451 | −190 | 134 | −5.42 | 4.04 |
| 813 | 1 301 | 1 185 | 1 264 | −116 | 79 | −8.92 | 6.67 |
| 784 | 708 | 622 | 596 | −86 | −26 | −12.15 | −4.18 |
| 735 | 324 | 244 | 241 | −80 | −3 | −24.69 | −1.23 |
| 660 | 371 | 344 | 352 | −27 | 8 | −7.28 | 2.33 |
| 577 | 780 | 779 | 671 | −1 | −108 | −0.13 | −13.86 |
| 556 | 2 157 | 2 415 | 2 447 | 258 | 32 | 11.96 | 1.33 |
| 515 | 625 | 695 | 682 | 70 | −13 | 11.20 | −1.87 |
| 492 | 3 518 | 3 807 | 3 746 | 289 | −61 | 8.21 | −1.60 |
| 492 | 219 | 221 | 191 | 2 | −30 | 0.91 | −13.57 |
| 454 | 224 | 245 | 172 | 21 | −73 | 9.38 | −29.80 |
| 412 | 217 | 325 | 207 | 108 | −118 | 49.77 | −36.31 |
| Total | 13 951 | 14 199 | 14 020 | 248 | −179 | 1.78 | −1.26 |
Sales include all patrons who used cash, credit card, meal contracts, and other forms of payments to purchase entrées at the dining center.
Slope from linear regression of difference in sales on energy content = −0.766 (P = .007).
Slope from linear regression of difference in sales on energy content = 1.541 (P = .005).
FIGURE 2.

Number of entrées sold in a food-service operation before and during provision of nutrition data at point of selection, by day of the week: Columbus, Ohio, October 25–December 8, 2004.
DISCUSSION
We observed an immediate drop in the energy content of patrons' entrée selections from the first day of posting nutrition labels for entrées at the dining center; this drop was maintained throughout the treatment period. When nutrition labels were removed, patrons reverted to selecting entrées with higher energy content relatively soon. These changes occurred without negative impact on overall sales and revenue for the dining center.
The time-series, quasi-experimental study design we used had several strengths. First, data were collected daily, covering all days of the week in sequence, thereby allowing observation of day-of-the-week variation and avoiding potential bias due to confounding by day of the week. Second, purchasing behavior was observed daily before, during, and after treatment. Third, past studies of change in total sales to assess the impact of nutrition labels at point of selection focused on differences between 2 categories of entrées: “nonhealthy” and “healthy.”26,29 This categorization can potentially mask the changes in meal selection because, although a patron may choose a lower energy entrée, it might remain categorized as “nonhealthy.” In the current study, use of average energy content of entrée sold allowed us to better examine these changes. Furthermore, obtaining the sales data through point-of-sales machines minimized social desirability bias because a data collector was not present at the study site; other studies have not had this advantage.19,20,22
With the use of time-series, quasi-experimental designs, other events, changes in instrumentation, and selection biases are potential threats to inferences.23 In our study, there were no other dining centers in the campus offering nutrition information, no campus-wide nutrition education promoting the use of nutrition labels was active at the time of the study, and there was no known extraneous event occurring at about same time that could have changed purchasing behavior. Furthermore, the fact that patrons purchased entrées with higher average energy content during the posttreatment period substantially improves confidence that the treatment effect observed was not caused by other events. Instrumentation was not a problem in this study because the university collects day-to-day sales data electronically for financial analyses of their food-service operation. The most important potential selection bias would be if the population of patrons using the dining center was altered during the treatment period as a result of the treatment. During the course of the study, there were no modifications of entrée recipes, no change in numbers of entrées (i.e., sales), and no adverse changes in the environment that would have altered attendance by patrons.
The immediate change in energy content during the treatment period lends support for providing nutrition labels to assist patrons in their selection of entrées. The gradual increase in energy content during the posttreatment period suggests the need for continually providing nutrition labels for patrons' subsequent visits. Continued availability of nutrition information is important because both consumers and health professionals have been reported to underestimate the energy contents of their meals by as much as 600 kcal and 680 kcal, respectively.30,31
This study also has implications for improving the nutrition status of the university population specifically. Supplying nutrition labels at the point of selection allows college students to make informed decisions about food items that could assist in maintaining or achieving positive health status. We also have anecdotal evidence that after the conclusion of the study, the recipe for the entrée with the highest energy content was reformulated to 667 kcal rather than 839 kcal. This change is substantial; in an academic year (i.e., 3 academic quarters), an extra 172 kcal per day can translate to more than 5 kg of excess body weight. In addition, the university dining services, like most food-service operations, contract with food distributors or employ professional chefs or dietitians; therefore, they have the opportunity and the resources to simultaneously improve nutrition and meet patrons' taste preferences without affecting revenue.
In conclusion, the results of this study support strengthening current nutrition labeling policy in food-service operations. Further research to examine the impact and implementation of nutrition information in different settings, such as self-serve and traditional sit-down food-service operations, would be valuable.
Human Participant Protection
This study was approved by The Ohio State University Behavioral and Social Sciences institutional review board.
References
- 1.US Dept of Agriculture, US Dept of Health and Human Services Nutrition and your health: dietary guidelines for Americans, 2005. 5th ed.Available at: http://www.health.gov/dietaryguidelines/dga2005/document/pdf/DGA2005.pdf. Accessed April 22, 2009
- 2.Nightingale S. New food label to enhance healthful diets. JAMA 1993;269(8):974. [DOI] [PubMed] [Google Scholar]
- 3.Kreuter M, Brennan LK, Scharff DP, Lukwago SN. Do nutrition label readers eat healthier diets? Behavioral correlates of adults' use of food labels. Am J Prev Med 1997;13(4):277–283 [PubMed] [Google Scholar]
- 4.Neuhouser M, Kristal A, Patterson R. Use of food nutrition labels is associated with lower fat intake. J Am Diet Assoc 1999;99:45–50 [DOI] [PubMed] [Google Scholar]
- 5.Perez-Escamilla R, Haldeman L. Food labeling use modifies association of income with dietary quality. J Nutr 2002;132(4):768–772 [DOI] [PubMed] [Google Scholar]
- 6. Nutrition Labeling and Education Act, Pub L No. 101-535 (1990). Amendment of Section 403 of the Federal Food, Drug and Cosmetic Act, 21 USC 343(1938)
- 7.US Dept of Agriculture, Economic Research Services Food CPI, prices and expenditures: food away from home. Available at: http://www.ers.usda.gov/Briefing/CPIFoodAndExpenditures/Data/table3.htm. Accessed September 23, 2008
- 8.Lin B, Guthrie J, Frazao E. Nutrient contribution of food away from home. Frazao E, ed.America's Eating Habits: Changes and Consequences. Washington, DC: US Dept of Agriculture; 1999:213–242 [Google Scholar]
- 9.Wootan M, Osborn M, Malloy C. Availability of point-of-purchase nutrition information at a fast-food restaurant. Prev Med 2006;43:458–459 [DOI] [PubMed] [Google Scholar]
- 10.Conklin M, Lambert C, Cranage D. Nutrition information at point of selection could benefit college students. Top Clin Nurs 2005;20(2):90–96 [Google Scholar]
- 11. Text of H. R. 3895 [110th]: MEAL Act. 2007. Available at: http://www.govtrack.us/congress/billtext.xpd?bill=h110-3895. Accessed September 10, 2008.
- 12. H. R. 3444: Menu Education and Labeling Act. 2003. Available at: http://www.govtrack.us/congress/bill.xpd?bill=h108-3444. Accessed September 28, 2008.
- 13. S. 2784: MEAL Act. 2008. Available at: http://www.govtrack.us/congress/bill.xpd?bill=s110-2784. Accessed September 28, 2008.
- 14.Pomeranz JL, Brownell KD. Legal and public health considerations affecting the success, reach, and impact of menu-labeling laws. Am J Public Health 2008;98(9):1578–1583 [DOI] [PMC free article] [PubMed] [Google Scholar]
- 15.Center for Science in the Public Interest Nutrition labeling in chain restaurants: state and local bills/regulations—2007–2008. 2008. Available at: http://www.cspinet.org/nutritionpolicy/MenuLabelingBills2007-2008.pdf. Accessed April 22, 2009
- 16.Variyam JN. Nutrition Labeling in the Food-Away-From-Home Sector: An Economic Assessment. Washington, DC: Economic Research Service, US Dept of Agriculture; 2005. Economic Research Report No. 4. Available at: http://www.ers.usda.gov/publications/ERR4. Accessed April 22, 2009 [Google Scholar]
- 17.Harnack L, French S. Effect of point-of-purchase calorie labeling on restaurant and cafeteria food choices: a review of the literature. Int J Behav Nutr Phys Act 2008;5(1):51–56 [DOI] [PMC free article] [PubMed] [Google Scholar]
- 18.Balfour D, Moody R, Wise A, Brown K. Food choice in response to computer-generated nutrition information provided about meal selection in workplace restaurants. J Hum Nutr Diet 1996;9:231–237 [Google Scholar]
- 19.Cinciripini P. Changing food selection in a public cafeteria: an applied behavior analysis. Behav Modif 1984;8:520–539 [Google Scholar]
- 20.Milich R, Anderson J, Mills M. Effects of visual presentation of caloric values on food buying by normal and obese persons. Percept Mot Skills 1976;42(1):155–162 [DOI] [PubMed] [Google Scholar]
- 21.Yamamoto JA, Yamamoto JB, Yamamoto BE, Yamamoto LG. Adolescent fast food and restaurant ordering behavior with and without calorie and fat content menu information. J Adolesc Health 2005;37(5):397–402 [DOI] [PubMed] [Google Scholar]
- 22.Mayer J, Brown T, Heins J, Bishop D. A multi-component intervention for modifying food selection in a worksite cafeteria. J Nutr Educ 1987;19:277–280 [Google Scholar]
- 23.Campbell D, Stanley J. Experimental and Quasi-Experimental Designs for Research. Chicago, IL: Rand McNally and Co; 1963 [Google Scholar]
- 24.Food and Drug Administration How to understand and use the nutrition facts label. Available at: http://www.cfsan.fda.gov/∼dms/foodlab.html#twoparts. Accessed September 9, 2008
- 25.Conklin M, Cranage D, Lambert C. College students' use of point of selection nutrition information. Top Clin Nurs 2005;20(2):97–108 [Google Scholar]
- 26.Cranage D, Conklin MT, Lambert CU. Effect of nutrition information in perceptions of food quality, consumption behavior and purchase intentions. J Foodserv Bus Res 2004;7(1):43–61 [Google Scholar]
- 27.Smith S, Taylor J, Stephen A. Use of food labels and beliefs about diet—disease relationships among university students. Public Health Nutr 2000;3(2):175–182 [DOI] [PubMed] [Google Scholar]
- 28.McGee V, Carleton W. Piecewise regression. J Am Stat Assoc 1970;65(331):1109–1124 [Google Scholar]
- 29.Sproul A, Canter D, Schmidt J. Does point-of-purchase nutrition labeling influence meal selections? A test in an army cafeteria. Mil Med 2003;168(7):556–560 [PubMed] [Google Scholar]
- 30.Burton S, Creyer EH, Kees J, Huggins K. Attacking the obesity epidemic: the potential health benefits of providing nutrition information in restaurants. Am J Public Health 2006;96(9):1669–1675 [DOI] [PMC free article] [PubMed] [Google Scholar]
- 31.Backstrand J, Wootan MG, Young LR, Hurley J. Fat Chance Washington, DC: Center for Science in the Public Interest; 1997 [Google Scholar]