

Abstract
Very fast oscillations (VFO, >75 Hz) occur transiently in vivo, in the cerebellum of mice genetically modified to model Angelman syndrome, and in a mouse model of fetal alcohol syndrome. We recently reported VFO in slices of mouse cerebellar cortex (Crus I and II of ansiform and paramedian lobules), either in association with gamma oscillations (~40 Hz, evoked by nicotine), or in isolation (evoked by nicotine in combination with GABAA receptor blockade). The experimental data suggest a role for electrical coupling between Purkinje cells (blockade of VFO by drugs reducing gap junction conductance, and spikelets in some Purkinje cells); and the data suggest the specific involvement of Purkinje cell axons (because of field oscillation maxima in the granular layer). We show here that a detailed network model (1,000 multicompartment Purkinje cells) replicates the experimental data, when gap junctions are located on the proximal axons of Purkinje cells, provided sufficient spontaneous firing is present. Unlike other VFO models, most somatic spikelets do not correspond to axonal spikes in the parent axon, but reflect spikes in electrically coupled axons. The model predicts gating of VFO frequency by gNa inactivation, and experiments prolonging this inactivation time constant, with β-pompilidotoxin, are consistent with this prediction. The model also predicts that cerebellar VFO can be explained as an electrically coupled system of axons which are not intrinsic oscillators: the electrically uncoupled cells do not individually oscillate (in the model), and axonal firing rates are much lower in the uncoupled state than in the coupled state.
Keywords: gap junction, network model, cerebellar cortex
Introduction
We have described several types of fast oscillations (~30 Hz to over 150 Hz) that can be induced in somatosensory portions of mouse cerebellum in vitro, induced by activation of nicotinic receptors (sometimes with the added block of GABAA receptors), or by low [Ca2+] media (Middleton et al., 2008). The in vitro oscillations could be relevant to cerebellar fast oscillations in vivo, during putatively physiological states (Courtemanche & Lamarre, 2005), and pathological states (Cheron et al., 2004, 2005a,b; Servais et al., 2005, 2007; Servais & Cheron, 2005). All the cerebellar fast oscillations studied in vitro are suppressed by gap junction blockers (Middleton et al., 2008); additionally, >100 Hz cerebellar oscillations in vivo are also suppressed by carbenoxolone (Cheron et al., 2005; Servais et al., 2005). Evidently, electrical coupling is critical for cerebellar fast oscillations, as it is for fast oscillations investigated in hippocampus, entorhinal cortex and neocortex (Pais et al., 2003; Cunningham et al., 2004a,b; Roopun et al., 2006; Draguhn et al., 1998; Nimmrich et al., 2005). In the latter cortical fast oscillations, it is electrical coupling between principal neurons that appears to be critical, and a variety of data indicate that the most important site for this coupling lies on axons, (Traub et al., 2003a,b; Roopun et al., 2006; Schmitz et al., 2001; Hamzei-Sichani et al., 2007).
Here, we focus on one particular type of in vitro cerebellar fast oscillation, that occurring at frequencies of ~100–150 Hz, in the presence of nicotine during blockade of GABAA receptors. We refer to it as cerebellar VFO (very fast oscillation). In addition to requiring electrical coupling via gap junctions, cerebellar VFO occurs independently of ionotropic glutamate receptors. Cerebellar VFO fields and optical signals have maximal amplitude in the granular layer, where the proximal unmyelinated axons of Purkinje cells lie; and cerebellar VFO is evident in Purkinje cell intracellular recordings (Middleton et al., 2008), some of which show runs of spikelets (fast prepotentials).
The data suggest that cerebellar VFO might be induced by electrical coupling between Purkinje cell axons, in a manner analogous to that proposed for 200 Hz ripples induced in hippocampal slices by low [Ca2+] media (Draguhn et al., 1998; Traub et al., 1999; reviewed in Traub et al., 2002). The latter model was based on several assumptions: 1) principal cell axons were electrically coupled to one another in a sparse network; 2) the gap junctions allowed an action potential in one axon to induce an action potential in a coupled axon, after a brief latency; 3) axons had strong but brief refractoriness; 4) there was a background of rare spontaneous action potentials. A “percolation” model like this could generate very fast oscillations, with spikelets (Traub et al., 1999).
Here, we describe a network model of cerebellar VFO, using 1,000 multicompartment Purkinje cells, coupled via gap junctions on their proximal axons. This model generates field oscillations and intracellular potentials resembling experimental data. The physical principles are, however, somewhat different than in the percolation model.
Materials and Methods
In vitro mouse cerebellar slice experiments
Slice preparation
Coronal sections, 400 µm thick, of cerebellum containing crus 1 and 2 of the ansiform and para-median lobules, were prepared from adult male C57b6 mice. All procedures conformed to the UK Home Office Animals (Scientific Procedures) Act 1986. Slices were maintained at the interface between artificial cerebrospinal fluid (aCSF) containing [in mM]: NaCl, 126; KCl, 3; NaH2PO4, 1.25; CaCl2, 2; MgSO4, 1; NaHCO3, 24; glucose, 10, and warmed, wetted 95% O2/5% CO2 at 35°C. The rhythmogenic compound nicotine (10 µM) was bath applied with gabazine (2 µM) to generate a VFO. β-pompilidotoxin (10 µM) was subsequently applied following stabilization of VFO area power (80 – 400 Hz). All drugs were obtained from Tocris (UK).
Electrophysiology
Field potential recordings were obtained from the Purkinje cell layer using glass micropipettes (0.5 – 2 MΩ) filled with aCSF. Data were broadband filtered at 1 Hz – 20 kHz to assess both local field potential and multiunit activity. Multiunit activity was found to be highly locally synchronous, generating population spiking that was evident with more narrow low pass filtering below 400 Hz. To optimize signal/noise ratios, data are therefore presented band-pass filtered in the range 1–400 Hz. Intracellular recordings (0 – 10 kHz) from Purkinje cells were obtained using glass pipettes (50 – 90 MΩ) filled with 2M potassium methylsulfate. Power spectra were constructed using Axograph software and statistical analysis performed using paired t-tests, with significance set at p<0.05.
Purkinje cell spikelet homogeneity was quantified in somatic sharp electrode recordings, using the spike sorting tool ‘Wave_clus’ (Quian Quiroga et al., 2004). Thresholds were set to exclude all full action potentials, but to include >95% of spikelets detectable ‘by eye’. Spikelets were identified automatically by a series of wavelet coefficients that best described the spikelet shape. Wavelet coefficients were fed into a clustering algorithm to quantify automatically the degree of similarity of spikelet shapes across the entire detected spikelet population – with the most similar spikelet shapes automatically grouped together into separate populations (clusters). Parameters for this automatic clustering algorithm were set to optimize the ability to detect different populations of spikelets if present: minimum cluster size was set to 2% of total spikelets detected. Temperature, as an equivalent of spikelet covariance (affecting the likelihood of any set of different spikelets being assigned to the same cluster), was set to give at least 2 clusters in each dataset. From this, homogeneity was quantified as the proportion of spikelets in the largest cluster with respect to total spikelets detected. In other words: what proportion of the total spikelet shapes detected were statistically “the same”? This method was also applied to simulation data.
Simulations
The building block of the network simulations was a 559-compartment model of a single Purkinje cell (see Appendix). This model had a 6-compartment 60 µm segment of unmyelinated axon, a soma, dendritic shaft, and smooth and spiny dendritic regions. [This axon is somewhat longer than reported for the rat Purkinje cell axon initial segment (Clark et al., 2005), but the gap junctions are restricted (see below) to the proximal 30 µm. The axon was extended a bit for the sake of numerical stability.] The model contained 12 active conductances, including fast (transient) and persistent gNa, 6 types of gK, 3 types of gCa, and an anomolous rectifier. This model included a full range of conductances, so that it would be available for a variety of applications. In the present simulations (except in the Appendix), however, Ca2+ and Ca2+-dependent conductances were shut off, as were the anomolous rectifier, and the “D” type of slowly inactivating K+ current; this was done for the sake of simplification. [Removing Ca2+ and Ca2+-dependent conductances is reasonable as a first approximation, as cerebellar VFO can occur in low [Ca2+] media.]
For network simulations, we took 1,000 copies of the single Purkinje cell model, and introduced gap junctions between pairs of cells, randomly assigned (Erdös & Rényi, 1960) at pre-selected compartments on the model neurons. To construct the network, the total number of gap junctions to be used was first set, as a parameter; and allowable compartments for gap junctions were specified. Pseudo-random pairs of cells were then chosen, one by one, as well as pseudo-random choices for the sites of each gap junction on each cell: these data were stored in a table (we call the choices “pseudo-random” because a pseudo-random number generator is used by the program). There were no chemical synapses. In preliminary simulations, gap junctions could occur between dendritic sites, between somata, or between axons, in various combinations. We found that gap junctions between somatic and dendritic sites did not contribute to collective population oscillations (because coupling potentials were so small), and therefore the data we describe here derive only from simulations in which gap junctions were restricted to axons. For the data to be illustrated, we used simulations in which gap junctions were restricted to the proximal 3 axonal compartments (30 µm of unmyelinated axon), at a density of 5 gap junctions lying on each axon (on average), and with gap junction conductance = 6 nS. [If the gap junctions were to contain connexin36 (Hamzei-Sichani et al., 2007), with unitary conductance about 10 – 15 pS (Srinivas et al., 1999), this parameter choice corresponds to using 400 – 600 connexons per gap junction. 400 – 600 connexons is a plausible estimate, because Hamzei-Sichani et al. found about 100 connexons in a single small gap junction plaque, and found that 5 small plaques could be arranged in a row with mean spacing of 115 nm.] With a gap junction conductance of 6 nS, we never observed a case where a single axonal spike in one axon would induce a spike in an electrically coupled axon, even when gap junctions were located in the most distal axonal compartment; for this reason, the present network model can not exhibit percolation (Traub et al., 1999), and alternative VFO mechanisms needed to be sought. It is, of course, conceivable, that a single axonal spike might induce an axonal spike in a coupled neuron, in a case where electrical coupling occurs between nodes of Ranvier (Yasargil & Sandri, 1987), but this possibility was not investigated in the present model.
The random gap junctional connectivity introduces heterogeneity into the system, but additional heterogeneity was added by using randomly distributed somatic bias currents of 0.35 to 0.45 nA. A few of the neurons had somatic hyperpolarizations of −0.25 nA, to lower full-spike firing rates and to help unmask spikelets (although spikelets occurred as well in cells that were not hyperpolarized); spikelets in turn could be compared with experimental spikelets, and were an indicator of axonal firing. Axons were slightly depolarized (0.04 nA to each axonal compartment) in order to raise their excitability and spontaneous activity, as is likely to occur in nicotine (Kawai et al., 2007), or in low-calcium media.
An additional source of heterogeneity occurred in the form of ectopic axonal spikes, generated by a Poisson process that injected current pulses (0.45 nA, 0.8 ms) into the distal axon, at mean rates of 13.33 to 40 Hz per axon. Again, the ectopic spikes are presumed to reflect increased axonal excitability caused by nicotine (Kawai et al., 2007) or low-calcium media – although a direct origin of ectopic spikes in axons remains to be shown experimentally. In previous models of axonal plexus very fast oscillations (e.g. Traub et al., 1999), it was possible to use ectopic rates as low as 0.05 Hz per axon, but that was in cases in which action potentials could propagate directly from axon to axon. In the present model, such propagation does not occur (i.e. a spike in a single axon would not induce a spike in a single coupled axon), so that much higher spontaneous activity rates were necessary for population oscillations to occur.
The “field” produced by a given simulation was estimated, either by averaging all of the somatic potentials, or all of the potentials at a fixed mid-axonal site; these averages were then inverted, so as to resemble the experimentally recorded fields. Somatic and axonal “fields” had similar shapes, with the axonal “field” shifted about 5 mV, reflecting a net mean depolarization of axons relative to somata.
Code was written in Fortran, augmented with mpi to run in a parallel environment, using a variation of the code reported in Traub et al. (2005). Programs were run on 50 central processing units (cpu’s) of an IBM 1350 Linux cluster. A 175 ms simulation lasted about 21.5 hours.
Copies of the original code can be obtained by writing to roger.traub@downstate.edu or rtraub@us.ibm.com. In addition, source Fortran code (for a single Purkinje cell and for the 1,000 cell network) is available at the ModelDB website at Yale University, URL = http://senselab.med.yale.edu/modeldb/ShowModel.asp?model=114654.
Results
The network model generates very fast network oscillations, when axons are electrically coupled
We first note that experimental field potential recordings from mouse cerebellar slices, bathed in nicotine to induce gamma oscillations (~40 Hz), will subsequently generate VFO upon further blockade of GABAA receptors with gabazine (~100 Hz) (Middleton et al., 2008). Data such as this, together with the insensitivity of experimental cerebellar VFO to blockade of AMPA, NMDA and GABAB receptors, and the sensitivity to carbenoxolone and other gap junction blockers (Middleton et al., 2008) – all render plausible our assumption that it is solely electrical coupling that brings about the very fast network oscillation. In accord with this notion, Fig. 1 illustrates an example of network oscillations produced by the 1,000-cell Purkinje cell model, with gap junctions between proximal axonal sites (5 per axon on average, conductance 6 nS, ec-topic rate = 13.3 Hz on average per axon). Oscillation amplitude decreased, or the oscillation would slow or even disappear, on using 1) fewer axonal coupling sites (with no oscillation at all when using 2.5 gap junctions per axon on average, and only an initial and transient oscillation, <100 ms, with 4 gap junctions per axon – the transience resulting because the neurons begin somewhat more depolarized than in the steady state, as the bias currents come into play); 2) a smaller gap junction conductance (frequency 80 Hz with 5.5 nS conductance, and no oscillation with 5.0 nS conductance), and lower ectopic rates (so that, for example, ectopics at 4 Hz produced a slowing attenuating oscillation over ~100 ms that then disappeared – again, the transience occurred because of an initial relative depolarization). As will be seen below, increasing the ectopic spike rate increased the population frequency. The detailed mechanisms by which the network oscillation is actually generated will be clarified in subsequent figures.
Fig. 1. Very fast oscillations (VFO) in network model.

Data from a simulation with 1,000 model Purkinje neurons, with gap junctions located on the proximal axons, average 5 gap junctions per cell. The power spectrum (peak at ~100 Hz) is shown above; the “field” consists of the inverted average of all somatic potentials in the population. (The “axonal field”, not shown, has a similar shape to the somatic field, but is shifted ~5 mV, reflecting a relative mean depolarization of the axons.) For comparable experimental field data, in nicotine + gabazine, see Middleton et al. (2008).
The network model generates barrages of variable amplitude spikelets, as can be observed experimentally
Fig. 2A demonstrates an example of the variable-amplitude spikelets that can occur in Purkinje cells during VFO induced by nicotine and gabazine (spikelets of similar appearance have also been recorded in cerebellar Purkinje cells in vivo (S.J. Middleton & T. Knöpfel, unpublished data)); the figure shows as well the appearance of similar potentials in a model Purkinje cell (hyperpolarized with −0.25 nA somatic current injection, to partially suppress full somatic spikes), during the simulated network oscillation. Of special note are the spikelets (*) that occasionally occur just prior to a full action potential, both in experiment and model. Patterns of polymorphic spikelets, similar to those in the “model” part of Fig. 2A, were observed in all 7 of the other hyperpolarized Purkinje cells from this simulation. Spikelets also occurred in model Purkinje cells that were not hyperpolarized, although admixed with more full action potentials (not shown).
Fig. 2. VFO-associated spikelets in a mouse Purkinje cell and a model Purkinje cell.
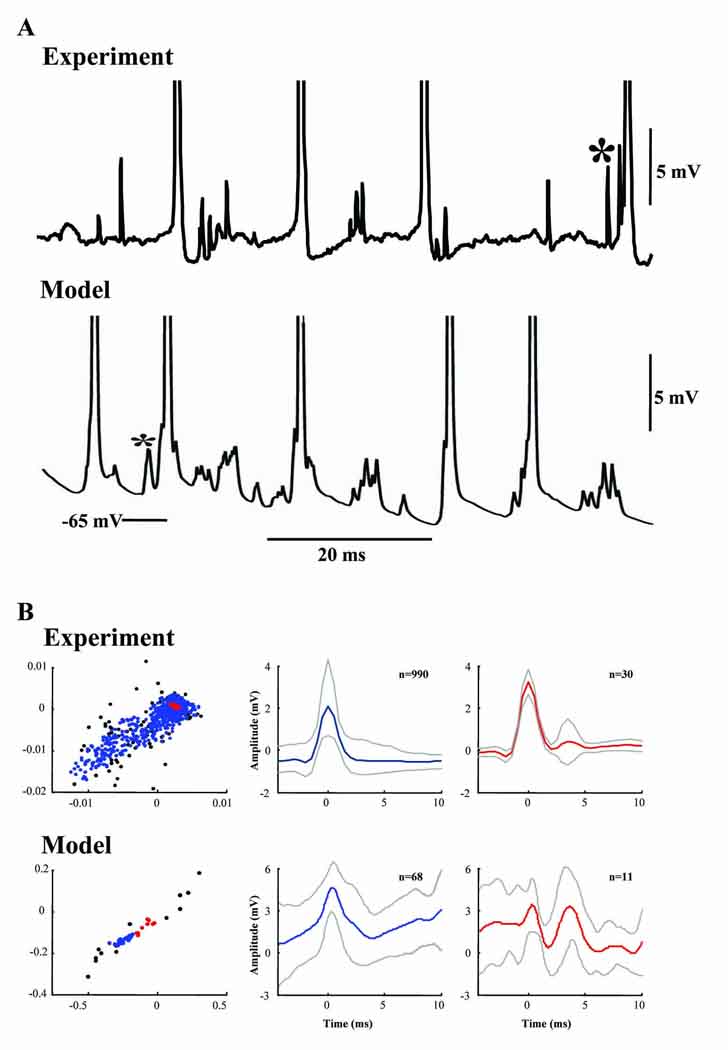
(A) In some Purkinje cells, barrages of spikelets occur at varying amplitudes (Middleton et al., 2008), and similar barrages occur in the somata of Purkinje cells during network VFO in the model. On occasion (*), spikelets occur just prior to full action potentials (which are truncated in both experimental and model records). (B) Results from cluster analysis of spikelets recorded from Purkinje cell somata (experiment) or present in somatic compartments in the Purkinje cell network model. Experimental data (upper panels) were taken from a set of 1,080 spikelets. Left graph shows the distribution of spikelet properties as 1st vs. 2nd wavelet coefficients. Spikelets in the largest cluster (blue) show large, approximately linear variability in wavelet coefficients. Spikelets in the second largest cluster are shown as red symbols and all remaining spikelets are shown as black symbols. Middle and right graphs show the mean (± 1S.D.) spikelet shapes for the largest and 2nd largest clusters respectively. 90% of spikelets form the large cluster. Lower panel shows results from the same cluster analysis applied to model data containing 91 spikelets. The distribution of spikelet properties showed a similar coefficient variability to the experimental data. 75% of spikelets form the large cluster. Note that, both in experiment and model, the spikelets in the second largest cluster did not appear to have different shapes compared to those mapped to the largest cluster, but rather were occurring in multiplets rather than singlets.
Spikelets of somewhat similar appearance to Fig. 2A (*) are also noted in layer 5 intrinsically bursting pyramidal cells in somatosensory neocortex, during the beta2 (~25 Hz) oscillation induced in somatosensory cortex slices by kainate – another network phenomenon attributable to gap junctional coupling (Roopun et al., 2006). In general, however, spikelets in layer 5 pyramidal cells are not polymorphic in the way Purkinje cell spikelets were. There are two possibilities that might explain variation in shape and amplitude of the spikelets: first, there might be coupling between different regions of the cells, e.g. axons, somata and dendrites; second, the coupling might all lie between homologous regions (e.g. all between axons, as used in the model described here), but at different electrotonic distances from the soma. In the first case, one might expect utterly distinct categories of spikelet shapes, as illustrated for dendritic vs. axonal electrical coupling between pyramidal cells (see Fig. 4 of Draguhn et al., 1998). In the second case, one would expect a continuous smooth distribution of spikelet shapes and amplitudes. We addressed this quantitatively by using an unsupervised spike-sorting algorithm (Quian Quiroga et al., 2004) applied to spikelets (see Materials and Methods). The results, shown in Fig. 2B, demonstrate that the overwhelming majority of spikelets (both experimental and simulated) lie in a single, statistically significant cluster, characterized by a continuous distribution of wavelet parameters that define spikelet shape. Most of the spikelets lying outside this main cluster (again, both in experiment and model) were multiplets, unlike the singlet spikelets in the main cluster. Thus, the results in Fig. 2B were consistent with the second of the above described possibilities: that spikelets arise from electrical coupling between homologous cell regions, with differences in electrotonic distance from the soma. The model indicates that the cell region involved is the axon. [Note the smaller number of data points for the model as compared with experiment: this was necessitated by the very long computation times for the simulations (Materials and Methods).]
Fig. 4. Gap junctions increase axonal firing, in addition to producing oscillatory (rhythmic) temporal organization.
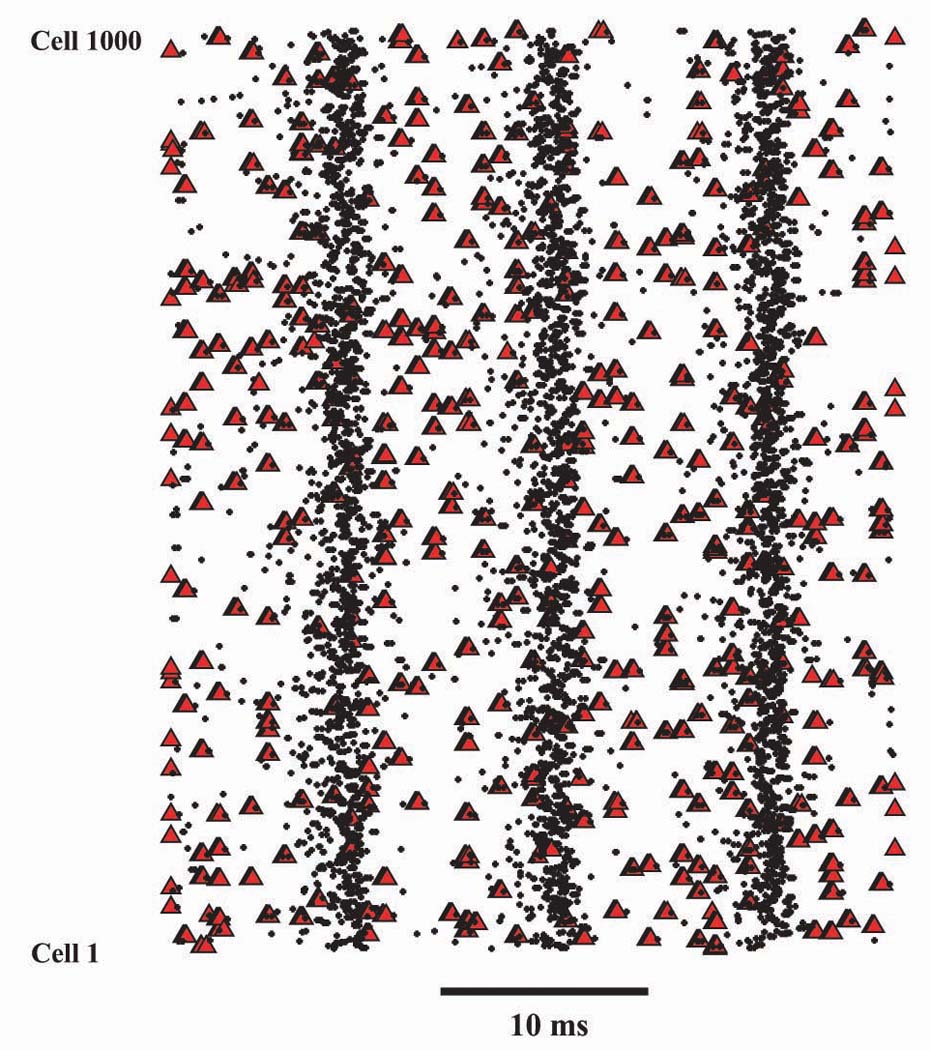
Raster plots were constructed by probing the mid-axonal (3rd compartment from the soma) potential of each model Purkinje cell, every 0.045 ms, and writing into a file the time and cell number if this potential was > 0 mV, i.e. overshooting. (This procedure on occasion counts a single axon potential or tight doublet twice, so it is not perfectly precise to say that it counts “spikes”.) Red triangles indicate overshooting times when the axons are all electrically uncoupled, but subject to Poisson-distributed depolarizing pulses (0.45 nA, 0.8 ms, to one axonal compartment) at a mean rate of 13.3 Hz per axon. There are 5,879 “overshooting events” per 100 ms, scattered irregularly (so that somewhat under 50% of the depolarizing pulses actually leads to an axonal action potential). In contrast, black dots are axonal overshooting events from a simulation with identical parameters – including the axonal depolarizing pulses, which are given at exactly the same times - but with electrical coupling between the axons (6 nS coupling conductance, average of 5 gap junctions per axon, gap junctions on 3 most proximal axonal compartments). In this case, there are 19,999 “overshooting events” per 100 ms (i.e. a 3.4-fold increase in axonal activity), now organized into a population oscillation.
Spikelets in the network model usually result from full action potentials in coupled axons, but not from full action potentials in the parent axon
In previous models of gap junction-mediated network oscillations (e.g. Traub et al., 1999, 2005; Roopun et al., 2006; Cunningham et al., 2004a), principal cell spikelets were uniformly induced by full action potentials in the parent axon of the respective principal neuron, in whose soma the spikelet was observed. These cells, therefore, appear to express “partial” spikes as classically described in spinal motorneurons (Coombs et al., 1957). In contrast, in Purkinje cells, axonal action potentials reliably invade the soma to trigger full action potentials, according to Clark et al. (2005) and Khaliq & Raman (2006). Therefore, we are not surprised that, in the present model, as Fig. 3 makes clear, somatic spikelets were not induced by action potentials in the parent axon. As Fig. 3A2 shows, somatic spikelets corresponded instead to slightly larger spikelets in the parent axon, and not to full spikes in the parent axon; when the parent axon fired a full spike (*), so did the soma. On the other hand, spikelets in the parent axon (and soma) corresponded to full action potentials in electrically coupled axons (compare Fig. 3A1 with Fig. 3B, the respective potentials being “recorded” simultaneously – Fig. 3B shows all of the axons to which the parent axon was coupled).
Fig. 3. In the network model, somatic spikelets do not (in general) correspond to full action potentials in the parent axon, but do correspond to full action potentials in one or more electrically coupled axons.
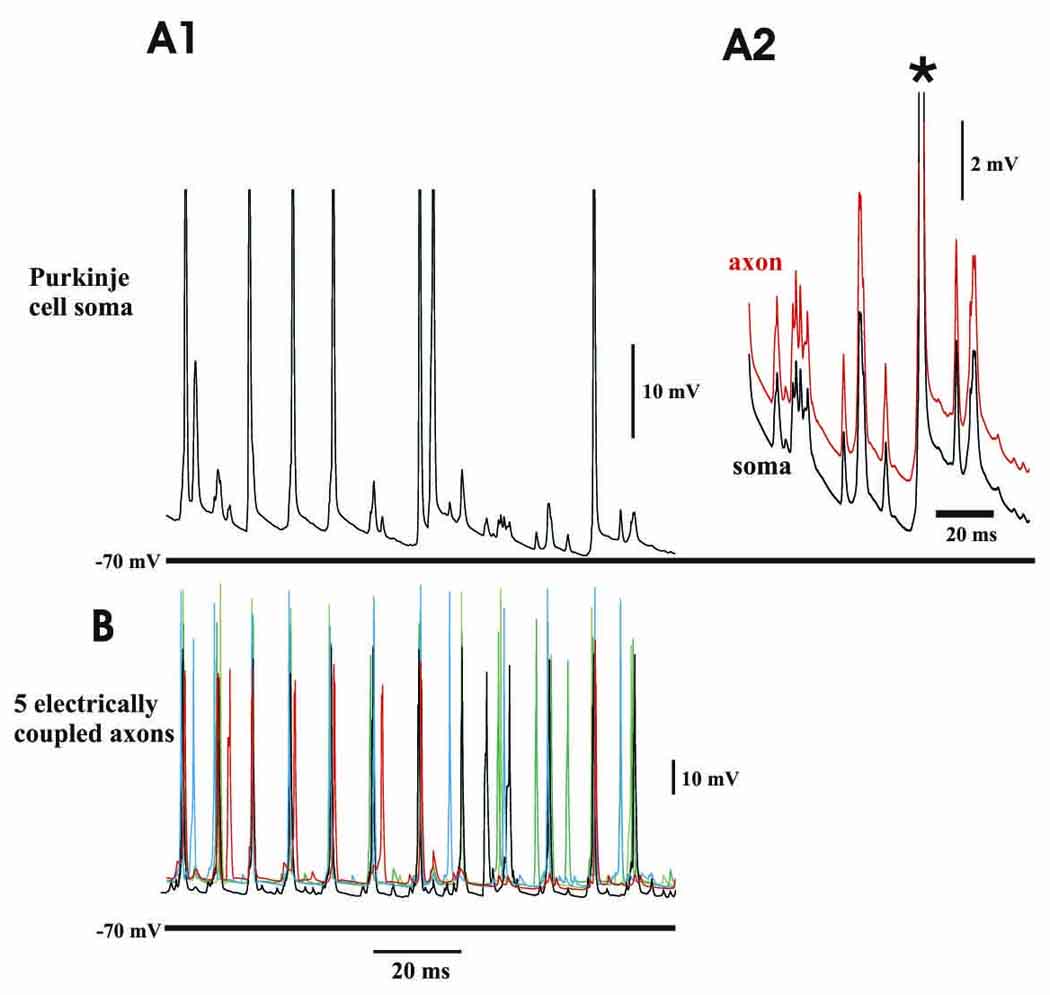
(A1) somatic trace of a hyperpolarized Purkinje cell, showing multiple spikelets of variable amplitude. (A2) expansion of part of the trace in A1 (around the last somatic action potential), also showing the simultaneous voltage at an axonal site. There is a one-one correspondence of somatic spikelets with axonal spikelets. (B) 5 axons that are electrically coupled to the cell shown in A, in a trace that is concurrent with the somatic trace of A1. Every somatic spikelet (and also full action potential) is tightly correlated with a full spike in one or more of the coupled axons. (Data from the same simulation as Fig. 2.)
Thus, the somatic spikelets in our Purkinje cell network model resemble conventional electrical coupling potentials, more than they resemble the axonal coupling situation described previously (e.g. Traub et al., 1999; Schmitz et al., 2001); in this previous situation, a spike in one axon induces (in the model), or is presumed to induce (in the experiments), a full spike in a coupled axon, that then propagates antidromically to the soma – and, if this propagation is decremental, the antidromic propagation results in a somatic spikelet.
If, then, the gap junctions in our present model are simply inducing conventional coupling potentials, does that imply that the model consists simply of a set of Purkinje cell intrinsic oscillators, that are synchronized by the gap junctions? The answer is definitively “no”, as the next figure demonstrates.
Electrical coupling in the network model increases axonal firing rates, as well as providing temporal organization of the activity
Our Purkinje cell network model is not behaving as a system of coupled oscillators in two fundamental respects, both clear in Fig. 4: 1) the uncoupled neurons are not regular oscillators, but rather their axons are induced to fire by independent Poisson processes (see also Materials and Methods); 2) there are more than 3 times as many axonal spikes per unit time in the coupled network, compared to the uncoupled network (see also the network behavior in Roopun et al. (2006) – both experimental and simulated – in which firing rates are higher in the coupled systems than in the uncoupled systems; see, as well, Maex and De Schutter (2007), who also observed an increase of firing rates with weak coupling). Evidently, our Purkinje cell network model is producing collective oscillations as an emergent process, with the gap junctional coupling increasing the firing probability of each given axon, as well as providing temporal organization to the population as a whole. How can this be, given that one does not see axonal spiking in one cell induce axonal spiking in a coupled cell (Fig. 3)? Our presumption is that the occurrence (within a narrow time window) of axonal spikes in n or more cells (n > 1) – all of these axons being coupled to an observed axon – will suffice to induce a spike in the observed axon. This notion (that two or more coincident axonal spikes can induce a spike in a coupled axon) would be in accord with the requirement, in the model, for a high rate of spontaneous firing, as well as for a high density of gap junctions (5 per neuron, far above the so-called percolation limit of one gap junction per axon (Erdös & Rényi, 1960)). In contrast, previous models of axonal plexus very fast oscillations, in which single spikes could cross from one axon directly to another axon, could work with very low ectopic rates (<0.1 Hz, vs. >13 Hz used here), and very sparse gap junctional coupling (e.g. 1.6 gap junctions per axon, on average, vs. the 5 gap junctions on average used here) (Traub et al., 1999).
We tested the hypothesis that multiple axonal spikes in coupled cells were required to induce an axonal spike in another cell, as follows. We repeated the simulation used in Fig. 3 and Fig. 4 twice, concentrating on a particular Purkinje cell (#21) over a few-ms interval during which its axon fires (Fig. 5). First, we plot the action potentials of the 5 axons electrically coupled to cell #21, starting at time 77.5 ms (Fig. 5A – here, “control” refers to the simulation used in Fig. 3 and Fig. 4). Fig. 5B, “control”, shows the corresponding voltage for the axon of cell #21 itself (black trace). Next, we repeated the entire simulation, but starting at time 77.5 ms, we unidirectionally blocked the gap junction between axon #168 and axon #21: axon #168 was the first coupled axon to fire in Fig. 5A, and we prevented current from flowing from this axon to axon #21. This manipulation delays the firing of axon 21 by about 1 ms (Fig. 5B, green trace). Finally, we prevented current flow from two early-firing coupled axons to axon #21. In this case, axon #21 did not fire at all (Fig 5B, red trace), even though two other coupled axons (#28 and #304) fire at nearly the same time as the blocked axons [axon #99 required input from axon #21, and so did not fire during the “red” simulation, but axons #28 and #304 did actually fire – not shown]. Thus, at least in this instance, multiple near-simultaneous firings of couple axons seem to be required to induce firing in a given axon.
Fig. 5. Multiple axonal spikes are required to induce an axonal spike in a coupled cell.

(A) shows the potentials of 5 axons that are electrically coupled to the axon of Purkinje cell #21, starting at time = 77.5 ms, in the simulation used for Fig. 3 and Fig. 4. The axons are labelled and plotted in different colors. (B) the potential in the axon of cell #21, also starting at time = 77.5 ms, in control conditions (black, same simulation as in (A)); in conditions where axon #168 ceases to influence axon #21 at time = 77.5 ms (green – note the delay in the spike in axon #21); and in conditions where both axons #168 and #688 cease to influence axon #21, starting at time = 77.5 ms (red – note the suppression of firing in axon #21, despite firing in axons #28 and 304).
What determines the period of the network oscillation? In previous axonal plexus VFO models (e.g. Traub et al., 1999; Lewis & Rinzel, 2000), wherein a single axonal spike could induce a spike in a coupled axon, a major determinant of the oscillation period was the gap junctional connectivity; and the intrinsic properties of the axons played virtually no role in determining the population period. It was possible to manipulate the connectivity over a range of ~1.5 gap junctions per axon (on average) to over 3. In contrast, in the present model, there is an absolute requirement for high gap junctional connectivity, which makes it likely that some other parameter(s) determined the period. In another model of Purkinje cell axonal plexus oscillations (Maex & De Schutter, 2007), axon/soma conduction times contributed significantly to the period; that model, however, used a very long unmyelinated axon, up to 1 mm. Our model, in contrast, uses a rather short unmyelinated axon (Eccles et al., 1967; Palay & Chan-Palay, 1974; Kato & Hirano, 1985), and axon/somatic conduction times are very short (Fig. 3A2). We therefore asked whether intrinsic membrane conductance kinetics might be determining the oscillation period, in the present model, and in contrast to previously investigated percolation-type VFO models (Traub et al., 1999). As it is the axons that initiate the firing, we concentrated on membrane kinetics there. We noted (not shown) that blocking the persistent Na+ conductance had only a small effect on the network oscillation, and so therefore concentrated on the axonal transient Na+ conductance and on axon K+ conductances.
Oscillation period in the network model is not gated by axonal K+ currents
As Fig. 6 makes clear, axonal K+ currents are phase-locked to the population oscillation – hardly surprisingly – but the current between axonal population spikes falls to virtually zero. This makes it unlikely that the oscillation period is determined by such currents, at least in a direct fashion. [There are, however, indirect effects (not shown), since K+ currents will influence action potential amplitude and width, and hence the manner in which one axon influences a coupled axon. For example, if delayed rectifier gK density was increased by 50%, the oscillation was blocked; and if it was decreased by 30%, the oscillation became faster and of higher power (by indirectly strengthening the effective coupling between axons).]
Fig. 6. Period of simulated network very fast oscillation is not gated by axonal K+ conductances.
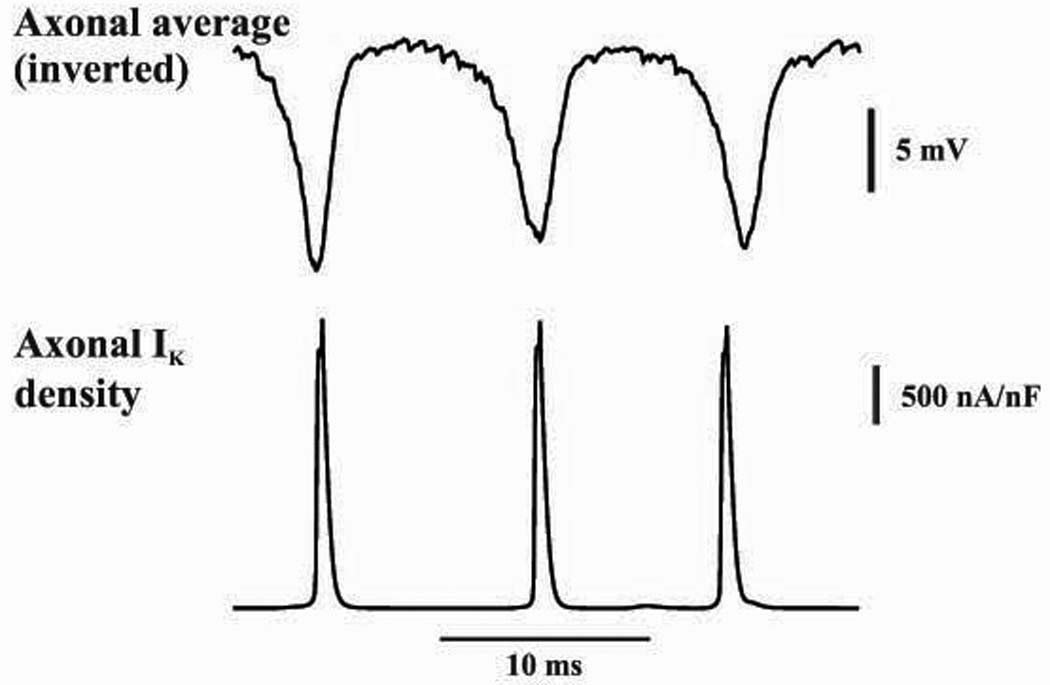
Plotted are the axonal “field” (i.e. the inverted average axonal potential at one site in the distal axons), and axonal IK density in an adjacent axonal compartment of a single neuron. This current density falls to virtually zero between field minima.
Oscillation period in the network model is determined by recovery from transient Na+ current inactivation
The kinetics of the transient Na+ conductance inactivation (Hodgkin-Huxley “h”, see Materials and Methods) were directly coupled to the field oscillation in our model (Fig. 7A). (In this simulation, the ectopic spike rate was, on average, 40 Hz per axon, so that the baseline population frequency here is faster than for previous simulations.) Furthermore, when inactivation kinetics in the network model were slowed by 50%, the network oscillation slowed from 141 Hz to 98 Hz (Fig. 7B); and when inactivation kinetics were sped up by 50%, the oscillation frequency increased to 152 Hz (not shown). Note that activation kinetics of the transient Na+ conductance are much faster than the oscillation period, and can not directly gate the period. A corresponding reduction of oscillation frequency also occurred when transient Na+ conductance inactivation kinetics were slowed by 50%, using the original ectopic spike rate of 13.3 Hz per axon: from 98 Hz to 76 Hz (not shown).
Fig. 7. Period of simulated network very fast oscillation is gated by the kinetics of transient gNa inactivation (Hodgkin-Huxley “h” variable).
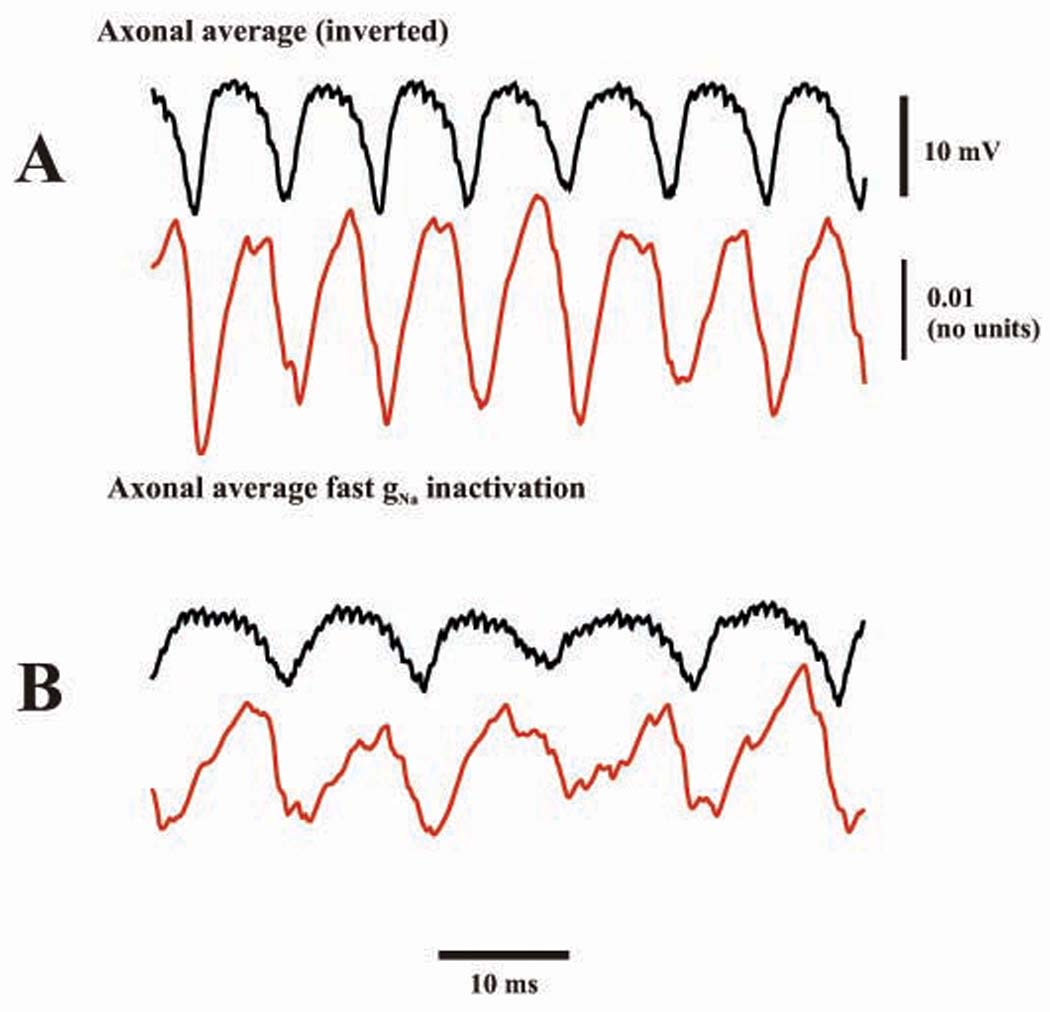
(A) baseline simulation, showing (black) the axonal “field” (as in Fig. 6) and the average value (averaged across the population of 1,000 model Purkinje cells, red) of “h” for transient gNa, at a mid-axonal compartment. Same simulation as in previous Figures, except for a higher axonal noise rate (40 Hz). Population oscillation frequency is 141 Hz. (B) the simulation of A was repeated but with the kinetics of “h” for transient gNa at half the usual value (i.e. the Hodgkin-Huxley rate functions αh and βh were each multiplied by 0.5). The population frequency is now 98 Hz.
The conceptual scheme for the network oscillation, suggested by the simulations, would then be as follows: suppose the Purkinje cell axons all fire together on a particular VFO wave, and their Na+ conductances inactivate roughly in phase. As recovery from inactivation proceeds, noise (in the form of ectopic axonal spikes) occurs and eventually several axons begin to fire. If there is enough noise, and if axonal refractoriness has recovered enough, there will be instances of multiple firings in axons that are all coupled to the same axon, and propagation can then provide amplification in the degree of firing, above and beyond what occurs from the ectopic process by itself. This amplification in turn eventually leads to the next VFO wave (Fig. 4). This scheme is consistent with the period-dependence on Na+ conductance kinetics, as well as on the need for large numbers of gap junctions and high ectopic rates. The scheme is roughly analogous to the growth process that leads to an action potential in a single axon, with the following set of equivalences:
Single axon individual Na+ channel ~ an axon in the population
Opening of the individual Na+ channel ~ a spike in one axon
Stochastic single-channel openings ~ ectopic spikes in the network
Current flowing through an open channel depolarizing the membrane and tending to open other channels ~ current from a spike in one axon depolarizing other axons through gap junctions.
Our previous models of VFO (e.g. Traub et al., 1999) would then be analogous to a situation where stochastic opening of a single Na+ channel could lead to a full action potential, assuming the membrane to be at rest; whereas the present Purkinje cell network model is analogous to the (more usual) case where a number of Na+ channels must open for a spike to occur, even with the membrane at rest or nearly so. Furthermore, in our previous VFO model (Traub et al., 1999), intrinsic membrane properties did not significantly influence the population period, whereas in the present VFO model, intrinsic membrane properties clearly do influence the period.
Experimental evidence, using β-pompilidotoxin, that cerebellar VFO period is also gated by transient Na+ current inactivation
The wasp venom toxin β-pompilidotoxin has been reported to slow the kinetics of Na+ channel inactivation (Grieco & Raman, 2004). We therefore were able to test the prediction of Fig. 7 experimentally (Fig. 8). [The experiment was done after the simulations.] Network oscillations were induced in mouse cerebellar slices with nicotine (10 µM) and gabazine (2 µM), as described elsewhere (Middleton et al., 2008). Mean peak frequency of the very fast network oscillation was 139 ± 3 Hz before application of the toxin, while following β-pompilidotoxin application (10 µM), the mean peak frequency shifted to 98 ± 4 Hz. (This change was significant, P<0.01 paired t-test, n=5.) Thus, this experiment was indeed consistent with the model prediction.
Fig. 8. Experimental evidence (using β-pompilidotoxin) that cerebellar network very fast oscillations are also gated by the kinetics of transient gNa inactivation.

See text for details.
Discussion
In this paper, we have proposed a network model of cerebellar very fast oscillations (VFO) that is based primarily on in vitro data (Middleton et al., 2008; Middleton, 2005). The model consists of 1,000 Purkinje cells, electrically coupled via their proximal axons, with an average of 5 gap junctions lying on each axon; there are no chemical synapses in our model. This model generates VFO under conditions of high spontaneous rates of axonal spiking activity – simulated as ectopic axonal spikes, but reasonably expected to occur in vivo, given the high rates of spontaneous Purkinje cell somatic firing in vivo (dozens of Hz (Armstrong & Rawson, 1979; Demer et al., 1985), similar to the rates used in our model); the in vivo firing might also be ectopic in origin, at least in part.
The model network oscillation is associated with somatic spikelets (Fig. 2); note that during experimental in vitro cerebellar VFO, induced by nicotine + gabazine, spikelets also occur, at least in a subset of Purkinje cells (Middleton et al., 2008). Shape parameters for the great majority of spikelets are continuously and broadly distributed, as in experiments, suggesting that the spikelets result from electrical coupling between different sites of homologous cell regions. The oscillation period is largely determined by the recovery from inactivation of the transient Na+ current (Fig. 7 and Fig. 8). The oscillation mechanism can not be understood as a system of coupled single-cell-oscillators (each with an intrinsic period similar to the population period), but rather as a more subtle type of cooperativity, in which gap junctions significantly increase the degree of firing (Fig. 4) – although this increase in firing is nowhere near as great as occurs in our models of hippocampal VFO (Traub et al., 1999 – see also Lewis & Rinzel, 2000). In the cerebellar VFO model, this latter reduced degree of amplification, produced by electrical coupling, comes about because, in the cerebellar VFO model, a spike in a single axon is not sufficient to induce a spike in a coupled axon.
Omission of cerebellar interneurons
In mouse cerebellar slices, VFO involves cerebellar interneurons as well as Purkinje cells (Middleton et al., 2008; Middleton, 2005); whereas, in our network model, we considered (for the sake of simplicity) only the Purkinje cells. Is this a reasonable assumption? Testing the assumption with experimental electrophysiological methods is not straightforward: one would like to uncouple functionally the putative networks of Purkinje neurons vis-à-vis local circuit interneurons, but there is no simple means to accomplish this. It might be possible to arrange by the transgenic insertion of a protein into the interneurons that selectively allows their hyperpolarization. An additional crucial piece of missing information is morphological (see also below): are there enough gap junctions between Purkinje cells to support the oscillation? Or is it possible that one or more of the interneuron populations is densely interconnected enough by gap junctions to serve as a primary VFO generator, that is then transmitted to the Purkinje cells? The latter notion must at least be considered, as there is dye-coupling between Purkinje cells and interneurons (Middleton et al., 2008); on the other hand, experimental in vitro VFO power is maximal in the granular layer and white matter (Fig. 7 of Middleton et al. (2008), which might argue against a primary involvement of basket cells and stellate cells. Future simulations of networks containing both Purkinje cells and interneurons, together, may provide clues.
Physical realizability of the proposed gap junctionally connected axonal plexus
In our model, 5 gap junctions (on average) are located all on the proximal 30 µm of each Purkinje cell unmyelinated axon/initial segment. This represents a mathematical idealization, as it is not clear that the Purkinje cells and their axons can be arranged in space in such a way that this is physically realizable: the soma diameter of rat Purkinje cells of postnatal day 18 and above is 17–23 µm (Takács & Hámori, 1994). With the Purkinje somata arranged in a 2-dimensional sheet, soma separations would have to be at least 17 µm, and 30 µm of axon does not provide enough length for all the necessary gap junctions, even if each axon is constrained to contact only axons of nearest-neighbor somata (and we assume random axonal electrical connectivity). Therefore, if our model really is capturing the physical principles of cerebellar VFO in a reasonable way, then we must assume either 1) that some of the gap junctions lie on axon collaterals (we consider this the most likely case); 2) that axons are coupled on more distal axonal sites than simulated in our model; or 3) that electrical coupling between Purkinje cells in reality occurs in some indirect fashion, such as through the presynaptic terminals of basket cells. In all of these cases, we would expect the fundamental physical principles of this model to apply, but details are likely to vary – particularly how many axons must discharge together to force the firing in a coupled axon.
Evidence for axonal gap junctions
Dye-coupling between Purkinje cells (Middleton et al., 2008) indicates that Purkinje cells might be electrically coupled, but does not constitute proof for such coupling, let alone that the coupling is between axons. To the best of our knowledge, there is only one report that provides ultrastructural evidence (outside of the retina) for axonal gap junctions in the mammalian brain, and that report dealt with hippocampal mossy fibers (Hamzei-Sichani et al., 2007). There is, additionally, convincing ultrastructural evidence for gap junctions on the proximal axons of neurons in lower vertebrates (for example, Korn et al., 1977). We were not able to replicate, in a network model containing only Purkinje cells, the experimental electrophysiological data from cerebellar slices (Middleton et al., 2008; Middleton, 2005) when we used soma-dendritic electrical coupling between the neurons; but we could replicate the data if we postulated electrical coupling between the axons of these cells. In that sense, then, our model makes a precise prediction, namely that such axonal gap junctions do indeed exist. How might they be found? There is considerable evidence that many, or possibly even most, of the gap junctions in the mammalian nervous system are quite small, less than 100 nm across (Rash et al., 2007; J.E. Rash, personal communication), as was true for the gap junctions on mossy fibers (Hamzei-Sichani et al., 2007) – and, as a consequence, many or most of the gap junctions in the mammalian nervous system will be difficult or impossible to find with conventional thin section transmission electron microscopy. It would appear that freeze-fracture replica immunogold labeling (“FRIL”) is the method of choice in order to search for gap junctions (Rash et al., 2007), and we await its application to the cerebellum.
Comparison with a previous study
Maex and De Schutter (2007) were the first, to our knowledge, to address the problem of cerebellar very fast oscillations using a network model. Their model had somewhat different structural features and dynamical behaviors than ours, which we may contrast as follows: a) in the individual neurons, Maex and De Schutter used a very long unmyelinated axon (>1 mm), whereas we used a short one (tens of µm); Maex and De Schutter used (mostly) an hexagonal lattice connection topology, while we used a locally random one; Maex and De Schutter used (mostly) electrical coupling that was located hundreds of µm from the soma, whereas ours was on the most proximal axon. As a source of stimulation to the neurons, Maex and De Schutter used noisy dendritic synaptic stimulation, whereas we used Poisson-distributed spontaneous axonal spikes.
In terms of dynamics, Maex and De Schutter considered two regimes, weak electrical coupling and strong (with gap junction conductances, in the latter case, able to assume values as large as 9 nS). Here, “weak coupling” means that single spikes do not cross from axon to axon, whereas with “large coupling” they do: the dynamical behaviors illustrated in the present paper correspond to “weak coupling” – indeed, in both studies it was not possible to produce strong coupling with gap junctions located on the proximal axon. For weak coupling, Maex and De Schutter (their Fig. 2) found gamma oscillations rather than the very fast oscillations described here. Whether the underlying physics of the two models is really identical (neglecting for the moment the issue of frequency) is uncertain, because Maex and De Schutter did not illustrate the firing behaviors of the uncoupled neurons – whereas our Fig. 4 clearly shows that the simulated network oscillation is an emergent phenomenon that can arise from a system of neurons which – when uncoupled – may fire sparsely and irregularly. Our guess, however, is that the Maex and De Schutter model might – if stimulated sufficiently (and perhaps requiring axonal as well as dendritic excitation) – also generate very fast oscillations with weak coupling. If this turns out to be true, then the underlying physical mechanisms in the two models could prove similar; such a finding would be interesting, as it would imply that other structural features of the models, such as connection topology, are less relevant.
The very fast oscillations that Maex and De Schutter (2007) observed with strong coupling had a number of unusual features, such as a) frequency dependence on gap junction site and on the time for an axonal spike to reflect off the soma and conduct back into the axon; and b) a tendency of the fastest oscillations to stop and start abruptly. As our model did not possess the corresponding structural features of Maex and De Schutter (very long axon, very strong coupling), we did not observe these corresponding network behaviors. Our guess, however, is that the strong-coupling type of very fast oscillations, described by Maex and De Schutter (2007) might be possible if electrical coupling were to occur between Purkinje cell nodes of Ranvier, i.e. at sites distant from the soma. This point again underscores the importance of ultrastructural data for distinguishing oscillation models.
Possible functional significance of cerebellar VFO
In attempting to understand the functional significance of cerebellar VFO, there are several features of the VFO to consider:
It is possible that cerebellar VFO in “pure form”, such as occurs in vitro with nicotine and gabazine, may exist in vivo only as a pathological phenomenon (Cheron et al., 2004, 2005a,b; Servais & Cheron, 2005; Servais et al., 2005); the in vitro data suggest that “pure VFO” in vivo might reflect, in part, a failure of local synaptic inhibition (Middleton et al., 2008), as blockade of such inhibition is what converts gamma into VFO. As such, in vivo VFO could conceivably contribute to neurological signs such as ataxia; although it is also possible that in vivo VFO represents an attempt by the brain to compensate for a functional deficit. In order to address this issue, it would be helpful to have experimental means of manipulating cerebellar VFO in awake behaving mice.
Axonal (and somatic) firing during VFO occurs more frequently than would occur without VFO, in conditions where GABAA receptors are blocked (Fig. 4). Because of the very limited dendritic backpropagation of somatic action potentials in cerebellar Purkinje cells (Llinás & Sugimori, 1980a,b), it seems unlikely that the increased somatic firing would have much influence on synaptic plasticity in Purkinje cell dendrites. On the other hand, the increased orthodromic output from a network of Purkinje cells could have a major effect on downstream neurons, such as neurons in deep cerebellar nuclei. In vivo recordings from these latter neurons, during the localized induction of cerebellar VFO, would shed light on this possibility. Does the spatiotemporal patterning – i.e. the fact that VFO really is an oscillation rather than an unstructured increase in axonal firing rates – matter? This issue might be addressable experimentally in vivo by comparing the effects of non-specific increases in Purkinje cell excitability with the effects of VFO itself.
Complex spikes in Purkinje cells, that result from climbing fiber inputs, represent a form of VFO in single neurons, although at frequencies faster than studied in this paper. Purkinje cells can receive near-simultaneous climbing fiber inputs (Lang et al., 1999), perhaps related to electrical coupling in the inferior olive, the site of origin of the climbing fibers, or to collateralization by the climbing fibers. It is possible that Purkinje axonal coupling would then lead to coordinated VFO in a group of nearby Purkinje neurons – a cerebellar cell assembly, so to speak.
While the above questions remain to be addressed experimentally, one can say at this point that cerebellar VFO is of great interest theoretically, because of its different properties as compared with VFO in hippocampus and neocortex. As noted above, the generation of a similar phenomenon by different means, in distinct brain regions, suggests the possibility of functional relevance.
Acknowledgements
Supported by NIH/NINDS, the Wellcome Trust, MRC, and RIKEN. We thank Drs. Hiroshi Miyakawa, Walter Akemann and Andrea Bibbig for generous assistance.
Abbreviation
- VFO
very fast oscillation
Appendix
Model of single Purkinje cell
We used a highly schematic representation of what might be called an “average” Purkinje neuron, building on the work of Llinás & Sugimori (1980a,b), Roth & Häusser (2001), De Schutter & Bower (1994a,b), Miyasho et al. (2001), and Akemann et al. (2006). There were 12 voltage-and calcium-dependent conductances: transient Na+ (gNa(F)), persistent Na+ (gNa(P) − “P” in this case for “persistent”), P-type Ca2+ (gCa(P) − “P” here for “Purkinje”), T-type Ca2+ (gCa(T)), R-type Ca2+ (gCa(R)), the anomolous rectifier or “h” conductance (gAR), delayed rectifier K+ (gK(DR)), transient inactivating K+ (gK(A)), transient slowly-inactivating K+ (gK(D)), M-type K+ (gK(M)), rapid C-type (BK channel) K+ that is gated by both voltage and [Ca2+]i (gK(C)), and slow AHP K+ that is gated by [Ca2+]i (gK(AHP)). Calcium and calcium-gated channels were included for the sake of completeness and for future studies, as they were shut off during the network simulations reported here (as were D channels).
We use a consistent set of units: mV, ms, nF, µS, nA.
The reversal potentials for the various conductances considered are as follows: leak, −80 mV; K+, −85 mV; Na+, 45 mV; Ca2+, 135 mV; anomalous rectifier, −30 mV; GABAA, −75 mV; AMPA, 0 mV.
Compartmental architecture and passive parameters
The overall design of the cell is shown in Fig. Appendix 1. As in previous publications (e.g. Traub et al., 2005), the model cell was divided into “levels”; within a given level, each ionic conductance has a fixed density. The definition of the levels is as follows: level 0 is the axon; level 1 is the soma; level 2 is the dendritic shaft; level 3 is the rest of the smooth dendrites; level 4 consists of the spiny dendrites.
Fig. Appendix 1. Architecture of model Purkinje cell.

There are 6 compartments for the unmyelinated axon (“level” 0) of length 10 µm and radius 0.75 µm tapering linearly to 0.5 µm; a one-compartment soma (level 1), radius 9.0 µm, length 29.0 µm, area 1,640 µm2; 2 cylindrical compartments of smooth dendritic shaft (level 2), each of length 30 µm and radius1.8 µm; an additional 22 compartments of branching smooth dendrites (level 3), of length 15 µm and radius 1.80 or 1.42 µm (the smaller value distal to the 2nd branch point); and 44 spiny “treelets” (level 4), each of 12 compartments (length 25 µm and radius 0.75 or 0.6 µm, the smaller value past the branch point). Two treelets are attached to each of the level 3 smooth dendritic compartments. There are 559 compartments in all.
All compartments are cylindrical. The radius and length of each compartment was used to compute its internal resistivity; however, the surface area of each spiny dendritic compartment was multiplied by 3, in order to allow for the contribution of the spines. The “adjusted” surface area was then used for computation of leak conductance and active conductance densities. The soma surface area was 1,640 µm2, the smooth dendritic surface area was 3,909 µm2, and the spiny dendrites (with the spines) was 161,729 µm2. The radius of the axon tapered linearly from 0.75 µ to 0.5 µ.
The passive parameters were as follows: internal resistivity, Ri, was 115 Ω-cm for soma and dendrites, and 100 Ω-cm for the axon. Membrane resistivity, Rm, was 50,000 Ω-cm2 for the dendrites, 10,000 Ω-cm2 for the soma, and 2,000 Ω-cm2 for the axon. Membrane capacitance, Cm, was 0.8 µF/cm2. When all active currents were blocked, the input resistance of the model cell was 35.6 MΩ when measured at the soma, and 79 MΩ when measured in the distal axon.
Discrete form of the cable equation
There are three basic sets of equations to be considered: the cable equation that relates current flows across the membrane and along the interior of the cell; the differential equations for the Hodgkin-Huxley-like state variables that gate the various active conductances; and the equations that govern the internal calcium “concentration”. The overall approach to these equations is similar to that used in Traub et al. (2005).
The discrete form of the cable equation used in a compartmental model has the form (for compartment k):
where Ck is the capacitance of the compartment, Vk the transmembrane voltage (and we assume the extracellular space is isopotential), the sum is over compartments m that are connected to compartment k, γm,k is the conductance (based on internal resistivity) between compartments m and k (for two coupled cylindrical compartments of equal radius r and length L, γm,k = πr2/(Ri L) with units chosen appropriately), and Iionic, k consists of the transmembrane ionic currents for the compartment (with the convention that inward current is negative, so that the effect is to make dVk/dt positive, i.e. to depolarize the membrane). Iionic, k has 3 components: a) artificially injected currents; b) synaptic currents (for example, something like gGABA(A) (Vk − VGABA(A)), where VGABA(A) is the reversal potential); and c) voltage- and calcium-dependent currents. The latter have the general form as follows (for conductance of type “X”): gk,X(max) mδhε (Vk − VX). Here, gk,X(max) is the maximal conductance of type X in compartment k (determined by the area of the compartment, and the conductance density – see tables below); m and h are Hodgkin-Huxley-like membrane state variables, taking values between 0 and 1: m for activation, h for inactivation; δ and ε are appropriate integer-valued exponents, with ε = 0 when there is no inactivation; and with m and h obeying differential equations that depend on membrane voltage and/or calcium concentration; and VX is the reversal potential for conductance X.
Densities of the voltage- and calcium-dependent conductances
Densities of conductances giving rise to (usually, e.g. at resting membrane potential) inward currents (mS/cm2)
| Level | gNa(F) | gNa(P) | gCa(P) | gCa(T) | gCa(R) | gAR |
|---|---|---|---|---|---|---|
| 0 | 3500 | 0.1 | 0.0 | 0.0 | 0.0 | 0.0 |
| 1 | 5000 | 5.0 | 0.0 | 0.0 | 0.0 | 0.005 |
| 2 | 10 | 1.0 | 0.0 | 0.5 | 0.0 | 0.005 |
| 3 | 0.0 | 0.0 | 8.0 | 1.5 | 8.0 | 0.005 |
| 4 | 0.0 | 0.0 | 8.0 | 1.5 | 8.0 | 0.005 |
Densities of conductances giving rise to (usually, e.g. at resting membrane potential) outward currents (mS/cm2)
| Level | gK(DR) | gK(A) | gK(c) | gK(D) | gK(M) | gK(AHP) |
|---|---|---|---|---|---|---|
| 0 | 1000 | 1.0 | 0.0 | 0.0 | 1.0 | 0.0 |
| 1 | 1000 | 15 | 0.0 | 0.0 | 1.0 | 0.0 |
| 2 | 0.5 | 80 | 25 | 80 | 1.0 | 0.0 |
| 3 | 0.5 | 80 | 25 | 80 | 0.04 | 1.6 |
| 4 | 0.5 | 80 | 25 | 80 | 0.04 | 1.6 |
Voltage-dependent rate functions (V = transmembrane voltage, in mV). αm (V) and βm (V) are the Hodgkin-Huxley forward and backward rate functions, respectively. The state variable m obeys the differential equation dm/dt = αm (V) H (1 − m) - βm (V) H m; h obeys an analogous equation. The rate functions are related to the time-constant for relaxation of m and to its steady-state value as follows: τm(V) = 1/[αm (V) + βm (V)]; m4(V) = αm (V)/[αm (V) + βm (V)]. We specify the particular form of the various rate functions below, as well as presenting the exponents used for m and h:
-
Transient gNa : m3h (following Miyasho et al., 2001):
αm (V) = 35/exp(−(V + 5)/10)
βm (V) = 7/exp((V + 65)/20)
[Note: these rate functions are shifted 6 mV to the left in the axon, to yield: αm (V) = 35/exp(−(V + 11)/10), βm (V) = 7/exp((V + 71)/20).]
-
αh (V) = 0.225/(1 + exp((V + 80)/10))
βh (V) = 7.5/exp(−(V − 3)/18)
-
Persistent gNa : m3 (following Miyasho et al., 2001):
αm (V) = 200/(1 + exp(−(V − 18)/16))
βm (V) = 25/(1 + exp((V + 58)/8))
-
P-type gCa : m (following Miyasho et al., 2001)
αm (V) = 8.5/(1 + exp(−(V − 8)/12.5))
βm (V) = 35/(1 + exp((V + 74)/14.5))
-
T-type gCa : mh (following Miyasho et al., 2001)
αm (V) = 2.6/(1 + exp(−(V + 21)/8))
βm (V) = 0.18/(1 + exp((V + 40)/4))
αh (V) = 0.0025/(1 + exp((V + 40)/8))
βh (V) = 0.19/(1 + exp(−(V + 50)/10))
-
R-type gCa : mh (following Miyasho et al., 2001)
αm (V) = 2.6/(1 + exp(−(V + 7)/8))
βm (V) = 0.18/(1 + exp((V + 26)/4))
αh (V) = 0.0025/(1 + exp((V + 32)/8))
βh (V) = 0.19/(1 + exp(−(V + 42)/10))
-
h-current (anomalous rectifier) : m (Roth & Häusser, 2001)
αm (V) = 0.00063 H exp (−0.063 H (V + 73.2))
βm (V) = 0.00063 H exp(0.079 H (V + 73.2))
-
Delayed rectifier gK, non-inactivating : m4 (See Traub et al., 2005; Martina et al.,1998, 2003)
m4(V) = 1 / (1 + exp((−V − 30)/11.5))
If V < −20 mV then τm (V) = 0.25 + 4.35 × exp((V + 20)/10);
otherwise, τm (V) = 0.25 + 4.35 × exp((−V − 20)/10)
αm (V) = m4 (V)/τm (V)
βm (V) = 1/τm (V) − αm (V)
-
M-current : m
αm (V) = .02 / (1.0 + exp((−V − 20)/5))
βm (V) = .01 × exp((−V − 43)/18)
-
A current: m4h (Miyasho et al., 2001)
αm (V) = 1.4 / (1 + exp(−(V + 27)/12))
βm (V) = 0.49 / (1 + exp((V + 30)/4))
αh (V) = 0.0175 /(1 + exp((V + 50)/8))
βh (V) = 1.3 / (1 + exp(−(V + 13)/10))
-
D current: m4h (Miyasho et al., 2001)
αm (V) = 8.5 / (1 + exp(−(V + 17)/12.5))
βm (V) = 35 / (1 + exp((V + 99)/14.5))
αh (V) = 0.0015 / (1 + exp((V + 89)/8))
βh (V) = 0.0055 / (1 + exp(−(V + 83)/8))
-
Voltage part of C-current: m (kinetics from Traub et al., 1994, with voltage shift of 60 mV, and 2-fold speed-up)
If V< −10 mV then
αm (V) = 0.105 H exp[(V + 50)/11 − (V + 53.5)/27]
βm (V) = 4 H exp((−V−53.5)/27) − αm (V);
otherwise
αm (V) = 4 H exp((−V−53.5)/27)
βm (V) = 0.
Calcium dynamics and the two calcium-dependent K+ conductances
The calcium “concentration” χ (no units) is calculated in each soma-dendritic compartment according to the first-order differential equation dχ / dt = − ψ ICa − βχ χ ; here, ψ (in ms−1× nA−1) and βχ (ms−1) are parameters specific to the compartment, and ICa is the calcium current for the compartment, in nA (with inward current being negative). ψ = 86,667/[compartment area in µm2] in the case of a dendritic compartment, and ψ = 173,333/[compartment area in µm2] for the soma. βχ = 0.8 for the dendrites, and 0.1 for the soma.
The calcium “concentration” χ then contributes to the gating of the two calcium dependent K+ conductances as follows. For the C conductance, in each compartment, gK(C) = [max gK(C) for the compartment] × [Hodgkin-Huxley “m” with voltage-dependent kinetics defined above] × Γ; here, Γ = min (1, 0.04 H χ). For the AHP conductance, the Hodgkin-Huxley “m” variable has kinetics that depend only on χ and not on voltage: αm (χ) = min (0.0006 H χ, 0.3), and βm (χ) = 0.06.
Numerical integration
We used our standard 2nd order explicit method (Traub et al., 2005). The generation of action potentials in this model required a very high density of Na+ channels in the soma and axon, even with the shift of activation kinetics for Na+ channels in the axon. As a result, the differential equations are extremely stiff, and a very small integration step (0.6 µs) was required.
Illustrative model behavior
Fig. Appendix 2 and Fig. Appendix 3 illustrate examples of the model behavior: antidromic and complex spikes (Fig. Appendix 2), and the response to a large depolarizing current (Fig. Appendix 3). The latter demonstrates, in particular, the switch between high-frequency repetitive fast spikes, and bursts that depend on dendritic calcium spikes.
Fig. Appendix 2. Simulated antidromic and complex spikes in model Purkinje cell.
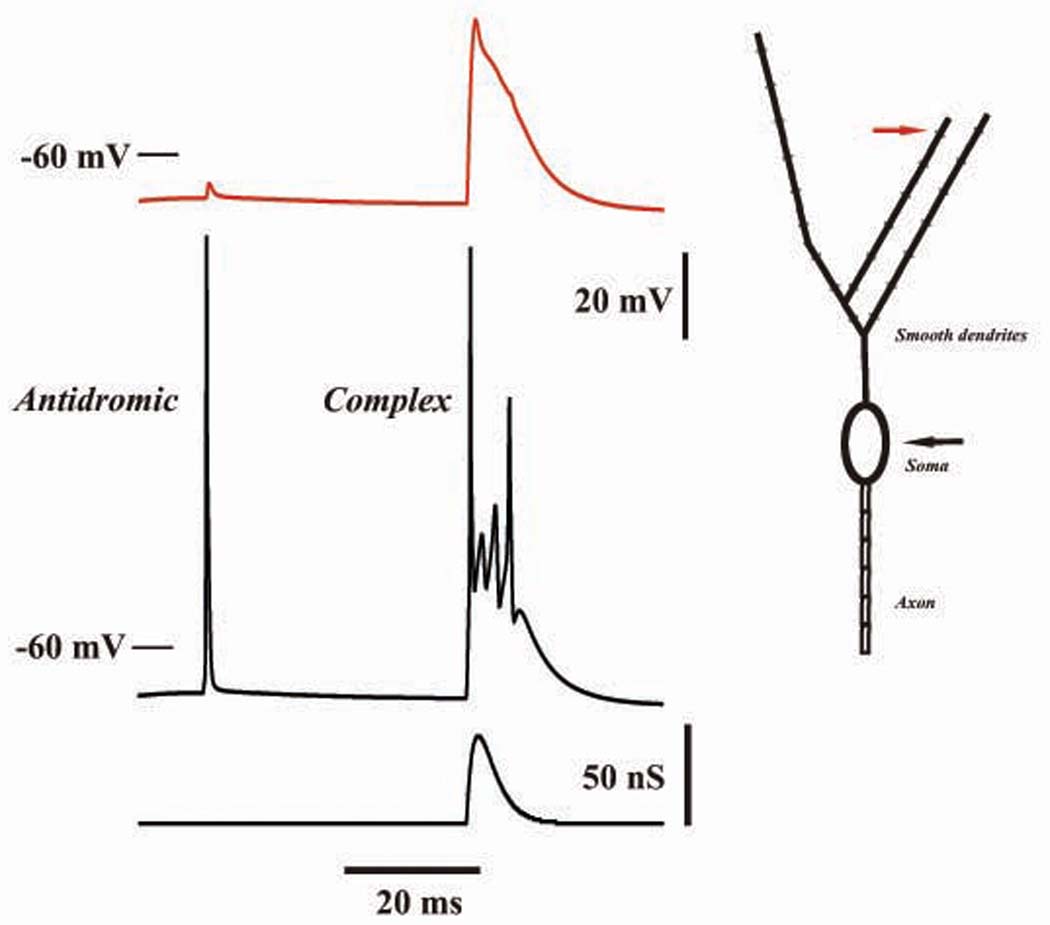
Traces on the left are potential at a smooth dendritic site (in red, location shown in diagram at right), somatic voltage, and AMPA conductance to one smooth dendritic_compartment. The cell is biased with a large tonic GABAA conductance of 3 nS to each dendritic compartment, reversal potential −75 mV. The antidromic spike was evoked by a 0.5 nA, 0.8 ms, current pulse to the distal axon. The complex spike was evoked by AMPA conductances to each of the smooth dendritic compartments, having time course (in nS) of 70 Ht He(−t/1.8), t in ms; the AMPA reversal potential was 0 mV. Note the extremely limited propagation of the antidromic spike into the dendrites, and the lack of dendritic Na+ spikes during the complex spike. The antidromic spike propagated along the axon at ~0.3 m/s.
Fig. Appendix 3. Tonic and repetitive burst firing in the model Purkinje cell, in response to a large depolarizing current pulse injected at the soma.

Position of the dendritic “recording” (red) is shown by the arrow in right inset. gK(D) was blocked in this simulation. Compare with Miyasho et al. (2001).
REFERENCES
- Akemann W, Knöpfel T. Interaction of Kv3 potassium channels and resurgent sodium current influences the rate of spontaneous firing of Purkinje neurons. J. Neurosci. 2006;26:4602–4612. doi: 10.1523/JNEUROSCI.5204-05.2006. [DOI] [PMC free article] [PubMed] [Google Scholar]
- Allen GI, Oshima T, Toyama K. The mode of synaptic linkage in the cerebroponto-cerebellar pathway investigated with intracellular recording from pontine nuclei cells of the cat. Exp. Brain Res. 1977;29:123–136. doi: 10.1007/BF00236880. [DOI] [PubMed] [Google Scholar]
- Armstrong DM, Rawson JA. Activity patterns of cerebellar cortical neurones and climbing fibre afferents in the awake cat. J. Physiol. 1979;289:425–448. doi: 10.1113/jphysiol.1979.sp012745. [DOI] [PMC free article] [PubMed] [Google Scholar]
- Cheron G, Gall D, Servais L, Dan B, Maex R, Schiffmann SN. Inactivation of calcium-binding protein genes induces 160 Hz oscillations in the cerebellar cortex of alert mice. J. Neurosci. 2004;24:434–441. doi: 10.1523/JNEUROSCI.3197-03.2004. [DOI] [PMC free article] [PubMed] [Google Scholar]
- Cheron G, Servais L, Dan B, Gall D, Roussel C, Schiffmann SN. Fast oscillation in the cerebellar cortex of calcium binding protein-deficient mice: a new sensorimotor arrest rhythm. Prog. Brain Res. 2005a;148:165–180. doi: 10.1016/S0079-6123(04)48014-5. [DOI] [PubMed] [Google Scholar]
- Cheron G, Servais L, Wagstaff J, Dan B. Fast cerebellar oscillation associated with ataxia in a mouse model of Angelman syndrome. Neuroscience. 2005b;130:631–637. doi: 10.1016/j.neuroscience.2004.09.013. [DOI] [PubMed] [Google Scholar]
- Clark BA, Monsivais P, Branco T, London M, Häusser M. The site of action potential initiation in cerebellar Purkinje neurons. Nat. Neurosci. 2005;8:137–139. doi: 10.1038/nn1390. [DOI] [PubMed] [Google Scholar]
- Coombs JS, Curtis DR, Eccles JC. The generation of impulses in motoneurones. J. Physiol. 1957;139:232–249. doi: 10.1113/jphysiol.1957.sp005888. [DOI] [PMC free article] [PubMed] [Google Scholar]
- Cooper EC, Harrington E, Jan YN, Jan LY. M channel KCNQ2 subunits are localized to key sites for control of neuronal network oscillations and synchronization in mouse brain. J. Neurosci. 2001;21:9529–9540. doi: 10.1523/JNEUROSCI.21-24-09529.2001. [DOI] [PMC free article] [PubMed] [Google Scholar]
- Courtemanche R, Lamarre Y. Local field potential oscillations in primate cerebellar cortex: synchronization with cerebral cortex during active and passive expectancy. J. Neurophysiol. 2005;93:2039–2052. doi: 10.1152/jn.00080.2004. [DOI] [PubMed] [Google Scholar]
- Cunningham MO, Whittington MA, Bibbig A, Roopun A, LeBeau FEN, Vogt A, Monyer H, Buhl EH, Traub RD. A role for fast rhythmic bursting neurons in cortical gamma oscillations in vitro. Proc. Natl. Acad. Sci. USA. 2004a;101:7152–7157. doi: 10.1073/pnas.0402060101. [DOI] [PMC free article] [PubMed] [Google Scholar]
- Cunningham MO, Halliday DM, Davies CH, Traub RD, Buhl EH, Whittington MA. Coexistence of gamma and high-frequency oscillations in the medial entorhinal cortex in vitro. J. Physiol. 2004b;559:347–353. doi: 10.1113/jphysiol.2004.068973. [DOI] [PMC free article] [PubMed] [Google Scholar]
- Demer JL, Echelman D, Robinson DA. Effects of electrical stimulation and reversible lesions of the olivocerebellar pathway on Purkinje cell activity in the flocculus of the cat. Brain Res. 1985;346:22–31. doi: 10.1016/0006-8993(85)91090-x. [DOI] [PubMed] [Google Scholar]
- De Schutter E, Bower JM. An active membrane model of the cerebellar Purkinje cell I. Simulation of current clamps in slice. J. Neurophysiol. 1994a;71:375–400. doi: 10.1152/jn.1994.71.1.375. [DOI] [PubMed] [Google Scholar]
- De Schutter E, Bower JM. An active membrane model of the cerebellar Purkinje cell II. Simulation of synaptic responses. J. Neurophysiol. 1994b;71:401–419. doi: 10.1152/jn.1994.71.1.401. [DOI] [PubMed] [Google Scholar]
- Draguhn A, Traub RD, Schmitz D, Jefferys JGR. Electrical coupling underlies high-frequency oscillations in the hippocampus in vitro. Nature. 1998;394:189–192. doi: 10.1038/28184. [DOI] [PubMed] [Google Scholar]
- Eccles JC, Ito M, Szentágothai J. The Cerebellum as a Neuronal Machine. New York: Springer; 1967. [Google Scholar]
- Erdös P, Rényi A. On the evolution of random graphs. Publ. Math. Instit. Hungar. Acad. Sci. 1960;5:17–61. [Google Scholar]
- Gobel S. Axo-axonic septate junctions in the basket formations of the cat cerebellar cortex. J. Cell Biol. 1971;51:328–333. doi: 10.1083/jcb.51.1.328. [DOI] [PMC free article] [PubMed] [Google Scholar]
- Grieco TM, Raman IM. Production of resurgent current in Nav1.6-null Purkinje neurons by slowing sodium channel inactivation with β-pompilidotoxin. J. Neurosci. 2004;24:35–42. doi: 10.1523/JNEUROSCI.3807-03.2004. [DOI] [PMC free article] [PubMed] [Google Scholar]
- Hamzei-Sichani F, Kamasawa N, Janssen WGM, Yasamura T, Davidson KGV, Hof PR, Wearne SL, Stewart MG, Young SR, Whittington MA, Rash JE, Traub RD. Gap junctions on hippocampal mossy fiber axons demonstrated by thin-section electron microscopy and freeze-fracture replica immunogold labeling. Proc. Natl. Acad. Sci. USA. 2007;104:12548–12553. doi: 10.1073/pnas.0705281104. [DOI] [PMC free article] [PubMed] [Google Scholar]
- Jaeger D, De Schutter E, Bower JM. The role of synaptic and voltage-gated currents in the control of Purkinje cell spiking: a modeling study. J. Neurosci. 1997;17:91–106. doi: 10.1523/JNEUROSCI.17-01-00091.1997. [DOI] [PMC free article] [PubMed] [Google Scholar]
- Kato T, Hirano A. A Golgi study of the proximal portion of the human Purkinje cell axon. Acta Neuropathol. 1985;68:191–195. doi: 10.1007/BF00690193. [DOI] [PubMed] [Google Scholar]
- Kawai H, Lazar R, Metherate R. Nicotinic control of axon excitability regulates thalamocortical transmission. Nat Neurosci. 2007;10:1168–1175. doi: 10.1038/nn1956. [DOI] [PubMed] [Google Scholar]
- Kay AR, Sugimori M, Llinás R. Kinetic and stochastic properties of a persistent sodium current in mature guinea pig cerebellar Purkinje cells. J. Neurophysiol. 1998;80:1167–1179. doi: 10.1152/jn.1998.80.3.1167. [DOI] [PubMed] [Google Scholar]
- Khaliq ZM, Raman IM. Axonal propagation of simple and complex spikes in cerebellar Purkinje neurons. J. Neurosci. 2005;25:454–463. doi: 10.1523/JNEUROSCI.3045-04.2005. [DOI] [PMC free article] [PubMed] [Google Scholar]
- Khaliq ZM, Raman IM. Relative contributions of axonal and somatic Na channels to action potential initiation in cerebellar Purkinje neurons. J. Neurosci. 2006;26:1935–1944. doi: 10.1523/JNEUROSCI.4664-05.2006. [DOI] [PMC free article] [PubMed] [Google Scholar]
- Korn H, Sotelo C, Bennett MVL. The lateral vestibular nucleus of the toadfish Opsanus tau: ultrastructural and electrophysiological observations with special reference to electrotonic transmission. Neuroscience. 1977;2:851–884. [Google Scholar]
- Lang EJ, Sugihara I, Welsh JP, Llinás R. Patterns of spontaneous Purkinje cell complex spike activity in the awake rat. J. Neurosci. 1999;19:2728–2739. doi: 10.1523/JNEUROSCI.19-07-02728.1999. [DOI] [PMC free article] [PubMed] [Google Scholar]
- LeBeau FEN, Towers SK, Traub RD, Whittington MA, Buhl EH. Fast network oscillations induced by potassium transients in the rat hippocampus in vitro. J. Physiol. 2002;542:167–179. doi: 10.1113/jphysiol.2002.015933. [DOI] [PMC free article] [PubMed] [Google Scholar]
- LeBeau FEN, Towers SK, Traub RD, Whittington MA, Buhl EH. Fast network oscillations induced by potassium transients in the rat hippocampus in vitro. J. Physiol. 2002;542:167–179. doi: 10.1113/jphysiol.2002.015933. [DOI] [PMC free article] [PubMed] [Google Scholar]
- Lewis TJ, Rinzel J. Self-organized synchronous oscillations in a network of excitable cells coupled by gap junctions. Network: Comput. Neural Syst. 2000;11:299–320. [PubMed] [Google Scholar]
- Llinás R, Sugimori M. Electrophysiological properties of in vitro Purkinje cell somata in mammalian cerebellar slices. J. Physiol. 1980a;305:171–195. doi: 10.1113/jphysiol.1980.sp013357. [DOI] [PMC free article] [PubMed] [Google Scholar]
- Llinás R, Sugimori M. Electrophysiological properties of in vitro Purkinje cell dendrites in mammalian cerebellar slices. J. Physiol. 1980b;305:197–213. doi: 10.1113/jphysiol.1980.sp013358. [DOI] [PMC free article] [PubMed] [Google Scholar]
- Maex R, De Schutter E. Mechanism of spontaneous and self-sustained oscillations in networks connected through axo-axonal gap junctions. Eur. J. Neurosci. 2007;25:3347–3358. doi: 10.1111/j.1460-9568.2007.05593.x. [DOI] [PubMed] [Google Scholar]
- Martina M, Schultz JH, Ehmke H, Monyer H, Jonas P. Functional and molecular differences between voltage-gated K+ channels of fast-spiking interneurons and pyramidal neurons of rat hippocampus. J. Neurosci. 1998;18:8111–8125. doi: 10.1523/JNEUROSCI.18-20-08111.1998. [DOI] [PMC free article] [PubMed] [Google Scholar]
- Martina M, Yao GL, Bean BP. Properties and functional role of voltage-dependent potassium channels in dendrites of rat cerebellar Purkinje neurons. J. Neurosci. 2003;23:5698–5707. doi: 10.1523/JNEUROSCI.23-13-05698.2003. [DOI] [PMC free article] [PubMed] [Google Scholar]
- Middleton SJ. Ph.D. Thesis. University of Leeds; 2005. Oscillatory activity in the mouse cerebellum in vitro. [Google Scholar]
- Middleton SJ, Racca C, Cunningham MO, Traub RD, Monyer H, Knöpfel T, Schofield IS, Jenkins A, Whittington MA. High frequency network oscillations in cerebellar cortex. Neuron. 2008;58:1–12. doi: 10.1016/j.neuron.2008.03.030. [DOI] [PMC free article] [PubMed] [Google Scholar]
- Miyasho T, Takagi H, Suzuki H, Watanabe S, Inoue M, Kudo Y, Miyakawa H. Low-threshold potassium channels and a low-threshold calcium channel regulate Ca2+ spike firing in the dendrites of cerebellar Purkinje neurons: a modeling study. Brain Res. 2001;891:106–115. doi: 10.1016/s0006-8993(00)03206-6. [DOI] [PubMed] [Google Scholar]
- Nimmrich V, Maier N, Schmitz D, Draguhn A. Induced sharp wave-ripple complexes in the absence of synaptic inhibition in mouse hippocampal slices. J. Physiol. 2005;563:663–670. doi: 10.1113/jphysiol.2004.079558. [DOI] [PMC free article] [PubMed] [Google Scholar]
- Pais I, Hormuzdi SG, Monyer H, Traub RD, Wood IC, Buhl EH, Whittington MA, LeBeau FEN. Sharp wave-like activity in the hippocampus in vitro in mice lacking the gap junction protein connexin 36. J. Neurophysiol. 2003;89:2046–2054. doi: 10.1152/jn.00549.2002. [DOI] [PubMed] [Google Scholar]
- Palay SL, Chan-Palay V. The Cerebellar Cortex. New York: Springer; 1974. [Google Scholar]
- Quian Quiroga R, Nadasdy Z, Ben-Shaul Y. Unsupervised spike detection and sorting with wavelets and superparamagnetic clustering. Neural Computation. 2004;16:1667–1687. doi: 10.1162/089976604774201631. [DOI] [PubMed] [Google Scholar]
- Rapp M, Segev I, Yarom Y. Physiology, morphology and detailed passive models of guinea-pig cerebellar Purkinje cells. J. Physiol. 1994;474:101–118. doi: 10.1113/jphysiol.1994.sp020006. [DOI] [PMC free article] [PubMed] [Google Scholar]
- Rash JE, Olson CO, Pouliot WA, Davidson KG, Yasumura T, Furman CS, Royer S, Kamasawa N, Nagy JI, Dudek FE. Connexin36 vs. connexin32, “miniature” neuronal gap junctions, and limited electrotonic coupling in rodent suprachiasmatic nucleus. Neuroscience. 2007;149:350–371. doi: 10.1016/j.neuroscience.2007.06.052. [DOI] [PMC free article] [PubMed] [Google Scholar]
- Roopun A, Middleton SJ, Cunningham MO, LeBeau FEN, Bibbig A, Whittington MA, Traub RD. A beta2-frequency (20–30 Hz) oscillation in non-synaptic networks of somatosensory cortex. Proc. Natl. Acad. Sci. USA. 2006;103:15646–15650. doi: 10.1073/pnas.0607443103. [DOI] [PMC free article] [PubMed] [Google Scholar]
- Roth A, Häusser M. Compartmental models of rat cerebellar Purkinje cells based on simultaneous somatic and dendritic patch-clamp recordings. J. Physiol. 2001;535:445–472. doi: 10.1111/j.1469-7793.2001.00445.x. [DOI] [PMC free article] [PubMed] [Google Scholar]
- Schmitz D, Schuchmann S, Fisahn A, Draguhn A, Buhl EH, Petrasch-Parwez RE, Dermietzel R, Heinemann U, Traub RD. Axo-axonal coupling: a novel mechanism for ultrafast neuronal communication. Neuron. 2001;31:831–840. doi: 10.1016/s0896-6273(01)00410-x. [DOI] [PubMed] [Google Scholar]
- Servais L, Bearzatto B, Schwaller B, Dumont M, De Saedeleer C, Dan B, Barski JJ, Schiffmann SN, Cheron G. Mono- and dual-frequency fast cerebellar oscillation in mice lacking parvalbumin and/or calbindin D-28k. Eur. J. Neurosci. 2005;22:861–870. doi: 10.1111/j.1460-9568.2005.04275.x. [DOI] [PubMed] [Google Scholar]
- Servais L, Cheron G. Purkinje cell rhythmicity and synchronicity during modulation of fast cerebellar oscillation. Neuroscience. 2005;134:1247–1259. doi: 10.1016/j.neuroscience.2005.06.001. [DOI] [PubMed] [Google Scholar]
- Servais L, Hourez R, Bearzatto B, Gall D, Schiffmann SN, Cheron G. Purkinje cell dysfunction and alteration of long-term synaptic plasticity in fetal alcohol syndrome. Proc. Natl. Acad. Sci. USA. 2007;104:9858–9863. doi: 10.1073/pnas.0607037104. 2007. [DOI] [PMC free article] [PubMed] [Google Scholar]
- Shu Y, Yu Y, Yang J, McCormick DA. Selective control of cortical axonal spikes by a slowly inactivating K+ current. Proc. Natl. Acad. Sci. USA. 2007;104:11453–11458. doi: 10.1073/pnas.0702041104. [DOI] [PMC free article] [PubMed] [Google Scholar]
- Shu Y, Duque A, Yu Y, Haider B, McCormick DA. Properties of action-potential initiation in neocortical pyramidal cells: evidence from whole cell axon recordings. J. Neurophysiol. 2007;97:746–760. doi: 10.1152/jn.00922.2006. [DOI] [PubMed] [Google Scholar]
- Sotelo C, Llinás R. Specialized membrane junctions between neurons in the vertebrate cerebellar cortex. J. Cell Biol. 1972;53:271–289. doi: 10.1083/jcb.53.2.271. [DOI] [PMC free article] [PubMed] [Google Scholar]
- Srinivas M, Rozental R, Kojima T, Dermietzel R, Mehler M, Condorelli DF, Kessler JA, Spray DC. Functional properties of channels formed by the neuronal gap junction protein connexn36. J. Neurosci. 1999;19:9848–9855. doi: 10.1523/JNEUROSCI.19-22-09848.1999. [DOI] [PMC free article] [PubMed] [Google Scholar]
- Stuart G, Häusser M. Initiation and spread of sodium action potentials in cerebellar Purkinje cells. Neuron. 1994;13:703–712. doi: 10.1016/0896-6273(94)90037-x. [DOI] [PubMed] [Google Scholar]
- Takács J, Hámori J. Developmental dynamics of Purkinje cells and dendritic spines in rat cerebellar cortex. J. Neurosci. Res. 1994;38:515–530. doi: 10.1002/jnr.490380505. [DOI] [PubMed] [Google Scholar]
- Traub RD, Jefferys JGR, Miles R, Whittington MA, Tóth K. A branching dendritic model of a rodent CA3 pyramidal neurone. J. Physiol. 1994;481:79–95. doi: 10.1113/jphysiol.1994.sp020420. [DOI] [PMC free article] [PubMed] [Google Scholar]
- Traub RD, Schmitz D, Jefferys JGR, Draguhn A. High-frequency population oscillations are predicted to occur in hippocampal pyramidal neuronal networks interconnected by axoaxonal gap junctions. Neuroscience. 1999;92:407–426. doi: 10.1016/s0306-4522(98)00755-6. [DOI] [PubMed] [Google Scholar]
- Traub RD, Bibbig A. A model of high-frequency ripples in the hippocampus, based on synaptic coupling plus axon-axon gap junctions between pyramidal neurons. J. Neurosci. 2000;20:2086–2093. doi: 10.1523/JNEUROSCI.20-06-02086.2000. [DOI] [PMC free article] [PubMed] [Google Scholar]
- Traub RD, Draguhn A, Whittington MA, Baldeweg T, Bibbig A, Buhl EH, Schmitz D. Axonal gap junctions between principal neurons: A novel source of network oscillations, and perhaps epileptogenesis. Reviews in the Neurosciences. 2002;13:1–30. doi: 10.1515/revneuro.2002.13.1.1. [DOI] [PubMed] [Google Scholar]
- Traub RD, Cunningham MO, Gloveli T, LeBeau FEN, Bibbig A, Buhl EH, Whittington MA. GABA-enhanced collective behavior in neuronal axons underlies persistent gamma-frequency oscillations. Proc. Natl. Acad. Sci. USA. 2003a;100:11047–11052. doi: 10.1073/pnas.1934854100. [DOI] [PMC free article] [PubMed] [Google Scholar]
- Traub RD, Pais I, Bibbig A, LeBeau FEN, Buhl EH, Hormuzdi SG, Monyer H, Whittington MA. Contrasting roles of axonal (pyramidal cell) and dendritic (interneuron) electrical coupling in the generation of gamma oscillations in the hippocampus in vitro. Proc. Natl. Acad. Sci. USA. 2003b;100:1370–1374. doi: 10.1073/pnas.0337529100. [DOI] [PMC free article] [PubMed] [Google Scholar]
- Traub RD, Contreras D, Cunningham MO, Murray H, LeBeau FEN, Roopun A, Bibbig A, Wilent WB, Higley MJ, Whittington MA. Single-column thalamocortical network model exhibiting gamma oscillations, sleep spindles and epileptogenic bursts. J. Neurophysiol. 2005;93:2194–2232. doi: 10.1152/jn.00983.2004. [DOI] [PubMed] [Google Scholar]
- Watanabe S, Takagi H, Miyasho T, Inoue M, Kirino Y, Kudo Y, Miyakawa H. Differential roles of two types of voltage-gated Ca2+ channels in the dendrites of rat cerebellar Purkinje neurons. Brain Res. 1998;791:43–55. doi: 10.1016/s0006-8993(98)00048-1. [DOI] [PubMed] [Google Scholar]
- Yasargil GM, Sandri C. Morphology of the Mauthner axon inhibitory system in tench (Tinca tinca L.) spinal cord. Neurosci. Lett. 1987;81:63–68. doi: 10.1016/0304-3940(87)90341-7. [DOI] [PubMed] [Google Scholar]