The family of 3 G-protein coupled receptors1–7 includes the sweet receptor, metabotropic glutamate receptors (mGluRs), calcium-sensing receptors, pheromone receptors, and other taste/olfactory receptors.8 The sweet receptor (190 kDa) consists of two heterodimeric subunits: T1R2 and T1R3. Each T1R subunit contains a large extracellular domain called the Venus FlyTrap Module (VFTM, ~550 aa), linked via a Cysteine-Rich Domain (CRD, ~60 aa) to a seven-Trans Membrane Domain (TMD, ~260 aa).3,9,10
The sweet receptor interacts with a variety of chemically and structurally diverse natural and synthetic sweet ligands3 through multiple binding sites, which have been mapped to at least four domains of the receptor.9,10,11 Natural sugars bind to the VFTM clefts of both T1Rs, although they may function differently in each cleft.1 Because some artificial sweeteners, such as the dipeptide sweeteners (aspartame, alitame, neotame), SC45647, and sucralose, interact with the T1R2 cleft, it has been proposed that the occupation of multiple overlapping sites present within this cleft leads to activation of the receptor.1,3,9,10,12 The TM of T1R3 has been shown to have overlapping binding sites for different ligands, cyclamate (activating)10 and lactisole (inactivating),9 located within the intra-helical space of the TM barrel near its extracellular side. Human-specific sweet proteins, such as brazzein and monellin, interact with larger surfaces that include the CRD region of T1R3 and the VFTM of T1R2.12 The discovery of diverse ligand binding sites in multiple domains of the sweet receptor11 raises the related questions of how individual binding events lead to a common activating output, where that output occurs, and whether the TM of T1R2 plays a role in binding sweet ligands and/or transduction of the activation signal.
The low affinity of the receptor for sweeteners makes traditional binding assays unreliable owing to high background noise from μM to mM ligand concentrations required to activate the receptor.13,14 Ideally, it would be useful to distinguish complex modes of ligand interactions with the receptor from similar or different binding sites but this requires detailed studies at the atomic level. Furthermore, simultaneous monitoring of ligand binding to the membrane-spanning domains and/or the large extracellular VFTM domains requires that the receptor be in a “native” state.
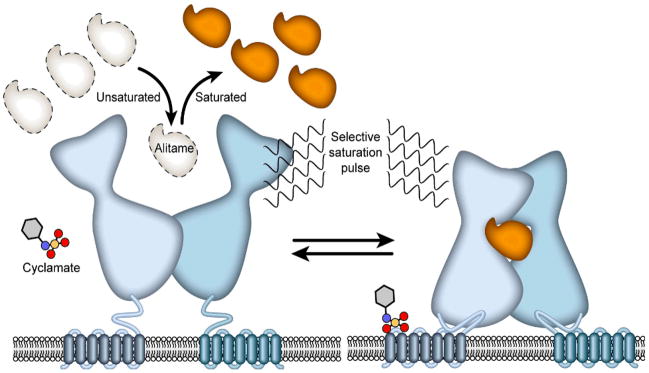
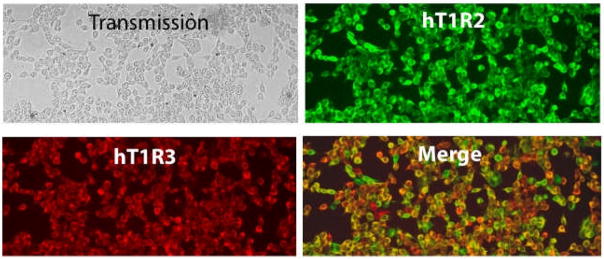
Here we report a general and sensitive assay for sweet receptor/ligand binding interactions that utilizes saturation transfer difference (STD) and saturation transfer double difference (STDD) NMR spectroscopy (Figure 1).15–18 We have used this approach to investigate the binding interactions of small sweet ligands and a sweet protein (brazzein) with stably- or transiently-expressed sweet receptor in HEK cells (Figure 2) and in membrane preparations derived from these cells.
Figure 1.
Scheme illustrating the use of STD NMR to monitor interactions between a membrane receptor and ligand. A 1H NMR pulse applied selectively to the receptor is rapidly transferred by spin diffusion throughout the receptor. This saturation is transferred to a bound ligand, which, upon its release from the receptor, adds to the pool of saturated ligand present in excess over the receptor. The build-up of saturation in the ligand pool is governed by a number of factors, including the on and off rates for ligand binding, the rotational correlation time for the complex, and the relaxation rates of ligand signals.
Figure 2.
Evidence that the heterodimeric sweet taste receptor is expressed and displayed on the of human embryonic kidney (HEK293) cells. Monoclonal mouse–Flag for hT1R2-flag with Alexa488-conjugated goat–mouse secondary antibodies (upper right) and polyclonal rabbit–T1R3 antibody with Alexa594-conjugated goat–rabbit secondary antibodies (lower left) were used to assess the stable heterologous expression of sweet taste receptor in HEK293 cells in the merge image (lower right) as compared to total cell density in transmission (upper left) to account for those cells not expressing either T1R2 or T1R3. Results showed <1% non-expressing cells; ~1% hT1R3-only expressing cells; and ~5% hT1R2-only expressing cells. The parental cell line showed no signal with either antibody (data not shown).
We demonstrate how this approach can be used to obtain detailed information about molecular interactions between a membrane receptor and its functional ligands. 1) The approach provides detailed information about ligand affinity and the nature of the binding site at the atomic level. 2) It allows study of the ligand interaction in competitive or noncompetitive circumstances. 3) Only a very small amount of receptor (pmol to μmol) is required to detect ligand binding from changes in the signal of the free ligand present in excess. 4) The method can be used to examine the properties of receptors in cells under physiological conditions (in vivo) or receptors in isolated native or reconstituted membranes. 5) The method should be applicable to high-throughput screening of compound libraries, sweet protein variants, or receptor mutants (details in Supporting Information).
Previously, it was shown that STD NMR can be applied to platelets, vesicles, and living cells.15,18–20 Cells displaying receptors on their surface are ideal substrates for monitoring ligand-receptor interactions by STD NMR. However, previous experiments utilizing cells suffered from low signal-to-noise due to high background. Our assay takes advantage of major changes to overcome these problems. The use of membrane preparations as compared to cells greatly increases signal-to-noise while preserving functional binding and activity (Supporting Information). Furthermore, with membrane preparations it is possible to determine the receptor concentration (typically 10–100 nM) to ensure that it is consistent with surface receptor protein expression19 and also within the preferred range for STD NMR (nM–mM). We achieved these conditions by using membrane protein concentrations of 7.5–10 mg/mL. At a given receptor concentration we optimized the STD response by varying the ligand concentration according to its known approximate Kd value. To distinguish between STD signals from functional receptor interactions and non-specific interactions, we utilized control membrane preparations lacking receptor. Subtraction of the STD spectrum from the control with no receptors from that of the experimental containing active receptors yielded a double difference spectrum (STDD) containing signals only from specific interactions. We used this approach to investigate interactions between sweet ligands and the sweet receptor (Supporting Information). To confirm that receptors are expressed and displayed on the cell surface prior to membrane isolation, we used antibodies specifically against N-terminal tags of either subunit (Figure 2).
To demonstrate the general use of STD assays for small ligands, we investigated a medium affinity ligand (alitame, Kd = 50 μM) and a low affinity ligand (cyclamate, Kd = 2 mM) (Supporting Information). Alitame binding has been mapped to the VFTM of T1R2, and cyclamate binding has been mapped to TMD of T1R3.9,10 The results confirmed that these two ligands bind non-competitively.
Interactions between the receptor and sweet proteins are far more complex than those with small ligands. Mutagenesis studies of both receptor and sweet proteins indicate multi-point binding interactions.12,21,22 We show here that STDD can be applied to membranes from stable cell lines expressing the wild type hT1R2+hT1R3 sweet receptor to monitor brazzein sweet protein binding to the sweet receptor (Figure 3). As predicted, strong STD signals were observed only for wild-type brazzein, whereas a non-sweet mutant (A16C17) yielded very weak STD signals (just above the noise level). STD NMR binding experiments should enable detailed investigation of the extensive interface between protein sweeteners and the sweet receptor to provide insight into the mechanism of signal transduction.
Figure 3.
Comparison of the interaction between (A) wild-type and (B) non-sweet brazzein mutant A16C17 with the wild-type sweet receptor (hT1R2+hT1R3) in membranes isolated from HEK+r cells as detected by one-dimensional 1H-15N HSQC saturation transfer double difference spectroscopy (STDD). Membranes (75–100 μg) were resuspended in 150 μL perdeuterated PBS (phosphate buffered saline: 10 mM Na-phosphate buffer, 137 mM NaCl, and 2.7 mM KCl, pH 7.4). [U-15N]-Brazzein or A16C17 (3–5 mg) was added to the membrane preparation prior to data collection. NMR data were collected on a Varian 800 MHz spectrometer equipped with a cryogenic probe. Top trace: experiment (negative control). Middle trace: STD spectra of membrane preparations containing the receptor minus STD spectra of membrane preparations without receptor (STDD). Bottom trace: 1D 15N-selected 1H NMR spectra of each brazzein variant.
Supplementary Material
Acknowledgments
This research was supported by NIH grants P41 RR02301, which funds the National Magnetic Resonance Facility at Madison, R01 DC006696, R01 DC008301, and R21 DC008805-02. We thank William M. Westler and Hamid Eghbalnia for helpful discussions and Adam Steinberg for artwork.
Footnotes
Supporting Information Available: Functional activity assay. STD NMR study of alitame and cyclamate binding to the sweet receptor in intact cells and isolated membranes. NMR pulse program used to investigate brazzein-receptor interactions. This material is available free of charge via the internet at http://pubs.acs.org.
References
- 1.Li X, Staszewski L, Xu H, Durick K, Zoller M, Adler E. Proc Natl Acad Sci USA. 2002;99:4692–4696. doi: 10.1073/pnas.072090199. [DOI] [PMC free article] [PubMed] [Google Scholar]
- 2.Max M, Shanker YG, Huang L, Rong M, Liu Z, Campagne F, Weinstein H, Damak S, Margolskee RF. Nat Genet. 2001;28:58–63. doi: 10.1038/ng0501-58. [DOI] [PubMed] [Google Scholar]
- 3.Nelson G, Hoon MA, Chandrashekar J, Zhang Y, Ryba NJ, Zuker CS. Cell. 2001;106:381–390. doi: 10.1016/s0092-8674(01)00451-2. [DOI] [PubMed] [Google Scholar]
- 4.Montmayeur JP, Liberles SD, Matsunami H, Buck LB. Nat Neurosci. 2001;4:492–498. doi: 10.1038/87440. [DOI] [PubMed] [Google Scholar]
- 5.Hoon MA, Adler E, Lindemeier J, Battey JF, Ryba NJ, Zuker CS. Cell. 1999;96:541–551. doi: 10.1016/s0092-8674(00)80658-3. [DOI] [PubMed] [Google Scholar]
- 6.Sainz E, Korley JN, Battey JF, Sullivan SL. Journal of Neurochemistry. 2001;77:896–903. doi: 10.1046/j.1471-4159.2001.00292.x. [DOI] [PubMed] [Google Scholar]
- 7.Kitagawa M, Kusakabe Y, Miura H, Ninomiya Y, Hino A. Biochem Biophys Res Commun. 2001;283:236–242. doi: 10.1006/bbrc.2001.4760. [DOI] [PubMed] [Google Scholar]
- 8.Pin JP, Galvez T, Prezeau L. Pharmacol Ther. 2003;98:325–254. doi: 10.1016/s0163-7258(03)00038-x. [DOI] [PubMed] [Google Scholar]
- 9.Jiang P, Cui M, Zhao B, Liu Z, Snyder LA, Benard LM, Osman R, Margolskee RF, Max M. J Biol Chem. 2005;280:15238–15246. doi: 10.1074/jbc.M414287200. [DOI] [PubMed] [Google Scholar]
- 10.Jiang P, Cui M, Zhao B, Snyder LA, Benard LM, Osman R, Max M, Margolskee RF. J Biol Chem. 2005;280:34296–34305. doi: 10.1074/jbc.M505255200. [DOI] [PubMed] [Google Scholar]
- 11.Cui M, Jiang P, Maillet E, Max M, Margolskee RF, Osman R. Curr Pharm Des. 2006;12:4591–4600. doi: 10.2174/138161206779010350. [DOI] [PubMed] [Google Scholar]
- 12.Jiang P, Ji Q, Liu Z, Snyder LA, Benard LM, Margolskee RF, Max M. J Biol Chem. 2004;279:45068–4575. doi: 10.1074/jbc.M406779200. [DOI] [PubMed] [Google Scholar]
- 13.Cagin RH, Morris RW. Proc Natl Acad Sci USA. 1979;76:1692–1696. doi: 10.1073/pnas.76.4.1692. [DOI] [PMC free article] [PubMed] [Google Scholar]
- 14.Shimazaki K, Sato M, Takegami T. Biochim Biophys Acta. 1981;677:331–338. doi: 10.1016/0304-4165(81)90244-0. [DOI] [PubMed] [Google Scholar]
- 15.Klein J, Meinecke R, Mayer M, Mayer B. J Am Chem Soc. 1999;121:5326–5337. [Google Scholar]
- 16.Corey EJ, Fuchs PL. J American Chemical Society. 1972;94:4015–18. doi: 10.1021/ja00766a062. [DOI] [PubMed] [Google Scholar]
- 17.Balaram P, Bothner-By AA, Dadok J. J American Chemical Society. 1972;94:4017–4018. [Google Scholar]
- 18.Mayer M, Mayer B. Angew Chem Int Ed. 1999;38:1784–1788. doi: 10.1002/(SICI)1521-3773(19990614)38:12<1784::AID-ANIE1784>3.0.CO;2-Q. [DOI] [PubMed] [Google Scholar]
- 19.Classen B, Axmann M, Meinecke R, Meyer B. J Am Chem Soc. 2005;127:916–919. doi: 10.1021/ja044434w. [DOI] [PubMed] [Google Scholar]
- 20.Mari S, Serrano-Gomez D, Canada FJ, Corbi AL, Jimenez-Barbero J. Angew Chem Int Ed. 2005;44:296–298. doi: 10.1002/anie.200461574. [DOI] [PubMed] [Google Scholar]
- 21.Assadi-Porter FM, Aceti DJ, Markley JL. Arch Biochem Biophys. 2000;376:259–265. doi: 10.1006/abbi.2000.1726. [DOI] [PubMed] [Google Scholar]
- 22.Kaneko R, Kitabatake N. Chem Senses. 2001;26:167–177. doi: 10.1093/chemse/26.2.167. [DOI] [PubMed] [Google Scholar]
Associated Data
This section collects any data citations, data availability statements, or supplementary materials included in this article.


