

Abstract
Type 2 diabetes mellitus (T2DM) increases the risk for Alzheimer disease (AD), but the underlying mechanism is unknown. In this study, we determined the levels of major brain glucose transporters (GLUT), O-GlcNAcylation and phosphorylation of tau in the postmortem brain tissue from frontal cortices of 7 controls, 11 T2DM subjects, 10 AD subjects and 8 additional subjects who had both T2DM and AD. We found that the neuronal GLUT3 was decreased to a bigger extent in T2DM brain than in AD brain. The O-GlcNAcylation levels of global proteins and of tau were also decreased in T2DM brain as seen in AD brain. Phosphorylation of tau at some of the AD abnormal hyperphosphorylation sites was increased in T2DM brain. These results suggest that T2DM may contribute to the increased risk for AD by impairing brain glucose uptake/metabolism and, consequently, down-regulation of O-GlcNAcylation, which facilitates abnormal hyperphosphorylation of tau.
Keywords: Alzheimer disease, Diabetes mellitus, O-GlcNAcylation, Glucose transporter, Tau phosphorylation, Human brain
Epidemiological studies have suggested that type 2 diabetes mellitus (T2DM) is a risk factor for Alzheimer disease (AD), the most devastating progressive neurodegenerative disease that causes dementia and eventually death of the affected individuals. T2DM is characterized by insulin resistance and the resultant metabolic abnormalities in the periphery. It was previously thought that insulin did not regulate glucose metabolism in the central nervous system. However, recent studies indicate that insulin signaling not only regulates glucose metabolism in the brain, but also plays important regulatory roles in neural development and neuronal activities and affects learning and memory (Gerozissis 2008).
Abnormal hyperphosphorylation of microtubule-associated protein tau causes neurodegeneration and the formation of neurofibrillary tangles, a hallmark brain lesion of AD (Wang and Liu 2008; Iqbal et al. 2009). We recently found that altered O-GlcNAcylation, a unique type of O-linked glycosylation of nucleocytoplasmic proteins by a monosaccharide β-N-acetylglucosamine (O-GlcNAc), of tau links the impairment of brain glucose metabolism to hyperphosphorylation of tau (Liu et al. 2004; Li et al. 2006). On the basis of these findings, we hypothesize that the impairment of brain glucose metabolism contributes to neurodegeneration via down-regulation of O-GlcNAcylation, which is regulated by glucose metabolism, and the resultant abnormal hyperphosphorylation of tau (Gong et al. 2006). This hypothesis is further supported by our recent studies showing that the decreases in GLUT1 and GLUT3, the two major brain glucose transporters (GLUT) responsible for the transport of glucose from blood into the neuron, correlate to the decrease in protein O-GlcNAcylation and hyperphosphorylation of tau in AD brain (Liu et al. 2008). It is possible that T2DM contributes to increased risk for AD by the same mechanism, i.e., by decreased brain glucose metabolism and O-GlcNAcylation and the resultant abnormal hyperphosphorylation of tau. However, whether such type of changes occurs in T2DM brain has not been investigated.
In this study, we determined the levels of major brain GLUTs, protein O-GlcNAcylation and tau phosphorylation in the postmortem brains of individuals with T2DM and compared them with those in AD brain. We found that the neuronal GLUT3 was decreased to a bigger extent in T2DM brain than in AD brain and that O-GlcNAcylation was also decreased in T2DM brain as seen in AD brain. We further observed that tau was also abnormally hyperphosphorylated at several sites in T2DM brain. These findings provide new insight into the likely mechanism by which T2DM increases the risk for AD.
Materials and Methods
Human brain tissue
Autopsied human brain tissue was obtained from the Sun Health Research Institute Donation Program (Sun City, AZ). The use of the tissue was in accordance with the National Institutes of Health guidelines and was approved by our Institutional Review Board. The frontal cortices of 7 controls, 11 T2DM subjects, 10 AD subjects and 8 subjects who had both T2DM and AD (T2DM-AD) were used in this study (Table 1). All brain samples were confirmed pathologically and stored at −70 °C until use.
Table 1.
Human brain tissue used in this study
| Case # | Age at death (y) | Gender | PMIa (h) | Braak stageb | Tangle scorec |
|---|---|---|---|---|---|
| Con 1 | 83 | F | 3.3 | II | 0.75 |
| Con 2 | 85 | F | 2.8 | II | 5.00 |
| Con 3 | 82 | F | 2.0 | II | 4.25 |
| Con 4 | 70 | F | 2.0 | I | 0.00 |
| Con 5 | 82 | F | 2.3 | II | 3.50 |
| Con 6 | 85 | M | 3.2 | II | 4.25 |
| Con 7 | 80 | M | 3.3 | II | 2.75 |
| Mean±SD | 81.0±5.2 | 2.7±0.6 | 2.9±1.9 | ||
| T2DM 1 | 88 | F | 2.5 | III | 5.50 |
| T2DM 2 | 88 | F | 3.5 | III | 2.50 |
| T2DM 3 | 90 | F | 2.7 | III | 2.50 |
| T2DM 4 | 89 | M | 1.5 | IV | 7.00 |
| T2DM 5 | 80 | M | 2.2 | I | 1.00 |
| T2DM 6 | 87 | F | 2.0 | III | 4.50 |
| T2DM 7 | 79 | M | 2.0 | II | 2.50 |
| T2DM 8 | 87 | M | 2.5 | IV | 5.30 |
| T2DM 9 | 86 | M | 2.0 | III | 5.00 |
| T2DM 10 | 78 | M | 1.7 | I | 0.00 |
| T2DM 11 | 73 | M | 2.0 | III | 2.75 |
| Mean±SD | 84.1±5.6 | 2.2±0.5 | 3.5±2.1 | ||
| AD 1 | 83 | F | 3.0 | VI | 12.40 |
| AD 2 | 79 | F | 1.5 | VI | 14.66 |
| AD 3 | 73 | F | 2.0 | V | 15.00 |
| AD 4 | 78 | M | 1.8 | VI | 15.00 |
| AD 5 | 74 | M | 2.8 | VI | 14.66 |
| AD 6 | 81 | M | 3.0 | V | 11.00 |
| AD 7 | 76 | M | 2.3 | VI | 15.00 |
| AD 8 | 72 | M | 2.5 | VI | 15.00 |
| AD 9 | 76 | M | 4.0 | V | 15.00 |
| AD 10 | 78 | M | 1.8 | VI | 15.00 |
| Mean±SD | 77.0±3.5 | 2.5±0.8 | 14.3±1.4 | ||
| T2DM-AD 1 | 91 | M | 3.3 | V | 12.00 |
| T2DM-AD 2 | 86 | M | 3.0 | V | 11.25 |
| T2DM-AD 3 | 89 | F | 2.5 | VI | 15.00 |
| T2DM-AD 4 | 87 | F | 3.0 | V | 15.00 |
| T2DM-AD 5 | 83 | M | 3.3 | V | 12.00 |
| T2DM-AD 6 | 77 | M | 2.3 | VI | 15.00 |
| T2DM-AD 7 | 84 | F | 2.2 | V | 10.50 |
| T2DM-AD 8 | 84 | F | 3.0 | VI | 15.00 |
| Mean±SD | 85.1±4.3 | 2.8±0.4 | 13.2±2.0 | ||
PMI, postmortem interval.
Neurofibrillary pathology was staged according to Braak and Braak (Braak and Braak 1995).
Tangle score was a density estimate and was designated as none, sparse, moderate, or frequent (0, 1, 2, or 3 for statistics), as defined according to the CERAD AD criteria (Mirra et al. 1991). Five areas (frontal, temporal, parietal, hippocampal, and entorhinal) were examined, and the scores were added up for a maximum of 15.
Antibodies
The primary antibodies used in this study included polyclonal anti-GLUT1, anti-GLUT3 and anti–HIF-1α from Santa Cruz Biotechnology (Santa Cruz, CA); polyclonal anti-GLUT2 from Chemicon (Temecula, CA); monoclonal anti–HIF-1β from Abcam (Cambridge, MA); monoclonal anti-actin from Sigma-Aldrich (St. Louis, MO); monoclonal antibody (RL2) against O-GlcNAcylated proteins from Affinity Bioreagents (Golden, CO); phosphorylation-dependent and site-specific tau antibodies from BioSource International (Camarillo, CA); and monoclonal anti-GFAP from Sternberger Monoclonals (Lutherville, MD). The secondary antibodies were peroxidase-conjugated goat anti-rabbit or goat anti-mouse IgG from Jackson ImmunoResearch Laboratories (West Grove, PA).
Western blots and immuno-dot-blots
The frozen frontal cortices were homogenized in cold buffer containing 50 mM Tris-HCl (pH 7.4), 2.0 mM EDTA, 10 mM β-mercaptoethanol and 8.5% sucrose. The homogenates were centrifuged at 15,000×g for 10 min, and the resulting supernatants (crude extracts) were used for Western blot analyses after protein assay by modified Lowry method (Bensadoun and Weinstein 1976). Western blots were carried out by using 10% SDS-PAGE, and development of the blots by using enhanced chemiluminescence kit (Pierce Biotechnology, Rockford, IL). Densitometric quantification of protein bands in Western blots were analyzed by using TINA program (Rayrest IsotopenmeBgerate GmbH, Strau-benhardt, Germany). Levels of O-GlcNAcylation were also determined by immuno-dot-blot assay of the brain extracts, as described previously (Liu et al. 2002). Comparison of means among groups was analyzed by ANOVA using Statistica 6.0 (StatSoft, Inc. Tulsa, OK).
Immuno-affinity purification of tau
Tau was immuno-affinity–purified from human brain extracts in RIPA buffer (50 mM Tris-HCl, pH 7.4, 150 mM NaCl, 1% NP-40, 0.5% sodium deoxycholate, 0.1% sodium dodecyl sulfate, 50 mM NaF, 100 mM GlcNAc, 1.0 mM orthovanadate, 1.0 mM phenyl-methylsulfonyl fluoride and 2.0 μg/ml each of aprotinin, leupeptin and pepstatin) by using monoclonal antibody 43D (a phosphorylation-independent tau antibody generated in our laboratory), as described previously (Liu et al. 2004). Tau preparations purified with this method were free of IgG and other proteins.
Results
Neuronal GLUT3 is decreased in diabetic brains
We first determined the levels of three major brain GLUTs (GLUT1–3) in 11 T2DM and 7 age- and postmortem delay–matched control brains by quantitative Western blots. We found that the level of GLUT3 was significantly decreased in T2DM brains as compared with controls (Fig. 1), whereas there was no significant difference in GLUT1 and GLUT2 levels between the two groups. To investigate whether the decrease in neuronal GLUT3 results from down-regulation of hypoxia-inducible factor 1α (HIF-1α), the major transcription factor regulating expression of GLUTs, in T2DM brain, we determined its level by quantitative Western blots. However, no significant difference in the level of HIF-1α was found between T2DM and control brains (Fig. 1A, 1C).
Fig. 1.

Levels of GLUT1, GLUT2, GLUT3 and HIF-1α in T2DM and control brains. (a) Crude extract of the frontal cerebral cortex from 11 T2DM and 7 control cases was analyzed by Western blots developed with antibodies to GLUT1, GLUT2, GLUT3 or HIF-1α. Actin blot was included for a loading control. (b and c) The blots were quantified densitometrically, and data are presented as percentage of control group (mean ± SD; *, p<0.05).
Comparison of brain GLUTs between diabetes and AD
We previously reported down-regulation of GLUTs in AD brain (Liu et al. 2008). We thus compared the levels of GLUTs in T2DM brain with those in AD brain as well as in brains of individuals who suffered from both T2DM and AD (T2DM-AD). We found that GLUT3, which is the major neuronal GLUT, is decreased markedly in both T2DM and AD, whereas GLUT1 and GLUT2 levels were different in T2DM brain from those in AD brain (Fig. 2). GLUT1, which is localized in the endothelial cells of the blood-brain barrier, was decreased only in AD, but not in T2DM brain. GLUT2 level was unchanged in T2DM brain, but was increased dramatically in AD brain. In the T2DM-AD group, the GLUT1 and GLUT3 levels were similar to those of T2DM group, whereas the GLUT2 level was indistinguishable from that of the AD group.
Fig. 2.

Levels of GLUT1, GLUT2 and GLUT3 in the brains of controls and individuals with T2DM, AD and T2DM plus AD (T2DM-AD). The levels of GLUT1, GLUT2 and GLUT3 in the crude extract of the frontal cerebral cortex from 7 controls, 11 T2DM, 10 AD and 8 T2DM-AD cases was analyzed by quantitative Western blots. Data are presented as percentage of control group (mean ± SD; *, p<0.05 vs. controls; #, p<0.05 vs. T2DM group; &, p<0.05 vs. AD group).
O-GlcNAcylation of global proteins and of tau is down-regulated in diabetes and AD brains
Deficient glucose transport to the brain in T2DM and AD could have led to a decrease in protein O-GlcNAcylation. Therefore, we determined the level of protein O-GlcNAcylation by quantitative immuno-dot-blots and Western blots developed with the monoclonal antibody RL2 against O-GlcNAc. We found that the protein O-GlcNAcylation level in the brain extracts of T2DM, AD and T2DM-AD cases was reduced to approximately half of the control group (Fig. 3A). To learn if the level of O-GlcNAcylation of tau protein was also decreased similarly, we purified tau from human brains by an immuno-affinity purification method and then determined the O-GlcNAcylation level of the purified tau preparations. We found that tau O-GlcNAcylation level was significantly decreased in T2DM as compared with controls (Fig. 3B). The decrease was in a larger degree in AD and T2DM-AD groups, which reached to ~50% of the controls.
Fig. 3.
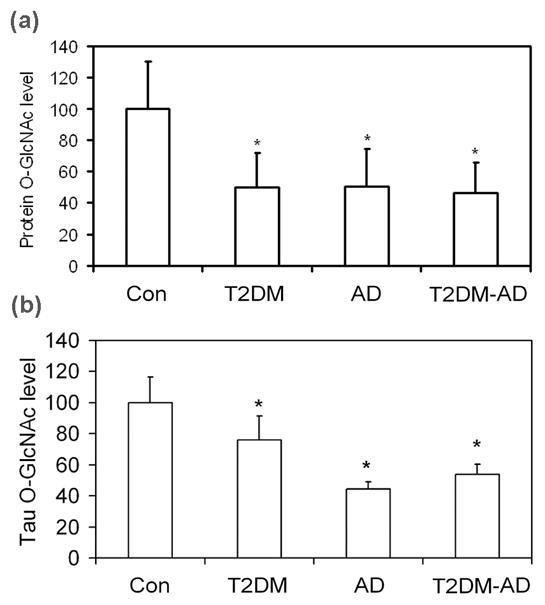
Levels of global protein O-GlcNAcylation and tau O-GlcNAcylation in the brains of individuals with T2DM, AD, T2DM plus AD (T2DM-AD) and controls. (a) The levels of protein O-GlcNAcylation in the crude extract of the frontal cerebral cortex from 7 controls, 11 T2DM, 10 AD and 8 T2DM-AD cases was analyzed by quantitative immuno-dot-blots and Western blots developed with monoclonal antibody RL2 against O-GlcNAc. Data are combined results from the two methods and are presented as percentage of the control group (mean ± SD; *, p<0.05 vs. control group). (b) Tau was first purified from human brains by using an immuno-affinity method with monoclonal tau antibody 43D, and the levels of O-GlcNAcylation of the purified tau was determined by quantitative immuno-dot-blots. Data are presented as percentage of the control group (mean ± SD; *, p<0.05 vs. control group).
Tau phosphorylation is increased in diabetic and in AD brains
To investigate if the decrease in GLUT3 and O-GlcNAcylation could contribute to tau pathology, we compared tau phosphorylation levels at several known major phosphorylation sites in the brain between T2DM and controls by using quantitative Western blots developed with phosphorylation-dependent and site-specific tau antibodies. We found that, among 10 phosphorylation sites studied, the mean tau phosphorylation levels at eight of these sites (except Thr205 and Thr231) were higher in T2DM than in control cases (Fig. 4). The increase in tau phosphorylation at four (Ser202, Thr217, ser262 and Ser396) of these 8 sites reached statistical significance. These results are consistent with the higher tangle scores and Braak stages in T2DM brain than in control brains (Table 1). Although the extents of tau phosphorylation in T2DM brains were much smaller than in AD brains, these results indicate a general increase in tau phosphorylation in T2DM.
Fig. 4.

Comparison of site-specific tau phosphorylation among T2DM, AD, T2DM-AD and controls. The levels of tau phosphorylation at individual phosphorylation sites in the crude extract of the frontal cerebral cortex from 7 controls, 11 T2DM, 10 AD and 8 T2DM-AD cases was analyzed by quantitative Western blots developed with antibodies that recognize tau phosphorylated at the individual phosphorylation sites indicated in each panel. The blots were then quantified densitometrically and normalized by the total tau levels, as determined by using antibody R134d. Data are presented as percentage of control group (mean ± SD; *, p<0.05 vs. controls; #, p<0.05 vs. T2DM group; &, p<0.05 vs. AD group). pS, phospho-serine; pT, phospho-threonine.
We also studied the levels of site-specific tau phosphorylation in brains of individuals with AD alone and with T2DM plus AD (T2DM-AD). As previously demonstrated (Yu et al. 2009), tau was found to be hyperphosphorylated at all the 10 sites examined in AD brain. Although tau was markedly hyperphosphorylated in both AD and T2DM-AD groups, the levels of the site-specific phosphorylation of tau were different between the two groups. As compared to AD brain, tau phosphorylation levels at sites located at the N-terminal half of tau (Thr181, Ser199, Ser202, Thr205, Thr217 and Thr231) was found to be much lower, whereas those at the C-terminal half (Ser262, Ser396, Ser404 and Ser422) were much higher in T2DM-AD than in AD brains (Fig. 4).
Discussion
We have recently demonstrated that O-GlcNAcylation regulates phosphorylation of tau negatively and that impaired brain glucose metabolism leads to hyperphosphorylation of tau via down-regulation of O-GlcNAcylation (Liu et al. 2004; Li et al. 2006). These findings led to a new hypothesis of a possible mechanism by which the impaired brain glucose metabolism contributes to neurodegeneration in AD (Gong et al. 2006). Because T2DM, which is characterized by impairment in the utilization of glucose, increases the risk for AD, it is interesting to explore whether T2DM could contribute to increased risk for AD by the same or similar mechanism, i.e., via down-regulation of O-GlcNAcylation and thus abnormal hyperphosphorylation of tau. In this study, we found, for the first time, that GLUT3 and tau O-GlcNAcylation were indeed decreased and tau phosphorylation was increased in T2DM brain. These findings provide direct evidence that supports our hypothesis. It is in consistent to our hypothesis that some diabetic changes resulted from insulin resistance, such as the Maillard-reaction-related modifications and protein glycation, had been observed in AD brain (Smith et al. 1994; Smith et al. 1996; Yan et al. 1995). Because insulin signaling is impaired in AD brain (Zhu et al. 2005; Steen et al. 2005; de la Monte and Wands 2005), there is similar abnormalities in the brains between T2DM and AD. Actually, AD was recently proposed to be the type 3 diabetes by de la Monte and her colleagues (Steen et al. 2005).
Brain neurons are unable to synthesize or store glucose, and thus they are fully dependent on glucose transport across the blood-brain barrier, which is facilitated by GLUTs. In mammalian brain, GLUT1 and GLUT3 are the predominant GLUTs responsible for glucose transport (McEwen and Reagan 2004). GLUT1 is highly expressed in the endothelial cells of the blood-brain barrier and is responsible for transporting glucose from blood into the extracellular space of the brain (Qutub and Hunt 2005; Schubert 2005). GLUT3 is the major neuronal GLUT and helps transport glucose from the extracellular space into the neurons (Dwyer et al. 2002). In addition, GLUT2 is expressed in astrocytes of the brain and is responsible to glucose transport into astrocytes. Decreased GLUT1 and GLUT3 have been observed in AD brain (Mooradian et al. 1997; Harr et al. 1995; Simpson et al. 1994; Kalaria and Harik 1989), and this decrease correlates to hyperphosphorylation of tau (Liu et al. 2008). In this study, we found that the GLUT3 level was also decreased in T2DM brain and this decrease was even more marked than that in AD brain, suggesting that the brain glucose uptake/metabolism might be severely compromised in T2DM. It is noted that the GLUT alterations in T2DM brain were different from that in AD brain, in which both GLUT1 and GLUT3 are decreased (Liu et al. 2008). These observations suggest that impaired brain glucose uptake/metabolism in T2DM may result from a mechanism different from AD. Unlike AD brain, in which the decrease of GLUT1 and GLUT3 appears to result from decreased HIF-1α (Liu et al. 2008), the major GLUT–regulating transcription factor (Chen et al. 2001; Hayashi et al. 2004; Maxwell et al. 1997; Zelzer et al. 1998), the level of HIF-1α was found to be unchanged in T2DM brains.
We noticed large variations in GLUT levels in both control and the diseased groups. We examined the variations against the case history and tissue handling, including age, gender, postmortem delay, and the severity of disease. We did not find any significant factors within our cohort which could explain the individual variations. Large individual variations of proteins, including GLUTs (Kalaria and Harik 1989; Mooradian et al. 1997), are actually common in human brain samples, probably due to variable individual genetic, metabolic, and environmental backgrounds. Nevertheless, with our sample size of 7–11 cases per group, we observed a decreased level of GLUT3 in T2DM brain and of both GLUT1 and GLUT3 in AD brain with statistical significance.
In contrast to GLUT1 and GLUT3, the level of GLUT2 in AD brain was found to be markedly increased, which is consistent to our previous report (Liu et al. 2008). The increase in GLUT2 in AD brain does not appear to indicate an increased expression of GLUT2 in astrocytes, because this increase disappears after the level of GLUT2 is normalized by the level of the astrocyte marker, glial fibrillary acidic protein (GFAP) (Liu et al. 2008). Thus, the increase of GLUT2 level in AD brain homogenates is most likely due simply to astrocyte over-activation, which is a well known phenomenon in AD brain (Skaper 2007). Instead, we speculate an impaired glucose uptake into astrocytes in AD brain, because this process requires both GLUT1, which transports glucose from the blood stream into the extracellular space and is decreased in AD brain, and GLUT2, which transports glucose from the extracellular space into astrocytes. In the present study, we did not find any significant change in GLUT2 level in T2DM brain, as compared to control brains. These results are consistent with our observation of no astrocyte over-activation in T2DM brain (data not shown).
We previously reported a decrease in O-GlcNAcylation of global proteins and of tau in AD brain (Liu et al. 2004; Liu et al. 2009). The present study reveals a similar decrease in T2DM and T2DM-AD brains. Thus, it appears that impaired brain glucose uptake/metabolism, although it might result from different mechanisms, leads to decreased O-GlcNAcylation in both T2DM and AD. Furthermore, increased phosphorylation of tau at several phosphorylation sites, as seen in AD brain, was also seen in T2DM brain. Although the extents of the decrease in global protein O-GlcNAcylation levels were similar between T2DM and AD, the specific tau O-GlcNAcylation level was found to be much lower in AD than that in T2DM (Fig. 3b). Because tau phosphorylation is negatively regulated by tau O-GlcNAcylation (Liu et al. 2004; Liu et al. 2009), the lower tau O-GlcNAcylation level in AD brain is consistent with the larger extents of tau hyperphosphorylation in AD brain than in T2DM brain. Taken together, our observations suggest that T2DM may increase the risk for AD via a decreased brain glucose uptake/metabolism due to down-regulation of GLUT3, leading to down-regulation of O-GlcNAcylation and consequent abnormal hyperphosphorylation of tau, which is crucial to the pathogenesis of AD (Fig. 5).
Fig. 5.
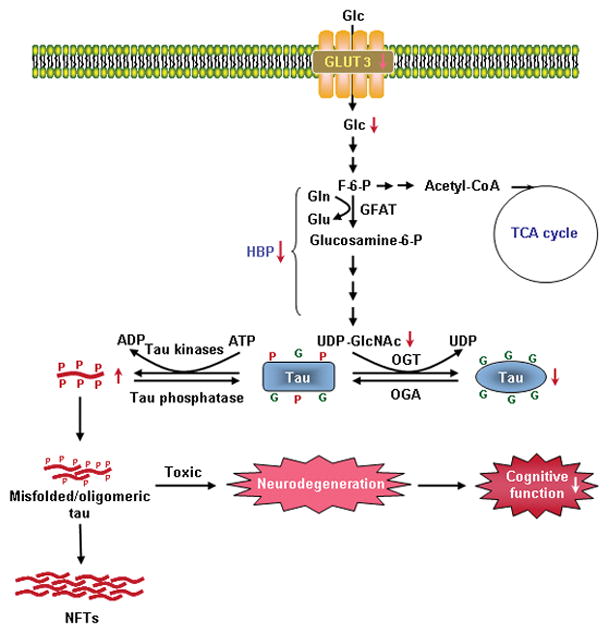
A proposed mechanism by which T2DM increases the risk for AD. In T2DM brain, decreased level of GLUT3 leads to a decrease in glucose uptake/metabolism. Decreased intraneuronal glucose metabolism results in decreased level of UDP-GlcNAc, which is a metabolic product of glucose via the hexosamine biosynthetic pathway (HBP). Because protein O-GlcNAcylation is mainly regulated by intracellular level of UDP-GlcNAc, a decrease of the latter then causes decreased tau O-GlcNAcylation. Because the latter regulates tau phosphorylation negatively, decreased O-GlcNAcylation thus facilitates hyperphosphorylation of tau, which, in turn, forms toxic tau oligomers and causes neurofibrillary degeneration and cognitive impairments. All these resultant consequences play active roles in the pathogenesis of AD. Abnormal hyperphosphorylation of tau also leads to the formation of neurofibrillary tangles (NFTs), a hallmark brain pathology of AD. In this figure, G on tau protein represents the O-GlcNAc group, and P represents the phosphate group. Abbreviations used in this figure: ADP, adenosine diphosphate; ATP, adenosine triphosphate; F-6-P, fructose-6-phosphate; Glc, glucose; GlcNAc, β-N-acetylglucosamine; Gln, glutamine; Glu, glutamate; GLUT, glucose transporter; OGA, O-GlcNAcase; OGT, O-GlcNAc transferase; TCA, tricarboxylic acid cycle; UDP, uridine diphosphate.
When we compared site-specific tau phosphorylation levels between AD and T2DM-AD, we found that, although tau is abnormally hyperphosphorylated in both groups, there were clear site-specific differences between pure AD and T2DM-AD groups. Notably, complication of AD with T2DM decreased hyperphosphorylation at the N-terminal half and exacerbated hyperphosphorylation at the C-terminal half of tau molecule, as compared to AD alone. The detail molecular mechanism leading to these discriminating impacts on tau hyperphosphorylation is currently unknown, but it might be related to possible deregulation of insulin signaling in T2DM brain (Moroz et al. 2008). It is worthy to note that these C-terminal phosphorylation sites of tau are among those that are most affected in a mouse model of decreased brain glucose metabolism induced by fasting (Liu et al. 2004; Li et al. 2006). Phosphorylation of tau at these sites also makes tau lose its biological activity to bind to microtubules (e.g., Ser262) (Biernat et al. 1993; Wang et al. 2007; Liu et al. 2007) and self-aggregate into neurofibrillary tangles, (e.g., Ser396/Ser404), one of the hallmark brain lesions of AD (Abraha et al. 2000; Haase et al. 2004; Liu et al. 2007). Therefore, T2DM might not only increase the risk for AD by promoting tau phosphorylation, but also accelerate AD by exacerbating tau hyperphosphorylation at the critical abnormal phosphorylation sites.
Most AD cases are sporadic and are believed to result from multiple etiological factors including genetic susceptibility and environmental and metabolic factors. It is important to note that our proposed mechanism—that impaired brain glucose uptake/metabolism contributes to neurodegeneration via down-regulation of O-GlcNAcylation and the resultant abnormal hyperphosphorylation of tau (Fig. 5) — could be just one of several mechanisms by which T2DM increases the risk for AD. Because glucose metabolism provides the primary fuel for the brain, impairment of brain glucose metabolism in T2DM could lead to deficient neurotransmitter synthesis, release and recycling, as well as other neuronal activities, which are all highly dependent on ATP produced via glucose metabolism. T2DM-induced cerebral vasculopathy could also contribute to AD and dementia (Cechetto et al. 2008).
In summary, in the present study we found that GLUT3 and tau O-GlcNAcylation were decreased and phosphorylation of tau was increased in T2DM brain. We further observed complication with T2DM affected abnormal hyperphosphorylation of tau in a site-specific manner. These findings suggest a possible mechanism by which T2DM may increase the risk for AD by facilitating abnormal hyperphosphorylation of tau.
Acknowledgments
This work was supported in part by funds from the New York State Office of Mental Retardation and Developmental Disabilities; NIH grants AG027429 and AG019158; and a U.S. Alzheimer’s Association grant (NIRG-08-91126). We thank Ms. Janet Murphy for secretarial assistance. We are also grateful to the Sun Health Research Institute Brain Donation Program of Sun City, Arizona, USA, for the provision of post-mortem human brain tissue. The Brain Donation Program is partially supported by a National Institute on Aging grant (P30 AG19610, Arizona Alzheimer’s Disease Core Center).
Abbreviations
- AD
Alzheimer disease
- GlcNAc
β-N-acetylglucosamine
- GLUT
glucose transporter
- HIF-1α
hypoxia-inducible factor 1α
- T2DM
type II diabetes mellitus
References
- Abraha A, Ghoshal N, Gamblin TC, Cryns V, Berry RW, Kuret J, Binder LI. C-terminal inhibition of tau assembly in vitro and in Alzheimer’s disease. J Cell Sci. 2000;113(Pt 21):3737–3745. doi: 10.1242/jcs.113.21.3737. [DOI] [PubMed] [Google Scholar]
- Bensadoun A, Weinstein D. Assay of proteins in the presence of interfering materials. Anal Biochem. 1976;70:241–250. doi: 10.1016/s0003-2697(76)80064-4. [DOI] [PubMed] [Google Scholar]
- Biernat J, Gustke N, Drewes G, Mandelkow EM, Mandelkow E. Phosphorylation of Ser262 strongly reduces binding of tau to microtubules: distinction between PHF-like immunoreactivity and microtubule binding. Neuron. 1993;11:153–163. doi: 10.1016/0896-6273(93)90279-z. [DOI] [PubMed] [Google Scholar]
- Braak H, Braak E. Staging of Alzheimer’s disease-related neurofibrillary changes. Neurobiol Aging. 1995;16:271–278. doi: 10.1016/0197-4580(95)00021-6. discussion 278–284. [DOI] [PubMed] [Google Scholar]
- Cechetto DF, Hachinski V, Whitehead SN. Vascular risk factors and Alzheimer’s disease. Expert Rev Neurother. 2008;8:743–750. doi: 10.1586/14737175.8.5.743. [DOI] [PubMed] [Google Scholar]
- Chen C, Pore N, Behrooz A, Ismail-Beigi F, Maity A. Regulation of glut1 mRNA by hypoxia-inducible factor-1. Interaction between H-ras and hypoxia. J Biol Chem. 2001;276:9519–9525. doi: 10.1074/jbc.M010144200. [DOI] [PubMed] [Google Scholar]
- de la Monte SM, Wands JR. Review of insulin and insulin-like growth factor expression, signaling, and malfunction in the central nervous system: relevance to Alzheimer’s disease. J Alzheimers Dis. 2005;7:45–61. doi: 10.3233/jad-2005-7106. [DOI] [PubMed] [Google Scholar]
- Dwyer DS, Vannucci SJ, Simpson IA. Expression, regulation, and functional role of glucose transporters (GLUTs) in brain. Int Rev Neurobiol. 2002;51:159–188. doi: 10.1016/s0074-7742(02)51005-9. [DOI] [PubMed] [Google Scholar]
- Gerozissis K. Brain insulin, energy and glucose homeostasis; genes, environment and metabolic pathologies. Eur J Pharmacol. 2008;585:38–49. doi: 10.1016/j.ejphar.2008.01.050. [DOI] [PubMed] [Google Scholar]
- Gong CX, Liu F, Grundke-Iqbal I, Iqbal K. Impaired brain glucose metabolism leads to Alzheimer neurofibrillary degeneration through a decrease in tau O-GlcNAcylation. J Alzheimers Dis. 2006;9:1–12. doi: 10.3233/jad-2006-9101. [DOI] [PubMed] [Google Scholar]
- Haase C, Stieler JT, Arendt T, Holzer M. Pseudophosphorylation of tau protein alters its ability for self-aggregation. J Neurochem. 2004;88:1509–1520. doi: 10.1046/j.1471-4159.2003.02287.x. [DOI] [PubMed] [Google Scholar]
- Harr SD, Simonian NA, Hyman BT. Functional alterations in Alzheimer’s disease: decreased glucose transporter 3 immunoreactivity in the perforant pathway terminal zone. J Neuropathol Exp Neurol. 1995;54:38–41. [PubMed] [Google Scholar]
- Hayashi M, Sakata M, Takeda T, et al. Induction of glucose transporter 1 expression through hypoxia-inducible factor 1alpha under hypoxic conditions in trophoblast-derived cells. J Endocrinol. 2004;183:145–154. doi: 10.1677/joe.1.05599. [DOI] [PubMed] [Google Scholar]
- Iqbal K, Liu F, Gong CX, Alonso AD, Grundke-Iqbal I. Mechanisms of tau-induced neurodegeneration. Acta Neuropathol. 2009 doi: 10.1007/s00401-009-0486-3. [DOI] [PMC free article] [PubMed] [Google Scholar]
- Kalaria RN, Harik SI. Reduced glucose transporter at the blood-brain barrier and in cerebral cortex in Alzheimer disease. J Neurochem. 1989;53:1083–1088. doi: 10.1111/j.1471-4159.1989.tb07399.x. [DOI] [PubMed] [Google Scholar]
- Li X, Lu F, Wang JZ, Gong CX. Concurrent alterations of O-GlcNAcylation and phosphorylation of tau in mouse brains during fasting. Eur J Neurosci. 2006;23:2078–2086. doi: 10.1111/j.1460-9568.2006.04735.x. [DOI] [PubMed] [Google Scholar]
- Liu F, Iqbal K, Grundke-Iqbal I, Hart GW, Gong CX. O-GlcNAcylation regulates phosphorylation of tau: a mechanism involved in Alzheimer’s disease. Proc Natl Acad Sci U S A. 2004;101:10804–10809. doi: 10.1073/pnas.0400348101. [DOI] [PMC free article] [PubMed] [Google Scholar]
- Liu F, Li B, Tung EJ, Grundke-Iqbal I, Iqbal K, Gong CX. Site-specific effects of tau phosphorylation on its microtubule assembly activity and self-aggregation. Eur J Neurosci. 2007;26:3429–3436. doi: 10.1111/j.1460-9568.2007.05955.x. [DOI] [PMC free article] [PubMed] [Google Scholar]
- Liu F, Shi J, Tanimukai H, Gu J, Grundke-Iqbal I, Iqbal K, Gong CX. Reduced O-GlcNAcylation links lower brain glucose metabolism and tau pathology in Alzheimer’s disease. Brain. 2009 doi: 10.1093/brain/awp099. [DOI] [PMC free article] [PubMed] [Google Scholar]
- Liu F, Zaidi T, Iqbal K, Grundke-Iqbal I, Gong CX. Aberrant glycosylation modulates phosphorylation of tau by protein kinase A and dephosphorylation of tau by protein phosphatase 2A and 5. Neuroscience. 2002;115:829–837. doi: 10.1016/s0306-4522(02)00510-9. [DOI] [PubMed] [Google Scholar]
- Liu Y, Liu F, Iqbal K, Grundke-Iqbal I, Gong CX. Decreased glucose transporters correlate to abnormal hyperphosphorylation of tau in Alzheimer disease. FEBS Lett. 2008;582:359–364. doi: 10.1016/j.febslet.2007.12.035. [DOI] [PMC free article] [PubMed] [Google Scholar]
- Maxwell PH, Dachs GU, Gleadle JM, Nicholls LG, Harris AL, Stratford IJ, Hankinson O, Pugh CW, Ratcliffe PJ. Hypoxia-inducible factor-1 modulates gene expression in solid tumors and influences both angiogenesis and tumor growth. Proc Natl Acad Sci U S A. 1997;94:8104–8109. doi: 10.1073/pnas.94.15.8104. [DOI] [PMC free article] [PubMed] [Google Scholar]
- McEwen BS, Reagan LP. Glucose transporter expression in the central nervous system: relationship to synaptic function. Eur J Pharmacol. 2004;490:13–24. doi: 10.1016/j.ejphar.2004.02.041. [DOI] [PubMed] [Google Scholar]
- Mirra SS, Heyman A, McKeel D, et al. The Consortium to Establish a Registry for Alzheimer’s Disease (CERAD). Part II. Standardization of the neuropathologic assessment of Alzheimer’s disease. Neurology. 1991;41:479–486. doi: 10.1212/wnl.41.4.479. [DOI] [PubMed] [Google Scholar]
- Mooradian AD, Chung HC, Shah GN. GLUT-1 expression in the cerebra of patients with Alzheimer’s disease. Neurobiol Aging. 1997;18:469–474. doi: 10.1016/s0197-4580(97)00111-5. [DOI] [PubMed] [Google Scholar]
- Moroz N, Tong M, Longato L, Xu H, de la Monte SM. Limited Alzheimer-type neurodegeneration in experimental obesity and type 2 diabetes mellitus. J Alzheimers Dis. 2008;15:29–44. doi: 10.3233/jad-2008-15103. [DOI] [PMC free article] [PubMed] [Google Scholar]
- Qutub AA, Hunt CA. Glucose transport to the brain: a systems model. Brain Res Brain Res Rev. 2005;49:595–617. doi: 10.1016/j.brainresrev.2005.03.002. [DOI] [PubMed] [Google Scholar]
- Schubert D. Glucose metabolism and Alzheimer’s disease. Ageing Res Rev. 2005;4:240–257. doi: 10.1016/j.arr.2005.02.003. [DOI] [PubMed] [Google Scholar]
- Simpson IA, Chundu KR, Davies-Hill T, Honer WG, Davies P. Decreased concentrations of GLUT1 and GLUT3 glucose transporters in the brains of patients with Alzheimer’s disease. Ann Neurol. 1994;35:546–551. doi: 10.1002/ana.410350507. [DOI] [PubMed] [Google Scholar]
- Skaper SD. The brain as a target for inflammatory processes and neuroprotective strategies. Ann N Y Acad Sci. 2007;1122:23–34. doi: 10.1196/annals.1403.002. [DOI] [PubMed] [Google Scholar]
- Smith MA, Sayre LM, Perry G. Diabetes mellitus and Alzheimer’s disease: glycation as a biochemical link. Diabetologia. 1996;39:247. doi: 10.1007/BF00403972. [DOI] [PubMed] [Google Scholar]
- Smith MA, Taneda S, Richey PL, Miyata S, Yan SD, Stern D, Sayre LM, Monnier VM, Perry G. Advanced Maillard reaction end products are associated with Alzheimer disease pathology. Proc Natl Acad Sci U S A. 1994;91:5710–5714. doi: 10.1073/pnas.91.12.5710. [DOI] [PMC free article] [PubMed] [Google Scholar]
- Steen E, Terry BM, Rivera EJ, Cannon JL, Neely TR, Tavares R, Xu XJ, Wands JR, de la Monte SM. Impaired insulin and insulin-like growth factor expression and signaling mechanisms in Alzheimer’s disease--is this type 3 diabetes? J Alzheimers Dis. 2005;7:63–80. doi: 10.3233/jad-2005-7107. [DOI] [PubMed] [Google Scholar]
- Wang JZ, Grundke-Iqbal I, Iqbal K. Kinases and phosphatases and tau sites involved in Alzheimer neurofibrillary degeneration. Eur J Neurosci. 2007;25:59–68. doi: 10.1111/j.1460-9568.2006.05226.x. [DOI] [PMC free article] [PubMed] [Google Scholar]
- Wang JZ, Liu F. Microtubule-associated protein tau in development, degeneration and protection of neurons. Prog Neurobiol. 2008;85:148–175. doi: 10.1016/j.pneurobio.2008.03.002. [DOI] [PubMed] [Google Scholar]
- Yan SD, Yan SF, Chen X, et al. Non-enzymatically glycated tau in Alzheimer’s disease induces neuronal oxidant stress resulting in cytokine gene expression and release of amyloid beta-peptide. Nat Med. 1995;1:693–699. doi: 10.1038/nm0795-693. [DOI] [PubMed] [Google Scholar]
- Yu Y, Run X, Liang Z, Li Y, Liu F, Liu Y, Iqbal K, Grundke-Iqbal I, Gong CX. Developmental regulation of tau phosphorylation, tau kinases, and tau phosphatases. J Neurochem. 2009 doi: 10.1111/j.1471-4159.2009.05882.x. [DOI] [PMC free article] [PubMed] [Google Scholar]
- Zelzer E, Levy Y, Kahana C, Shilo BZ, Rubinstein M, Cohen B. Insulin induces transcription of target genes through the hypoxia-inducible factor HIF-1alpha/ARNT. Embo J. 1998;17:5085–5094. doi: 10.1093/emboj/17.17.5085. [DOI] [PMC free article] [PubMed] [Google Scholar]
- Zhu X, Perry G, Smith MA. Insulin signaling, diabetes mellitus and risk of Alzheimer disease. J Alzheimers Dis. 2005;7:81–84. doi: 10.3233/jad-2005-7108. [DOI] [PubMed] [Google Scholar]