

Abstract
Microwave-induced thermoacoustic tomography (MI-TAT) is an imaging technique that exploits dielectric contrast at microwave frequencies while creating images with ultrasound resolution. We propose the use of microbubbles as a dielectric contrast agent for enhancing the sensitivity of MI-TAT for breast cancer detection. As an initial investigation of this concept, we experimentally studied the extent to which the microwave-induced thermoacoustic response of a dielectric target is modified by the presence of air-filled glass microbubbles. We created mixtures of ethylene glycol with varying weight percentages of microbubbles and characterized both their microwave properties (0.5-6 GHz) and thermoacoustic response when irradiated with microwave energy at 3 GHz. Our data shows that the microbubbles considerably lowered the relative permittivity, electrical conductivity, and thermoacoustic response of the ethylene glycol mixtures. We hypothesize that the interstitial infusion of microbubbles to a tumor site will similarly create a smaller thermoacoustic response compared to the pre-contrast-agent response, thereby enhancing sensitivity through the use of differential imaging techniques.
Keywords: microwave imaging, thermoacoustic, contrast agent, microbubbles, dielectric spectroscopy, breast cancer detection
1. Introduction
Microwave-induced thermoacoustic tomography(MI-TAT) is a hybrid imaging modality that exploits dielectric-properties contrasts while creating images with ultrasound-quality resolution. In thermoacoustic imaging, the tissue is irradiated with sub-microsecond electromagnetic pulses. This electromagnetic energy is selectively absorbed by the higher-conductivity tissues and induces acoustic waves by the means of thermoelastic expansion. These thermoacoustic signals are detected by ultrasound transducers and processed for image reconstruction. One promising application for microwave imaging techniques such as MI-TAT (as well as others) is early-stage breast cancer detection (Kruger et al 1999, Kruger et al 2002, Ku et al 2005, Xu et al 2005, Meaney et al 2000, Li et al 2005).
A recently published large-scale spectroscopy study conducted by the University of Wisconsin and the University of Calgary (Lazebnik et al 2007) has shown that the contrast in the microwave-frequency dielectric properties between malignant tissues and healthy adipose-dominated tissues in the breast is as large as 10:1, but the contrast between malignant and normal glandular/fibroconnective tissues in the breast is not more than about 10%. Nearly all breast cancers originate in the ducts or lobules of the breast, which are glandular tissues. The use of contrast agents, such as those that accumulate in tumors via passive mechanisms (Maeda et al 2000), may enhance the dielectric contrast between malignant and normal glandular tissue, thereby increasing the sensitivity of microwave imaging for breast cancer detection.
Here, we propose air-filled microbubbles as a contrast agent in MI-TAT. Because of their echo-enhancing properties, microbubbles have been studied for the past several decades as a contrast agent in ultrasound imaging (Calliada et al 1998, Cosgrove 2006, Wells 2006). Microbubbles may also be advantageous in MI-TAT modalities because of their low microwave absorption. We hypothesize that the thermoacoustic response of a tumor infused with microbubbles will be not only smaller than that of surrounding normal glandular tissue structures but also smaller than the response of the tumor in its pre-contrast-agent state. This extrinsic dielectric contrast mechanism could be exploited via differential imaging whereby the breast is imaged before and after the contrast agent is injected.
As an initial step towards evaluating the feasibility of microbubbles as a contrast agent in MI-TAT, we tested the extent to which the microwave-induced response of a simple dielectric target is modified by the presence of microbubbles. The remainder of this paper is organized as follows. Section 2 summarizes the theory of thermoacoustic phenomena. Section 3 describes the methods used to create the thermoacoustic targets and experimentally characterize both their dielectric properties and thermoacoustic response. Section 4 discusses the results of the study, and the conclusions are summarized in Section 5.
2. Theory
Thermoacoustic theory has been detailed in a number of review papers (see, for example, Tam 1986 and Xu and Wang 2006). Here, we briefly summarize the fundamental concepts. The thermoacoustic differential equation given by Equation 1 is derived from the equations of motion and thermal expansion assuming a homogeneous acoustic and thermal medium.
| (1) |
Here p(r, t) is the acoustic pressure at position r and time t, βe is the volume expansion coefficient, T (r, t) is the temperature rise throughout the medium due to microwave absorption, ρ is the mass density, and c is the speed of sound.
For the case in which microwave power dissipation in a region is uniform and so rapid that thermal diffusion can be neglected, the temperature rise in that region can be described as:
| (2) |
Here τ is the microwave pulse length, Cp is the specific heat, and SAR is the specific absorption rate, defined as σ|E|2/2ρ, where E is the electric field, σ is the effective electrical conductivity, and ρ is the mass density.
These equations suggest that a lesion with lowered conductivity should have a smaller local temperature rise and a smaller thermoacoustic response.
3. Materials and methods
3.1. Thermoacoustic targets
Our thermoacoustic targets were composed of mixtures of ethylene glycol (EG) with 0%, 5%, 10%, 20%, and 30% by weight concentrations of microbubbles. These concentrations are within the typical 109 microbubbles/mL dosage administered in human ultrasound procedures (Stride and Saffari 2005). The microbubbles used were air-filled glass spheres (iM30K, 3M) with an average diameter of 18 μm and a density of 0.6 g/mL. Ethylene glycol was chosen because it is a relatively inexpensive and readily available liquid with dielectric properties that are approximately within the range of biological tissues at the microwave frequency of interest (3 GHz). In this study, we were concerned only with the role of the dielectric properties on the thermoacoustic response and did not consider or characterize the effect of the thermal, mechanical, or acoustic properties of the mixtures or their constituents. Thus those other properties did not influence our choice of the background liquid.
The mixtures were prepared by vigorously mixing EG with the microbubbles for two minutes before taking any measurements. The thermoacoustic targets were constructed by pouring the mixtures into plastic tubes with an inner diameter of 6 mm. The use of a plastic tube for target construction has been used in experimental work reported by other groups (Ku et al 2005, Jin et al 2007, Paltauf et al 2007). Both ends of the tube were sealed with vinyl plastic putty. The tube was placed in a stand and immersed in an oil tank.
3.2. Dielectric characterization of the targets
The dielectric properties of the mixtures were characterized using a well established open-ended coaxial probe technique described in Popovic et al (2005). Briefly, the tip of hermetically sealed, stainless-steel/borosilicate glass coaxial probe was immersed in the liquid under test. The complex reflection coefficient was recorded using a performance network analyzer and converted into the complex dielectric properties using the procedure described in Popovic et al (2005). As reported in Popovic et al (2005), the measurement uncertainty of this technique is no more than approximately 10%.
We conducted dielectric spectroscopy measurements on freshly mixed EG/microbubble mixtures contained within glass test tubes of the same height as the plastic tubes used in the thermoacoustic measurements. Five dielectric measurements were made at three different depths in the test tubes spanning the frequency range 0.5-6 GHz and the results at each frequency were averaged. The range of depths spanned the region of the target that was illuminated with the microwaves in the thermoacoustic experiments. The measurements were made at room temperature (approximately 22°C).
Since the air-filled microbubbles are less dense than the EG, they separate from the mixture over time and rise to the top. To ensure that the state of the mixture was the same for both our dielectric measurements and thermoacoustic experiments, we made dielectric measurements 2.5 minutes after mixing the solution - the amount of time that elapsed in the subsequent thermoacoustic experiments between mixing the solution and recording the thermoacoustic response.
3.3. Thermoacoustic characterization of the targets
A schematic of the thermoacoustic experimental setup is shown in Figure 1. Microwave pulses with a peak power of approximately 30 kW and a frequency of 3 GHz were delivered to the thermoacoustic target via an S-band rectangular waveguide (cross-sectional dimensions of 72 mm × 34 mm). A pulse generator (BNC 565, Berkeley Nucleonics) was used to set the pulse width to 0.9 μs with a repetition frequency of 900 Hz. These settings correspond to an average power of 24 W. The ultrasound transducer was an unfocused piezoelectric transducer with a 2.25 MHz center frequency (60% 6dB bandwidth) and 12.7 mm diameter (V306, Olympus). The transducer was fastened to a xyz-translation stage and was aligned to the target using the pulse echo mode of the ultrasound pulser/receiver (5800PR, Olympus). The ultrasound pulser/receiver was shielded from the microwave generator by an RF enclosure to eliminate microwave pickup.
Figure 1.

Thermoacoustic experimental setup.
Safflower oil was used as the acoustic coupling medium. The use of oil is advantageous because it has both low relative permittivity and conductivity andtherefore provides a good dielectric contrast with the thermoacoustic target and good penetration depth into the tank. The stand and walls of the tank were constructed out of acrylic, which has similar dielectric properties as oil.
The thermoacoustic signal detected by the transducer during an experimental trial with a specific target was amplified by 60 dB using the pulser/receiver and averaged 200 times by the oscilloscope (Infiniium 54854A, Agilent). Both the microwave generator and oscilloscope were triggered by the pulse generator. The transducer and stand were kept stationary between different thermoacoustic measurements.
3.4. Speed of sound characterization of the targets
We made speed of sound measurements using the well accepted substitution technique described in Kremkau et al (1981) at 2.25 MHz. Mixtures of EG with specific microbubble concentrations were poured into a cylindrical acrylic tube with a 7.6 cm diameter and a 25 μm polyvinylidene chloride (Saran Wrap) window. The sample was then placed in a water tank and illuminated with an ultrasound beam. The propagation time was recorded with and without the sample. The speed of sound was then calculated from the relation (Kremkau et al 1981):
| (3) |
Here d is the length of the cylindrical sample, cw is the speed of sound in water at 22°C, and Δt is the change in propagation time with and without the sample. The speed of sound measurements were made 2.5 minutes after mixing the solutions, for the reasons described in Section 3.2.
4. Results and discussion
4.1. Dielectric Properties
Figures 2(a) and 2(b) show the relative permittivity and effective conductivity of EG and the four different microbubble solutions over a frequency range of 0.5 GHz to 6 GHz at the time that corresponded to when the thermoacoustic response was recorded. The curves depict the average of the different measurements and the vertical bars represent the deviation of the individual measurements from the average value. Table 1 summarizes the relative permittivity and conductivity of these solutions at 3 GHz. Figure 2 shows that the relative permittivity and conductivity of the solutions decrease with increasing microbubble concentration, as expected. In addition to the microwave properties of the solutions investigated, the microwave properties of non-infiltrated fat and muscle are plotted using the four-pole Cole-Cole models reported by Gabriel et al (1996) for comparison.
Figure 2.
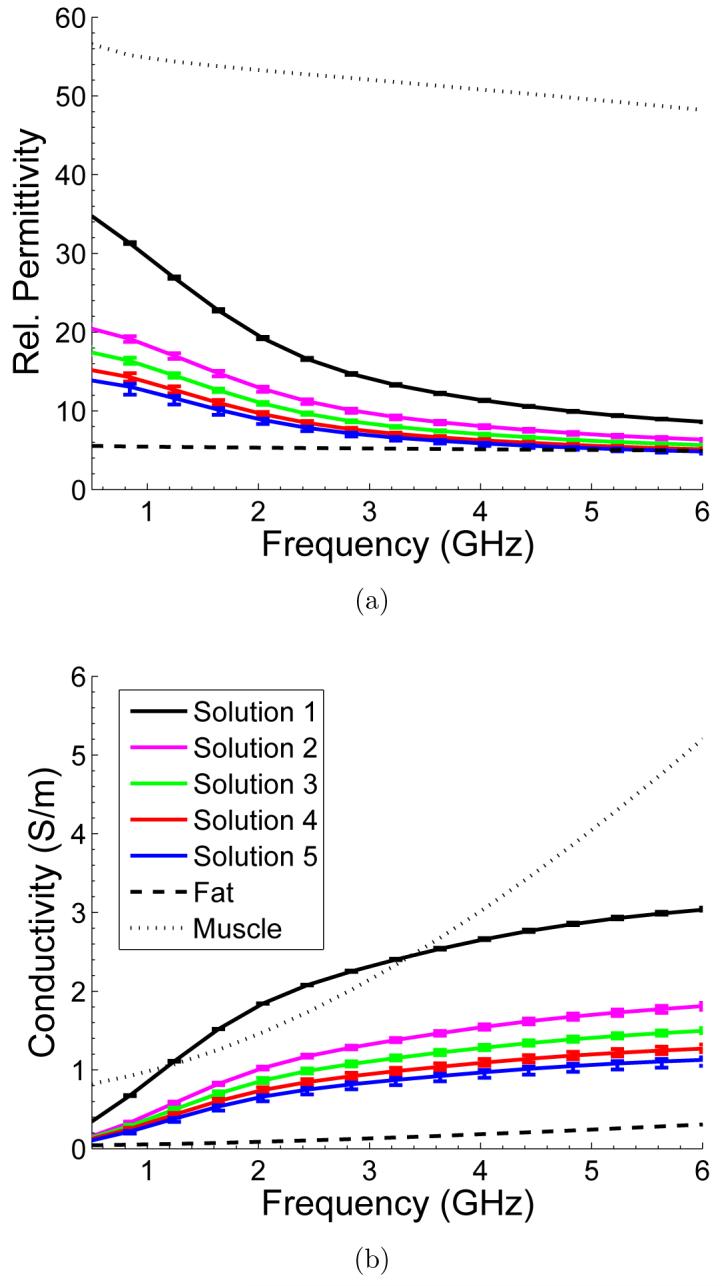
(a) Relative permittivity and (b) effective conductivity of EG solutions with varying concentrations of microbubbles along with the properties of non-infiltrated fat and muscle described by the four-pole Cole-Cole model (Gabriel et al 1996).
Table 1.
Summary of data presented in Figure 2
| Solution | Initial microbubble concentration (% by weight) | Estimated actual concentration (% by weight) | Average ∊r (3 GHz) | Average σ (3 GHz) (S/m) |
|---|---|---|---|---|
| 1 | 0 | 0 | 14.03 | 2.32 |
| 2 | 5 | 20 | 9.66 | 1.33 |
| 3 | 10 | 30 | 8.34 | 1.11 |
| 4 | 20 | 35 | 7.38 | 0.95 |
| 5 | 30 | 40 | 6.86 | 0.84 |
| 6 | 100 | 100 | NAa | NAa |
NA: Not Available
Since the microbubbles tend to float to the top of the mixture over time, the actual concentration of microbubbles seen by the microwaves is higher than that of the original mixture. In order to estimate the actual concentration of microbubbles at the time the thermoacoustic response was recorded, additional higher concentration microbubble mixtures were made. The dielectric properties of these additional mixtures were measured immediately after the solution was created. These instantaneous dielectric measurements of the higher concentration mixtures (not shown) were then compared to those of Figure 2 to determine the actual weight concentration of the mixtures at the time of the thermoacoustic measurements. The estimated concentrations are summarized in Table 1. These measurements establish that the dielectric properties of a solution that was created by using 5% by weight concentration of microbubbles, at two and a half minutes, is equivalent to a 20% by weight concentration of microbubbles. Similarly, mixtures created by using 10%, 20%, and 30% by weight concentration of microbubbles, at two and a half minutes, have dielectric properties of solutions with 30%, 35%, and 40% by weight microbubbles, respectively.
4.2. Thermoacoustic response
Figure 3 shows the temporal thermoacoustic waveform as detected by the ultrasound transducer for Solution 1 (pure EG solution), for five different trials, where each trial involved a fresh mixture of the same concentration. The microwave pulse illuminates the target at t = 0 μs. Since the electromagnetic energy is delivered to the target at the speed of light, the acoustic waves are induced at t ≈ 0 μs. The approximately 34 μs delay corresponds to the propagation time of the induced acoustic waves to reach the transducer in oil. Each thermoacoustic temporal waveform shown in Figure 3 is composed of mainly three lobes. This is the expected pressure profile emitted from a cylindrical thermoacoustic target inside a background medium with a different density and speed of sound (Diebold et al, 1990). The first positive and first negative lobes are characteristic of two dimensional waves emitted from a cylindrical acoustic source. The third positive lobe and ensuing acoustic signature trail is due to the difference in the density and speed of sound of the target, EG, and the background medium, safflower oil.
Figure 3.

Thermoacoustic temporal waveform of Solution 1 for five independent trials. The waveform shown for each trial represents an average of 200 measurements. The small variations observed across waveforms reflect slight differences between trials (e.g. small differences in the plastic tubes and their positions).
We used the multiple trials reported in Figure 3 to characterize the repeatability of our measurements under experimental conditions that are intended to be invariant (e.g. fixed concentration of microbubbles). This assessment is critical for correctly interpreting the differences observed in the thermoacoustic waveform under intentionally varying experimental conditions (differing concentrations, for example). Figure 3 shows that the variations in the thermoacoustic response of similar dielectric targets are no greater than approximately 6% in the first peak and 10% in the temporal width when compared to the average values. The temporal fluctuations are no greater than approximately 1 μs. We attribute these variations in the thermoacoustic waveform to small changes in the physical properties of the plastic tube and the placement of the target relative to the ultrasound transducer. These variations are inevitably introduced between different trials.
Figure 4 shows thermoacoustic temporal waveforms for one representative trial of each of the solutions. The average and the range of minimum and maximum values of the first peak as well as the temporal width of the thermoacoustic response for the five different trials of each concentration are summarized in Table 2. Solution 1 (pure EG) and Solution 6 (the plastic tube filled with only microbubbles) serve as an upper and lower bound of the thermoacoustic response. The thermoacoustic response of Solution 6 is very small, and most likely due to the microwave absorption of the glass shells of the microbubbles and the plastic tube. The change observed across solutions is clearly larger than the variation for repeat measurements with the same solution, as seen in Figure 3.
Figure 4.

Thermoacoustic temporal waveform for all solutions.
Table 2.
Summary of data presented in Figure 4 and speed of sound measurement results
| Solution | Average amplitude of 1st peak in TAa waveform (a.u.) | Min/max amplitude of 1st peak in TAa waveform (a.u.) | Average temporal widthb of TAa waveform (μs) | Speed of sound (m/s) |
|---|---|---|---|---|
| 1 | 0.214 | 0.203/0.227 | 5.1 | 1660.7 |
| 2 | 0.182 | 0.171/0.202 | 3.56 | 1729.8 |
| 3 | 0.176 | 0.164/0.188 | 3.50 | 1805.2 |
| 4 | 0.149 | 0.138/0.155 | 3.28 | 1922.6 |
| 5 | 0.116 | 0.103/0.127 | 3.18 | 2049.4 |
| 6 | ≈ 0 | ≈ 0/≈ 0 | 2.6 | NAc |
TA: Thermoacoustic
Measured by calculating the temporal distance between the two positive peaks in the thermoacoustic waveform
NA: Not Available
Figure 4 and the data in Table 2 show that the thermoacoustic response diminishes with increasing concentrations of microbubbles. Not only does the addition of air-microbubbles modify the dielectric properties (see Figure 2), but it is also well known that gas-filled microbubbles increase acoustic attenuation due to acoustic scattering effects (Chen et al 2002). Therefore it is important to distinguish whether the reduction in the initial peak of the measured thermoacoustic waveform after the addition of microbubbles is due to acoustic attenuation or dielectric properties modification. The analytic solution for the thermoacoustic impulse response of a target without acoustic attenuation has been discussed in great detail in Wang and Wu (2007). This derivation shows that the leading edge of the thermoacoustic waveform is due to a pressure wave emitted from the target surface closest to the detector. This physical fact remains true even if the non-attenuating target medium is replaced with an acoustically lossy target. The amplitude of the acoustic disturbance from the closest target surface will not be affected by any acoustic attenuation within the target volume. Therefore one can conclude that the observed reduction in the first peak of the thermoacoustic response with increasing concentrations of microbubbles is due to the reduced effective conductivity of the mixtures as shown by the dielectric measurements. The lower conductivity leads to smaller microwave dissipation and hence to a lower thermoacoustic response.
4.3. Speed of sound measurements
Another observation from Figure 4 and the data in Table 2 is the reduction in temporal width of the thermoacoustic waveforms with higher concentrations of microbubbles. The temporal width of the induced thermoacoustic wave is directly related to the acoustical width of the target (Diebold et al 1991). As discussed in the review article by Goldberg et al (1993), several research groups have shown that the speed of sound of a medium decreases with increasing concentrations of gas-filled organic-shell microbubbles. Therefore, the expected trend of introducing gas microbubbles is that the thermoacoustic pulse width should widen since the speed of sound in air is much slower than the speed of sound in EG. However, in our experiments, we observed a decrease in the temporal width of the thermoacoustic waveform with increasing concentrations of microbubbles, suggesting an increase in the speed of sound in our microbubble mixtures.
This inference was confirmed with the speed of sound measurements summarized in Table 2. This data shows that as the concentration of microbubbles increases the speed of sound in the mixture increases as well. This is consistent with the trends observed in Figure 4 and Table 2 in which the thermoacoustic temporal width decreased with increasing concentration of microbubbles.
5. Conclusions
In these experiments we characterized the dielectric and acoustic properties as well as the thermoacoustic response of mixtures with varying concentration of air-filled glass microbubbles. Microbubbles significantly lower the microwave absorption of the target which should reduce the thermoacoustic response. These microbubbles also increase the acoustic velocity which should reduce the temporal width of the thermoacoustic response. In our thermoacoustic experiments we observed reductions of both the magnitude and temporal width of the thermoacoustic response with higher levels of microbubble concentrations. With organic-shell microbubbles one can expect the same reduction in amplitude, but a broadening of the temporal width. The changes in amplitude of the thermoacoustic response are promising enough to warrant further investigation into the use of microbubbles as a potential contrast agent in MI-TAT.
Acknowledgments
The authors would like to thank Dr. Sarah Patch, University of Wisconsin-Milwaukee, for supporting the acquisition of the microwave generator used in the experiments and for her helpful discussions. In addition, the authors would like to thank Gary Frank for his assistance with the construction of various parts of the experimental setup, and Tomy Varghese and his graduate students, Nick Rubert and Ryan Dewall, for their assistance with the speed of sound measurements. Finally, the authors would like to thank the reviewers for their insightful comments and suggestions. This work was supported by the National Institutes of Health under grant R01CA112398 awarded by the National Cancer Institute and the Department of Defense Breast Cancer Research Program under grant W81XWH-07-1-0629.
Footnotes
PACS numbers: 87.19.rf, 87.19.xj, 87.57.-s
References
- Calliada F, Campani R, Bottinelli O, Bozzini A, Grazia Sommaruga MG. Ultrasound contrast agents: Basic principals. Eur. J. Radiol. 1998;27:S157–S160. doi: 10.1016/s0720-048x(98)00057-6. [DOI] [PubMed] [Google Scholar]
- Chen Q, Zagzebski J, Wilson T, Stiles T. Pressure-dependent attenuation in ultrasound contrast agents. Ultrasound in Med. and Biol. 2002;28:1041–51. doi: 10.1016/s0301-5629(02)00546-x. [DOI] [PubMed] [Google Scholar]
- Cosgrove D. Ultrasound contrast agents: An overview. Eur. J. Radiol. 2006;60:324–30. doi: 10.1016/j.ejrad.2006.06.022. [DOI] [PubMed] [Google Scholar]
- Diebold GJ, Khan MI, Park SM. Photoacoustic signatures of particulate matter: Optical production of acoustic monopole radiation. Science. 1990;250:101–4. doi: 10.1126/science.250.4977.101. [DOI] [PubMed] [Google Scholar]
- Dielbold GJ, Sun T, Khan MI. Photoacoustic monopole radiation in one, two and three dimensions. Phys. Rev. Lett. 1991;67:3384–7. doi: 10.1103/PhysRevLett.67.3384. [DOI] [PubMed] [Google Scholar]
- Gabriel S, Lau RW, Gabriel C. The dielectric properties of biological tissues: III. Parametric models for the dielectric spectrum of tissues. Physics in Medicine and Biology. 1996;41:2271–93. doi: 10.1088/0031-9155/41/11/003. [DOI] [PubMed] [Google Scholar]
- Goldberg BB, Liu JB, Forsberg F. Ultrasound contrast agents: A review. Ultrasound in Medicine and Biology. 1993;20:319–33. doi: 10.1016/0301-5629(94)90001-9. [DOI] [PubMed] [Google Scholar]
- Jin X, Keho A, Meissner K, Wang LV. Iron oxide nanoparticles as a contrast agent in thermoacoustic tomography. Progress in Biomedical Optics and Imaging. 2007;8:64370E. [Google Scholar]
- Kremkau FW, Barnes RW, McGraw CP. Ultrasonic attenuation and propagation speed in normal human brain. J. Acoust. Soc. Am. 1981;70:29–38. [Google Scholar]
- Kruger RA, Kopecky KK, Aisen AM, Reinecke DR, Kruger GA, Kiser WL. Thermoacoustic CT with radio waves: A medical imaging paradigm. Radiology. 1999;211:275–8. doi: 10.1148/radiology.211.1.r99ap05275. [DOI] [PubMed] [Google Scholar]
- Kruger RA, Stantz K, Kiser WL. Thermoacoustic CT of the Breast. Proceedings of the SPIE. 2002;4682:521–5. [Google Scholar]
- Ku G, Fornage BD, Jin X, Xu M, Hunt KK, Wang LV. Thermoacoustic and photoacoustic tomography of thick biological tissues toward breast imaging. Technology in Cancer Research and Treatment. 2005;4:559–65. doi: 10.1177/153303460500400509. [DOI] [PubMed] [Google Scholar]
- Lazebnik M, Popovic D, McCartney L, Watkins CB, Lindstrom MJ, Harter J, Sewall S, Ogilvie T, Magliocco A, Breslin T, Temple W, Mew D, Booske JH, Okoniewski M, Hagness SC. A large-scale study of the ultrawideband microwave dielectric properties of normal, benign and malignant breast tissues obtained from cancer surgeries. Physics in Medicine and Biology. 2007;52:6093–115. doi: 10.1088/0031-9155/52/20/002. [DOI] [PubMed] [Google Scholar]
- Li X, Bond EJ, Van Veen BD, Hagness SC. An overview of ultrawideband microwave imaging via space-time beamforming for early-stage breast cancer detection. IEEE Antennas and Propagation Magazine. 2005;47:19–34. [Google Scholar]
- Maeda H, Wu J, Sawa T, Matsumura Y, Hori K. Tumor vascular permeability and the EPR effect in macromolecular therapeutics: A review. Journal of Controlled Release. 2000;65:271–84. doi: 10.1016/s0168-3659(99)00248-5. [DOI] [PubMed] [Google Scholar]
- Meaney PM, Fanning MW, Li D, Poplack SP, Paulsen KD. A clinical prototype for active microwave imaging of the breast. IEEE Trans. Microwave Theory Tech. 2000;48:1841–53. [Google Scholar]
- Paltauf G, Nuster R, Haltmeier M, Burgholzer P. Photoacoustic tomography using a Mach-Zehnder interferometer as an acoustic line detector. Applied Optics. 2007;46:3352–8. doi: 10.1364/ao.46.003352. [DOI] [PubMed] [Google Scholar]
- Popovic D, McCartney L, Beasley C, Lazebnik M, Okoniewski M, Hagness SC, Booske JH. Precision open-ended coaxial probes for in vivo and ex vivo dielectric spectroscopy of biological tissues at microwave frequencies. IEEE Trans. Microwave Theory Tech. 2005;53:1713–22. [Google Scholar]
- Stride E, Saffari N. Investigating the significance of multiple scattering in ultrasound contrast agent particle populations. IEEE Trans. Ultrason., Ferrolect., Freq. Contr. 2005;52:2332–45. doi: 10.1109/tuffc.2005.1563278. [DOI] [PubMed] [Google Scholar]
- Tam AC. Application of photoacoustic sensing techniques. Rev. Mod. Phys. 1986;50:381–431. [Google Scholar]
- Wells PNT. Ultrasound imaging. Physics in Medicine and Biology. 2006;51:R83–R98. doi: 10.1088/0031-9155/51/13/R06. [DOI] [PubMed] [Google Scholar]
- Xu M, Geng K, Xing J, Wang LV, Fornage BD, Hunt KK. Breast cancer imaging by microwave-induced thermoacoustic tomography. Proceedings of the SPIE. 2005;5697:45–8. [Google Scholar]
- Wang LV, Wu H.-i. Biomedical Optics: Principles and Imaging. Wiley; New Jersey: 2007. p. p293. [Google Scholar]
- Xu M, Wang LV. Photoacoustic imaging in biomedicine. Review of Scientific Instruments. 2006;77:041101. [Google Scholar]