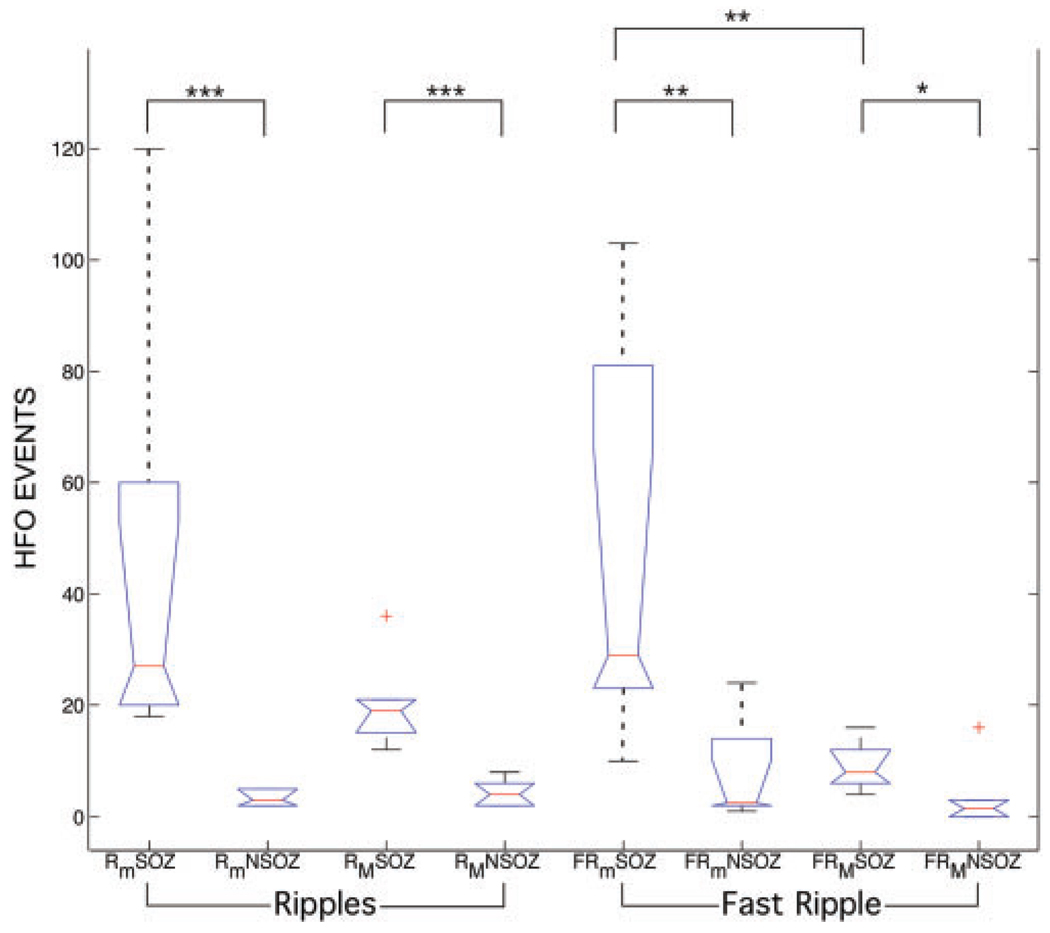
Fig. 6.
Kurskal–Wallis analysis of variance (test statistic=32.34, P=3.5 × 10⁻⁵) was applied to three groups of variables: HFO frequency range (ripple/FR), electrode type (microwire/macroelectrode) and brain region of interest (seizure onset/non-seizure onset). Box-plots and the results from post hoc analysis using Wilcoxon rank sum (***P<0.002, **P<0.01, *P<0.05) are shown. The lower and upper borders of the box-plots, 25 and 75% percentile of the data, contain the data median indicated by the red line. The whiskers extend over the entire range of the data, and data outliers are indicated by a red cross. The number of microwire ripple (Rm) and fast ripple (FRm) oscillations are increased in the SOZ compared to non-seizure onset regions (non-SOZ). The number of macroelectrode ripple (RM) and fast ripple (FRM) oscillations were increased in the SOZ compared to non-SOZ, but less significance for fast-ripple HFO. The microwire electrodes detect significantly more fast-ripple HFO compared to the clinical macroelectrodes.

