

Abstract
Polyunsaturated fatty acids (PUFA) are primary targets of free radical damage during oxidative stress. Diffusible electrophilic α, β-unsaturated aldehydes, such as 4-hydroxynonenal (HNE), have been shown to modify proteins that mediate cell signaling (e.g. IKK and Keap1) and alter gene expression pathways responsible for inducing antioxidant genes, heat shock proteins, and the DNA damage response. To fully understand cellular responses to HNE, it is important to determine its protein targets in an unbiased fashion. This requires a strategy for detecting and isolating HNE-modified proteins regardless of the nature of the chemical linkage between HNE and its targets. Azido or alkynyl derivatives of HNE were synthesized and demonstrated to be equivalent to HNE in their ability to induce heme oxygenase induction and induce apoptosis in colon cancer (RKO) cells. Cells exposed to the tagged HNE derivatives were lysed and exposed to reagents to effect Staudinger ligation or copper-catalyzed Huisgen 1,3 dipolar cycloaddition reaction (click chemistry) to conjugate HNE-adducted proteins with biotin for subsequent affinity purification. Both strategies yielded efficient biotinylation of tagged HNE-protein conjugates but click chemistry was found to be superior for recovery of biotinylated proteins from streptavidin-coated beads. Biotinylated proteins were detected in lysates from RKO cell incubations with azido-HNE at concentrations as low as 1 μM. These proteins were affinity purified with streptavidin beads and proteomic analysis was performed by linear ion trap mass spectrometry. Proteomic analysis revealed a dose-dependent increase in labeled proteins with increased sequence coverage at higher concentrations. Several proteins involved in stress signaling (heat shock proteins 70 and 90, and the 78-kDa glucose-regulated protein) were selectively adducted by azido- and alkynyl-HNE. The use of azido and alkynyl derivatives in conjunction with click chemistry appears to be a valuable approach for the identification of the protein targets of HNE.
Introduction
Reactive oxygen species generated under conditions of oxidative stress may initiate membrane lipid peroxidation (1). Among the many products generated from lipid oxidation is 4-hydroxynonenal (HNE) (2). This α, β-unsaturated aldehyde covalently modifies DNA and protein resulting in genetic mutations and altered cell signaling, respectively (3). HNE modification of macromolecules may contribute to the progression of several diseases including atherosclerosis, ischemia-reperfusion injury, Parkinson’s disease, and Alzheimer’s disease (4-8).
Exposure of human colorectal cancer (RKO) cells to HNE elicits gene expression responses such as the induction of various antioxidant responsive, ER stress responsive, and heat shock responsive transcripts (9). Extensive protein damage from HNE treatment of RKO cells may account for the signaling responses observed. Several studies have demonstrated that protein modification by HNE or other electrophiles results in loss of protein function and disruption of cellular signaling. HNE modification of IκB kinase (IKK) (10), tubulin isoforms (11), and Keap1 (12, 13) leads to altered function in signaling pathways involved in NF-κB signaling, disruption of cytoskeletal function, and protection against oxidative injury, respectively. A comprehensive analysis of the proteins modified by HNE in vivo is necessary to understand the role of oxidative stress on cell signaling and disease pathology.
The modification of proteins by HNE predominantly occurs by Michael addition to nucleophilic amino acid residues His, Cys, and Lys with a minor amount of Schiff base adducts to Lys (14). The majority of previous studies identified HNE adducted proteins using Anti-HNE antibodies. Anti-HNE antibodies directed against 4-HNE-sulfhydryl conjugates of keyhole limpet hemocyanin (KLH) generated in rabbit hosts (15-18) or antibodies specific for HNE-Michael adducts (10-13) have been the most widely used for detecting HNE-protein adducts in cells and tissues. The first reported HNE protein adducts were detected in a model of oxidative stress using carbon tetrachloride (CCl4) treatment of isolated hepatocytes and rat liver (18, 19). The protein adducts were detected with the anti-HNE antibody specific for HNE-cysteine adducts. In a model of alcoholic liver disease the same antibody was used to detect HNE-modified proteins on a western blot of a 2D gel. The HNE-modified proteins were identified as Hsp72 (inducible form of Hsp70), Hsp90, and protein disulfide isomerase (PDI) by matrixassisted laser desorption ionization time of flight mass spectrometry (MALDI-MS) and liquid chromatography with electrospray ionization (ESI) tandem MS (LC-MS/MS) (15-17). Additionally, the same antibody was used to identify the epithelial fatty acid binding protein (E-FABP) as a site of HNE adduction in rat retinal homogenates (20). The identifications of HNE-adducted protein in the above-mentioned studies are limited because only HNE adducts on cysteine were detectable with the antibody used.
Anti-HNE antibodies also show cross-reactivity with other lipid electrophiles. A rabbit polyclonal antibody detected HNE-modified proteins DRP-2, Hsp70, and α-enolase in a model of familial amyotrophic lateral sclerosis (21). The specificity of the antibody is for HNE Michael adducts on His, Cys, and Lys of proteins, however 4-hydroxy-2-decenal and 4-hydroxy-2-octenal can also be recognized (22). Another Michael adduct specific anti-HNE antibody (23) recognizes the reduced form of the Lys-ONE Schiff base adduct, suggesting that this antibody is also not specific for HNE protein adducts (24). For a comprehensive analysis of proteins modified by HNE, an unbiased approach for identifying all types of HNE protein adducts is required. Also, a method for enriching HNE-adducted proteins over non-adducted proteins prior to LC-MS/MS analysis would enhance the overall identification of lower abundance protein adducts.
Recently, biotin hydrazide has been used as a reporter tag for proteins adducted by lipid oxidation products (25) and HNE (26) in vitro and in vivo. Biotin hydrazide is highly specific for free aldehyde groups on proteins (27) and several proteins involved in the cellular stress response, lipotoxicity, and insulin signaling were identified as being adducted by HNE. This method has an advantage over immunochemical approaches in that it recognizes HNE-protein adducts irrespective of the type of adduct formed and the biotin tag provides enrichment of the labeled sample via biotin-avidin binding prior to LC-MS/MS analysis. Although HNE-adducted proteins were identified using this approach, oxidized proteins or proteins adducted by other lipid aldehyde products were also identified. Therefore, this method is not specific for proteins labeled with HNE.
Two recently developed methods for chemically tagging small molecules in cells offer promise for identifying the protein targets of reactive electrophiles such as HNE (Scheme 1). The first method was developed for selective labeling of membrane proteins containing glycoconjugates of azido-sugars with a biotin-containing triphenylphosphine (BiotTPhPh) using a modified Staudinger ligation (28, 29). The azido tag is stable in cells and provides a chemical handle for specifically enriching protein conjugates via biotin-avidin binding prior to LC-MS/MS analysis. The second method uses “click chemistry”, or the Huisgen 1,3-dipolar cycloaddition reaction, to conjugate azido or alkynyl probes to terminal alkyne or azide reporter tags [Biotin (30) or rhodamine (31)], respectively. Click chemistry has been used for activity-based protein profiling (ABPP) applications to identify serine esterase proteins in vivo (31-33). Click chemistry also provides a high fidelity reaction between protein targets in biological matrices and reporter groups similar to the Staudinger ligation (34, 35). Also, azido or alkynyl probes can be used for labeling cellular constituents followed by coupling to alkynyl or azido reporter tags, respectively. Proteins tagged with biotin from either of the above-mentioned methods can be enriched through biotin-avidin binding prior to LC-MS/MS analysis.
Scheme 1.

Staudinger and click ligation methods.
In the present study, we applied both the modified Staudinger ligation and click chemistry approaches to label proteins in RKO cells with HNE (1). Azido-tagged HNE (Az-HNE, 2) was used to label proteins in intact RKO cells followed by conjugation to BiotTPhPh (4) using the modified Staudinger ligation. For click chemistry both Az-HNE and alkynyl-tagged HNE (Al-HNE, 3) were used to label proteins in intact cells followed by conjugation with the appropriate biotin conjugated alkyne (Al-Biot, 5) or azido (Az-Biot, 6), respectively. Biotin-conjugated proteins were then enriched using streptavidin (SA) beads prior to LC-MS/MS analysis. The results demonstrate that biotin labeling of Az-HNE adducted proteins via the modified Staudinger ligation is efficient but purification of biotin-labeled proteins from background proteins using SA beads is difficult. The use of click chemistry resulted in specific biotin labeling of Az-HNE and Al-HNE adducted proteins and selective SA bead purification of biotin-tagged proteins. Subsequent proteomic analysis of these proteins revealed a broad spectrum of targets for HNE.

Methods and Materials
Materials
Streptavidin conjugated to horseradish peroxidase (HRP-SA), bovine serum albumin (BSA), sodium cyanoborohydride, protease inhibitor cocktail (PIC) for mammalian cell culture, dithiothreitol (DTT), and sodium ascorbate (Asc) were purchased from Sigma-Aldrich (St. Louis, MO). Streptavidin coupled to 6% cross-linked sepharose beads was from GE Healthcare (Picataway, NJ). Laemmli buffer, and silver staining kit were from Biorad (Hercules, CA). Anhydrous CuSO4 was from Fisher (Pittsburg, PA). Gradient gels (4-20% polyacrylamide) were from Invitrogen (Carlsbad, CA). Handee mini spin filters, M-Per® cell lysis buffer, West Pico® ECL kit, and tris-(2-carboxyethyl)-phosphine.HCl (TCEP) were purchased from Pierce (Rockford, Il). Iodoacetamide was from Aldrich (Milwaukee, WI). Modified trypsin, mass spectrometry grade, was from Promega (Madison, WI). Western blotting was accomplished with Kodak Biomax light film (Sigma) with ECL detection in an Electrophoresis Systems Autoradiography Cassette (FisherBiotech; Wembley, WA).
General methods
1H and 13C NMR spectra were collected on a 300 MHz NMR. All reactions were carried out under an atmosphere of argon. CH2Cl2 was dried using a solvent purification system. Commercial anhydrous DMSO, DMF, and CH3CN were used as received. Purification by column chromatography was carried out on silica gel and TLC plates were visualized with phosphomolybdic acid. HNE (1) and its analogs (2 and 3) were synthesized following the same procedures; representative procedures for HNE are presented as well as characterization for all compounds. 6-Heptynal (36), 7 (37), 12 (38), and 6-azidohexanoic acid (39) were synthesized by literature procedures.
Synthesis of 7-azidoheptanal
NaN3 (2.3 g, 0.035 mol) was added to a solution of 7-bromoheptanol (3.6 mL, 0.023 mol) in DMSO (75 mL). After stirring overnight, the reaction mixture was diluted with H2O and extracted with ether. The organics were washed with brine and dried over MgSO4. The product was isolated as a pale yellow liquid (3.9 g, 100%) and used without purification. 1H NMR (CDCl3) δ 3.62 (t, 2H, J = 6.6 Hz), 3.22 (t, 2H, J = 6.9 Hz), 1.54 (m, 5H), 1.36 (m, 6H); 13C NMR (CDCl3) δ 62.8, 51.4, 32.5, 28.9, 28.7, 26.6, 25.6. Oxalyl chloride (2.7 mL, 0.030 mol) was added to a solution of DMSO (4.1 mL, 0.058 mol) in CH2Cl2 (100 mL) at -78 °C. After 30 min, 7-azidoheptanol (3.9 g, 0.023 mol) was added and the reaction mixture stirred for 30 min, followed by the addition of Et3N (16 mL, 0.11 mol). After stirring overnight, the reaction mixture was diluted with H2O and extracted with ether. The organics were washed with 10% HCl, saturated NaHCO3, brine, and dried over MgSO4. Purification by column chromatography (10% EtOAc/hexanes) afforded the product as a pale yellow liquid (2.9 g, 81%). Characterization of 7-azidoheptanal was consistent with the literature (40) 1H NMR (CDCl3) δ 9.73 (t, 1H, J = 1.5 Hz), 3.23 (t, 2H, J = 6.9 Hz), 2.41 (dt, 2H, J = 1.8, 7.2 Hz), 1.58 (m, 4H), 1.34 (m, 4H); 13C NMR (CDCl3) δ 202.5, 51.3, 43.7, 28.6, 26.4, 21.8.
Synthesis of (E)-ethyl 4-hydroxy-2-nonenoate (8)
Heptaldehyde (2.9 mL, 0.021 mol), 6-heptynal, or 7-azidoheptanal and piperidine (2.8 mL, 0.028 mol) were added to a solution of 7 (3.3 g, 0.014 mol) in CH3CN (70 mL). After stirring overnight, the reaction mixture was diluted with saturated NH4Cl and extracted with CH2Cl2. The organic layer was dried over MgSO4. The product was purified by column chromatography (20% EtOAc/hexanes) and isolated as a yellow liquid (2.6 g) in 91% yield.
8a (R = CH2CH3): 1H NMR (CDCl3) δ 6.91 (dd, 1H, J = 4.8, 15.6 Hz), 6.00 (dd, 1H, J = 1.5, 15.6 Hz), 4.27 (m, 1H), 4.17 (q, 2H, J = 7.2 Hz), 1.88 (d, 1H, J = 4.8 Hz), 1.55 (m, 2H), 1.30 (m, 6H), 1.26 (t, 3H, J = 7.2 Hz), 0.86 (m, 3H); 13C NMR (CDCl3) δ 166.6, 150.2, 120.1, 71.1, 60.4, 36.6, 31.6, 24.8, 22.5, 14.2, 14.0; HRMS (MALDI) calculated 201.1491 (M+H), observed 201.1493.
8b (R = C≡CH): 1H NMR (CDCl3) δ 6.91 (dd, 1H, J = 4.8, 15.6 Hz), 6.00 (dd, 1H, J = 1.5, 15.6 Hz), 4.31 (m, 1H), 4.16 (q, 2H, J = 7.2 Hz), 2.21 (m, 2H), 2.07 (d, 1H, J = 4.8 Hz), 1.94 (t, 1H, J = 2.7 Hz), 1.67 (m, 4H), 1.26 (t, 3H, J = 7.2 Hz); 13C NMR (CDCl3) δ 166.5, 149.8, 120.4, 83.8, 70.5, 68.8, 60.5, 35.4, 24.0, 18.2, 14.2; HRMS (MALDI) calculated 197.1178 (M+H), observed 197.1181.
8c (R = (CH2)2N3): 1H NMR (CDCl3) δ 6.90 (dd, 1H, J = 5.1, 15.6 Hz), 5.99 (dd, 1H, J = 1.5, 15.6 Hz), 4.28 (m, 1H), 4.16 (q, 2H, J = 7.2 Hz), 3.23 (t, 2H, J = 6.6 Hz), 2.00 (d, 1H, J = 3.6 Hz), 1.57 (m, 4H), 1.36 (m, 4H), 1.26 (t, 3H, J = 7.2 Hz); 13C NMR (CDCl3) δ 166.5, 150.0, 120.2, 70.9, 60.5, 51.3, 36.3, 28.7, 26.5, 24.7, 14.2; HRMS (MALDI) calculated 248.1586 (M+Li), observed 248.1578.
Synthesis of (E)-ethyl 4-(tert-butyldimethylsilyloxy)-2-nonenoate (9)
TBDMSCl (2.5 g, 0.017 mol) and imidazole (2.4 g, 0.035 mol) were added to a solution of 8 (2.6 g, 0.013 mol) in DMF (30 mL). After stirring overnight, the reaction mixture was diluted with H2O and extracted with ether. The organic layer was washed with brine and dried over MgSO4. The product (3.2 g, 78%) was isolated as a colorless liquid after column chromatography (10% EtOAc/hexanes).
9a (R = CH2CH3): 1H NMR (CDCl3) δ 6.90 (dd, 1H, J = 4.8, 15.6 Hz), 5.93 (dd, 1H, J = 1.5, 15.3 Hz), 4.26 (m, 1H), 4.17 (dq, 2H, J = 1.5, 7.2 Hz), 1.50 (m, 2H), 1.29-1.25 (m, 6H), 1.27 (t, 3H, J = 6.9 Hz), 0.88 (s, 9H), 0.85 (t, 3H, J = 6.9 Hz), 0.03 (s, 3H), 0.01 (s, 3H); 13C NMR (CDCl3) δ 166.8, 151.2, 119.6, 71.6, 60.3, 37.3, 31.8, 25.8, 24.5, 22.5, 18.2, 14.3, 14.0, -4.6, -4.9; HRMS (MALDI) calculated 315.2355 (M+H), observed 315.2353.
9b (R = C≡CH): 1H NMR (CDCl3) δ 6.88 (dd, 1H, J = 4.8, 15.6 Hz), 5.95 (dd, 1H, J = 1.8, 15.6 Hz), 4.33 (m, 1H), 4.17 (dq, 2H, J = 1.5, 7.2 Hz), 2.18 (dt, 2H, J = 2.7, 6.9 Hz), 1.92 (t, 1H, J = 2.7 Hz), 1.60 (m, 4H), 1.27 (t, 3H, J = 7.2 Hz), 0.89 (s, 9H), 0.04 (s, 3H), 0.01 (s, 3H); 13C NMR (CDCl3) δ 166.6, 150.5, 120.1, 84.0, 71.0, 68.6, 60.3, 36.1, 25.8, 23.5, 18.4, 18.2, 14.2, -4.6, -5.0; HRMS (MALDI) calculated 311.2042 (M+H), observed 311.2046.
9c (R = (CH2)2N3): 1H NMR (CDCl3) δ 6.88 (dd, 1H, J = 4.8, 15.6 Hz), 5.94 (dd, 1H, J = 1.5, 15.6 Hz), 4.28 (m, 1H), 4.17 (dq, 2H, J = 3.9, 7.2 Hz), 3.23 (t, 2H, J = 6.9 Hz), 1.54 (m, 4H), 1.34 (m, 4H), 1.27 (t, 3H, J = 7.2 Hz), 0.88 (s, 9H), 0.03 (s, 3H), 0.01 (s, 3H); 13C NMR (CDCl3) δ 166.7, 150.8, 119.9, 71.3, 60.3, 51.3, 37.1, 28.7, 26.7, 25.8, 24.2, 18.2, 14.2, -4.6, -5.0.
Synthesis of (E)-4-(tert-butyldimethylsilyloxy)-2-nonen-1-ol (10)
DIBAL-H (20 mL of 1.4 M/toluene, 0.028 mol) was added to a solution of 9 (3.2 g, 0.010 mol) in CH2Cl2 (50 mL) at 0 °C. After 30 min, the reaction mixture was quenched with 10% HCl and extracted with CH2Cl2. The organics were dried over MgSO4 and purified by column chromatography (10% EtOAc/hexanes). The product (2.6 g) was isolated as a colorless liquid in 93% yield.
10a (R = CH2CH3): 1H NMR (CDCl3) δ 5.69 (m, 2H), 4.09 (m, 3H), 1.45 (m, 2H), 1.25 (m, 7H), 0.87 (s, 9H), 0.86 (t, 3H, J = 6.9 Hz), 0.03 (s, 3H), 0.00 (s, 3H); 13C NMR (CDCl3) δ 135.5, 128.1, 72.7, 63.3, 38.2, 31.8, 25.9, 24.9, 22.6, 18.2, 14.1, -4.3, -4.8; HRMS (MALDI) calculated 273.2250 (M+H), observed 273.2248.
10b (R = C≡CH): 1H NMR (CDCl3) δ 5.69 (m, 2H), 4.12 (m, 3H), 2.16 (m, 2H), 1.91 (t, 1H, J = 2.7 Hz), 1.53 (m, 5H), 0.86 (s, 9H), 0.02 (s, 3H), 0.00 (s, 3H); 13C NMR (CDCl3) δ 134.9, 128.6, 84.4, 72.2, 68.4, 63.1, 37.1, 25.9, 24.1, 18.4, 18.2, -4.3, -4.8; HRMS (MALDI) calculated 269.1937 (M+H), observed 269.1940.
10c (R = (CH2)2N3): 1H NMR (CDCl3) δ 5.67 (m, 2H), 4.11 (m, 3H), 3.23 (t, 2H, J = 6.9 Hz), 1.56 (m, 2H), 1.47 (m, 2H), 1.32 (m, 5H), 0.87 (s, 9H), 0.02 (s, 3H), 0.00 (s, 3H); 13C NMR (CDCl3) δ 135.1, 128.4, 72.5, 63.2, 51.4, 38.0, 28.8, 26.7, 25.9, 24.6, 18.2, -4.3, -4.8; HRMS (MALDI) calculated 320.2346 (M+Li), observed 320.2348.
Synthesis of (E)-4-(tert-butyldimethylsilyloxy)-2-nonenal (11)
Oxalyl chloride (0.65 mL, 7.3 mmol) was added to a solution of DMSO (1.0 mL, 14 mmol) in CH2Cl2 (28 mL) at -78 C. After 20 min, a solution of 10 (1.5 g, 5.6 mmol) in CH2Cl2 (10 mL) was added. After 30 min, Et3N (3.9 mL, 28 mmol) was added and the reaction mixture allowed to warm to room temperature. After 3 h, the reaction mixture was diluted with H2O and extracted with ether. The organic layer was washed with 10% HCl, saturated NaHCO3, brine, and dried over MgSO4. Purification by column chromatography (10% EtOAc/hexanes) afforded the product (1.2 g, 82%) as a colorless liquid.
11a (R = CH2CH3): 1H NMR (CDCl3) δ 9.54 (d, 1H, J = 8.1 Hz), 6.77 (dd, 1H, J = 4.5, 15.3 Hz), 6.23 (ddd, 1H, J = 1.5, 7.8, 15.3 Hz), 4.38 (m, 1H), 1.54 (m, 2H), 1.28 (m, 6H), 0.88 (s, 9H), 0.85 (t, 3H, J = 6.9 Hz), 0.04 (s, 3H), 0.00 (s, 3H); 13C NMR (CDCl3) δ 193.7, 160.3, 130.6, 71.6, 37.1, 31.7, 25.8, 24.5, 22.5, 18.1, 14.0, -4.7, -4.9; HRMS (MALDI) calculated 271.2093 (M+H), observed 271.2097.
11b (R = C≡CH): 1H NMR (CDCl3) δ 9.54 (d, 1H, J = 8.1 Hz), 6.76 (dd, 1H, J = 4.5, 15.6 Hz), 6.24 (ddd, 1H, J = 1.5, 8.1, 15.6 Hz), 4.44 (m, 1H), 2.18 (dt, 2H, J = 2.7, 6.9 Hz), 1.93 (t, 1H, J = 2.7 Hz), 1.69 (m, 2H), 1.56 (m, 2H), 0.88 (s, 9H), 0.04 (s, 3H), 0.00 (s, 3H); 13C NMR (CDCl3) δ 193.5, 159.6, 130.9, 83.8, 71.1, 68.8, 35.8, 25.7, 23.5, 18.3, 18.1, -4.7, -5.0; HRMS (MALDI) calculated 267.1780 (M+H), observed 267.1777.
11c (R = (CH2)2N3): 1H NMR (CDCl3) δ 9.55 (d, 1H, J = 7.8 Hz), 6.76 (dd, 1H, J = 4.8, 15.6 Hz), 6.24 (ddd, 1H, J = 1.5, 7.8, 15.3 Hz), 4.41 (m, 1H), 3.24 (t, 2H, J = 6.9 Hz), 1.57 (m, 4H), 1.36 (m, 4H), 0.88 (s, 9H), 0.04 (s, 3H), 0.01 (s, 3H); 13C NMR (CDCl3) δ 193.6, 159.9, 130.8, 71.4, 51.3, 36.9, 28.7, 26.7, 25.7, 24.3, 18.1, -4.7, -4.9; HRMS (MALDI) calculated 318.2189 (M+Li), observed 318.2199.
Synthesis of (E)-4-hydroxy-2-nonenal (1)
Aqueous HF (0.5 mL) was added to a solution of 11 (0.55 g, 2.0 mmol) in CH3CN (10 mL). After 1 h, the reaction mixture was diluted with H2O and extracted with CH2Cl2. The organic layer was dried over MgSO4. The product (0.3 g) was isolated as a colorless liquid after column chromatography (20% EtOAc/hexanes) in 88% yield.
1 (R = CH2CH3): 1H NMR (CDCl3) δ 9.53 (d, 1H, J = 7.8 Hz), 6.80 (dd, 1H, J = 4.8, 15.9 Hz), 6.27 (ddd, 1H, J = 1.5, 8.1, 15.6 Hz), 4.39 (m, 1H), 2.35 (d, 1H, J = 4.5 Hz), 1.59 (m, 2H), 1.34 (m, 6H), 0.86 (t, 3H, J = 6.6 Hz); 13C NMR (CDCl3) δ 193.8, 159.4, 130.5, 71.0, 36.4, 31.5, 24.8, 22.5, 13.9; HRMS (MALDI) calculated 163.1310 (M+Li), observed 163.1316.
2 (R = C≡CH): 1H NMR (CDCl3) δ 9.54 (d, 1H, J = 7.8 Hz), 6.81 (dd, 1H, J = 4.5, 15.6 Hz), 6.29 (ddd, 1H, J = 1.8, 8.1, 15.9 Hz), 4.46 (m, 1H), 2.35 (d, 1H, J = 4.5 Hz), 2.23 (dt, 2H, J = 2.7, 6.6 Hz), 1.95 (t, 1H, J = 2.7 Hz), 1.72 (m, 4H); 13C NMR (CDCl3) δ 193.6, 158.8, 130.7, 83.7, 70.4, 69.0, 35.1, 23.9, 18.1; HRMS (MALDI) calculated 159.0997 (M+Li), observed 159.0989.
3 (R = (CH2)2N3): 1H NMR (CDCl3) δ 9.53 (d, 1H, J = 7.8 Hz), 6.80 (dd, 1H, J = 4.8, 15.6 Hz), 6.27 (ddd, 1H, J = 1.5, 7.8, 15.6 Hz), 4.40 (m, 1H), 3.24 (t, 2H, J = 6.9 Hz), 2.41 (br s, 1H), 1.58 (m, 4H), 1.42 (m, 4H); 13C NMR (CDCl3) δ 193.7, 159.1, 130.6, 70.8, 51.2, 36.1, 28.6, 26.5, 24.7; HRMS (MALDI) calculated 204.1324 (M+Li), observed 204.1333.
Synthesis of Biotin Alkyne (5)
Oxalyl chloride (2.4 mL, 0.027 mol) was added to a solution of 5-hexynoic acid (2.0 mL, 0.018 mol) and DMF (0.30 mL, 0.0039 mol) in benzene (18 mL). After 2 h, the reaction mixture was concentrated. A solution of the acid chloride in DMF (3.6 mL of 1.8 M, 6.5 mmol) was added to a solution of 12 (2.0 g, 5.3 mmol) and Et3N (1.1 mL, 7.9 mmol) in DMF (25 mL). After stirring overnight, the reaction mixture was concentrated under high vacuum and purified by column chromatography (10% MeOH/CH2Cl2). A solution of the product in MeOH was passed through basic Dowex to remove triethylammonium salts and isolated as an off-white powder (1.4 g, 57%). 1H NMR (MeOH-d4) δ 4.49 (dd, 1H, J = 4.8, 7.8 Hz), 4.30 (dd, 1H, J = 4.5, 7.8 Hz), 3.61 (s, 4H), 3.54 (t, 4H, J = 5.7 Hz), 3.36 (t, 4H, J = 5.4 Hz), 3.20 (m, 1H), 2.92 (dd, 1H, J = 5.1, 12.9 Hz), 2.70 (d, 1H, J = 12.9 Hz), 2.31 (t, 2H, J = 7.2 Hz), 2.21 (m, 5H), 1.79 (pentet, 2H, J = 7.5 Hz), 1.64 (m, 4H), 1.43 (m, 2H); 13C NMR (MeOH-d4) δ 176.1, 175.4, 166.0, 84.2, 71.2, 70.6, 70.5, 63.3, 61.6, 57.0, 54.8, 41.1, 40.2, 36.7, 35.8, 29.7, 29.5, 26.8, 25.9, 18.6; HRMS (MALDI) calculated 469.2485 (M+H), observed 469.2488.
Synthesis of Biotin Azide (6)
Biotin reagent 6 was synthesized starting from 6-azidohexanoic acid as described above and isolated as an off-white powder (1.4 g, 53%). 1H NMR (MeOH-d4) δ 4.49 (dd, 1H, J = 4.8, 7.8 Hz), 4.30 (dd, 1H, J = 4.2, 7.8 Hz), 3.61 (s, 4H), 3.54 (t, 4H, J = 5.7 Hz), 3.35 (t, 4H, J = 5.4 Hz), 3.29 (t, 2H, J = 6.9 Hz), 3.20 (m, 1H), 2.92 (dd, 1H, J = 5.1, 12.9 Hz), 2.70 (d, 1H, J = 12.9Hz), 2.21 (t, 4H, J = 7.2 Hz), 1.65 (m, 8H), 1.42 (m, 4H); 13C NMR (MeOH-d4) δ 176.10, 176.05, 166.1, 71.3, 70.6, 63.3, 61.6, 57.0, 52.3, 41.1, 40.3, 36.8, 36.7, 29.8, 29.6, 29.5, 27.4, 26.8, 26.5; HRMS (MALDI) calculated 514.2812 (M+H), observed 514.2817.
Peptide adduction
Stock solutions of peptides (1 mM) were prepared in phosphate buffer (50 mM, pH 7.4) and stock solutions of HNE and analogs (51 mM) were prepared in DMSO. Initial experiments were carried out with peptide (90 μL, 0.9 mM) and HNE (10 μL, 5 mM) to identify the peptide adducts. For experiments in which the reactivity of the analogs was compared to HNE, samples were prepared with peptide (70 μL, 0.7 mM) and an equimolar mixture of each HNE compound (10 μL of each HNE, 5 mM each). In all experiments, the samples were incubated at 37 °C, typically for 1 h. The reaction mixture was subsequently reduced with NaBH4 (100 mM) then neutralized with 1 M HCl (10 μL) for LC-MS analysis. The reaction mixture was analyzed on a Discovery C18 column using a mobile phase consisting of A: 0.05% TFA in H2O and B: 0.05% TFA in CH3CN. The unreacted peptide and adducts were eluted with a gradient of 15% to 35% B over 20 min, then to 90% B over 10 min, and back to 15% B over 5 min.
Biological Activity of HNE, Az-, and Al-HNE
For cell viability assays RKO cells were seeded in 96-well plates at a density of 7,500 cells per well. After adhering overnight, cells were treated with HNE, Az-, or Al-HNE in concentrations ranging from 1-80 μM in DMEM containing 10% fetal bovine serum (FBS) with vehicle control (DMSO 0.5%, v/v) run alongside. Following 48 h of incubation, media was aspirated, washed once in Dulbecco’s phosphate buffered saline (D-PBS) and replaced with a solution of 1 μM calcein-AM (Molecular Probes) in D-PBS. After 30 min the fluorescence was measured using a SpectrasMax multiwell plate reader (Molecular Devices) using an excitation of 494 nm, and an emission of 517 nm.
Induction of Heme-oxygenase-1 (HO-1) expression was done by incubating RKO cells with 5 and 25 μM HNE, Az-, or Al-HNE for 8 h. Cells were lysed using M-Per buffer with 1% PIC and HO-1 expression was monitored by western blotting using an anti HO-1 antibody from BD Biosciences.
Click chemistry of peptide adducts
Stock solutions of 5 (100 mM), 6 (100 mM), and ligand (100 mM) were prepared in DMSO. Stock solutions of sodium ascorbate (500 mM) and CuSO4 (500 mM) were prepared in H2O. An aliquot (40 uL) of the peptide adduction mixture described above was diluted with H2O (260 uL) and CH3CN (100 uL) so that the HNE analog concentration was 0.5 mM. The use of CH3CN as a cosolvent was necessary to ensure complete dissolution of all reagents. The appropriate biotin reagent (5 or 6, 20 μL, 5 mM), ascorbate (20 μL, 25 mM), ligand (20 μL, 5 mM), and CuSO4 (20 μL, 25 mM) were added to the peptide adduct, vortexed, and allowed to react at room temperature, typically for 1 h. The samples were analyzed by LC-MS as described above.
Adduction of biotin to HNE-modified proteins in intact RKO cells using the modified Staudinger ligation or click chemistry
RKO cells were seeded in 10 cm plates at 2.0×10⁶ cells/plate in DMEM with FBS. The following morning cells were washed with 5 mls of D-PBS (2x) followed by addition of Az-HNE or Al-HNE in 5 mls of DMEM lacking FBS with DMSO (1% v/v) or vehicle control (DMSO only) for 1 h at 37°C. Cells were then washed twice with D-PBS, scraped into 5 mls of PBS, and collected after centrifugation (1,000 rpms, 5 min, 4°C). For the modified Staudinger ligation (Az-HNE concentrations 50, 100, and 150 μM) cells were scraped washed again by centrifugation and lysed in M-Per lysis buffer containing 1% PIC for 20 min on ice followed by sonication (10 pulses for 10 s, 35% power, 4°C). Freshly prepared NaCNBH3 (0.5 M in D-PBS) was added to the cell lysates and incubated for 1 h to reduce Schiff base adducts and reversible Michael adducts (41). BiotTPhPh (200 μM) was added for 1 h and the sample was quenched by boiling in laemmli buffer with 5% β-mercaptoethanol followed by western blot analysis to assess the level of biotin-tagging.
Click chemistry was performed with cellular lysates containing 1.0 mg/ml of protein with 0.6 mM of the appropriate biotin reagent (Al-Biot or Az-Biot) (0.6 mM), TCEP (6 mM), ligand (13, 0.75 mM), and CuSO4 (6 mM). RKO cells treated with Az-HNE (1, 5, 10, 25, or 50 μM) or vehicle control were lysed as described above. For assessing the time-dependence of Al-Biot conjugation with Az-HNE adducted proteins aliquots were removed from the incubation at 0, 1.5, 3, and 6 h and added to an equal volume of laemmli buffer containing 5% β-mercaptoethanol, 10 mM EDTA, and 100 μM BHA to quench the reaction. Samples were prepared for SA beads as described below. RKO cells treated with Al-HNE (5, 10, or 50 μM) were lysed with 100 mM HEPES, pH 7.5, 150 mM NaCl, 0.1 mM EDTA, and 1% Igepal with 1% PIC, processed as described above and treated with Az-Biot for 2 h prior to SA bead purification.
Purification of biotin-tagged proteins from the modified Staudinger ligation and click chemistry with streptavidin beads
Purification of biotin-tagged proteins from the modified Staudinger ligation was done with 30 μl of cell lysates (∼7.5 μg of total protein) and 45 μl of SA beads (1:1 slurry in 0.1 M ammonium bicarbonate) in Handee® mini-spin columns with end-over-end rotation for 1 h. After 1 h the beads were pelleted at 6,500g for 5 min and the supernatant was collected as the breakthrough fraction (Proteins that are not retained by streptavidin beads). The beads were washed successively with ammonium bicarbonate, 1 M NaCl with 1% Igepal, ammonium bicarbonate, and distilled H2O. The first elution of biotin-tagged proteins was accomplished with 70% CH3CN and 5% formic acid (FA). Another wash with distilled H2O was done and an equal volume of laemmli buffer with (5% β-mercaptoethanol) was added to the SA beads and boiled for 10 minutes for the second elution. Both western blot and silver stain analysis were carried out to determine where biotin-tagged proteins and total proteins were eluting, respectively.
Biotin-tagged proteins from click chemistry reactions were centrifuged (5,000g, 5 min, 4°C) and recovered in the pellet, washed in ice-cold methanol, and then resuspended by sonication (5 s). Supernatant solutions contained undetectable levels of protein (BCA assay) and biotin conjugated protein (Western blotting) (data not shown). The samples were then rotated end-over-end at 4°C for 10 min, centrifuged, and the supernatant was removed. Following another methanol wash protein samples were solubilized in 0.1 M ammonium bicarbonate containing 0.2% SDS. Cell lysates treated with control, 5, 10, and 50 μM for Az-HNE were incubated with streptavidin-conjugated sepharose (SA) beads overnight in Handee® mini-spin columns on a shaker at 60 rpms. Each sample contained a total of 150 μg of protein (0.5 mg/ml) with 75 μl of 1:1 slurry of SA beads in ammonium bicarbonate. Lysates from Al-HNE treated (5, 10, and 50 μM) RKO cells contained 2 mg of protein (1.0 mg/ml) and were incubated with a total of 1 ml of SA beads in 1.5 ml tubes for 2 h. Also, click chemistry reactions with Az-HNE adducted proteins from RKO cells were done using 2 mg of cell lysate for comparison with Al-HNE. The 1.5 ml tubes were centrifuged (6,500g, 5 min) and the breakthrough fraction was collected. More stringent wash steps were used in the experiments with 2 mg of cellular lysate. The beads were washed successively with 1% SDS, 4M urea, 1M NaCl, ammonium bicarbonate, and distilled water. The beads were incubated for 30 min with 1% SDS and 4M urea and for 10 min with 1M NaCl with end-over-end rotation prior to pelleting the beads. Biotin-tagged proteins were eluted as described above.
Proteomic analysis of captured proteins
Biotin-tagged proteins from coomassie stained gels were subjected to in-gel digestion, followed by peptide extraction and proteomic analysis by LC-MS/MS using an established procedure (42). Biotin-tagged proteins purified with SA beads were run on a gradient gel (4-20% acrylamide) and visualized with colloidal coomassie blue (Invitrogen). Visible bands were excised by the cutting the entire molecular weight range into 10 fractions with industrial razor blades (VWR), which were further sliced into ∼ 1 mm cubes, and placed into a 1.5 ml eppendorf tube. The cubes were washed once with 100 μl of ammonium bicarbonate, centrifuged, and another 100 μl of ammonium bicarbonate was added. DTT was added to a final concentration of 3 mM and the cubes were incubated for 15 min at 50°C followed by incubation with iodoacetamide (6.25 mM final conc) for 15 min. The samples were then equilibrated with 50:50 CH3CN:ammonium bicarbonate for 15 min to remove the blue stain. The gel cubes were then dehydrated with 100% CH3CN followed by desiccation in a vacuum centrifuge. The dehydrated gel slices were re-swelled with 25 μL of 0.01 μg/μL of modified trypsin in 25 mM ammonium bicarbonate and incubated overnight at 37°C. Peptides were extracted with 50 μL of 60% CH3CN, 1% FA (2x), evaporated in vacuo, resuspended in distilled water with 1% FA, and then desalted using Zip-Tips (Millipore C18, P10). The peptide eluant from the Zip-Tips was evaporated and 50 μL of distilled water with 0.1% FA was added followed by LC-MS/MS analysis.
The samples were analyzed on a Thermo LTQ linear ion trap instrument equipped with a Thermo microelectrospray source, and a Thermo Surveyor pump and autosampler. LC-MS/MS analyses were done by reverse phase chromatography on an 11 cm fused silica capillary column (100 μm i.d.) packed with Jupiter C-18 (5 μm) resin set to a flow rate of 700 nL/min. The mobile phase consisted of 0.1% formic acid in either HPLC grade H2O (A) or CH3CN (B) and sample runs were 95 min in length. The peptide samples were injected onto the column at 98% A, which was held for 15 min, followed by a linear gradient from 98% A to 75% A to 50 min. A linear gradient to 10% A at 65 min was done followed by isocratic conditions of 10% A to 74 min followed by reequilibration to 98% A. MS/MS spectra were acquired using one data-dependent scan from the most intense precursor ion in the full scan mode. The MS/MS spectra were matched to human database sequences with TurboSequest. S-carbomethylation of Cys (+57 amu) and oxidation of Met (+16 amu) were specified as dynamic modifications. Sequest outputs files were filtered with the software database system CHIPS (Complete Hierarchical Integration of Protein Searches). Sequence-spectrum assignments were accepted based on the following filtering criteria: (1) all peptide sequence assignments were required to result from fully tryptic cleavages, (2) singly, doubly, and triply charged ions were accepted if their XCorr scores were greater than 2, 2.5, and 3, respectively, and (3) all putative matches were confirmed by visual inspection of the spectra. Identifications were accepted only for proteins with 3 unique peptide identifications matching high quality MS/MS spectra. The lists of proteins from vehicle control, 5, 10, and 50 μM Az- and Al-HNE treated cells were compared in CHIPS.
SDS-PAGE and Western Blotting with ECL Detection
Tris-glycine polyacrylamide gels (4-20%) were used for separating proteins. Samples in laemmli sample buffer with 5% β-mercaptoethanol were run on the gels for 1 h at 150 volts. The silver stain plus kit (Biorad) was used to fix and stain gels for visualization of total protein. Visualization of biotin-tagged protein was done by western blot analysis. Proteins separated on gradient gels were transferred to a 0.2 μm nitrocellulose membrane for 1 h in SDS PAGE transfer buffer (1X running buffer with 20% MeOH) at 100 volts. The membranes were blocked with PBS with Tween®20 (0.1% v/v) (PBS-T) for 1 h and then blotted with HRP-SA (100 ng/ml) for an additional hour. The membranes were then washed in PBS-T and biotin-tagged proteins recognized by HRP-SA were detected on BioMax light film using the SuperSignal West Pico Chemiluminescent Substrate.
Results
Synthesis of HNE analogs and biotin tags
HNE and its analogs were synthesized in a similar manner (Scheme 2), modified from a previously reported procedure (37). The sulfinate 7 was coupled with the appropriate aldehyde to yield the α, β-unsaturated esters (8) in good yields. Subsequent protection of the alcohol as the silyl ether was necessary to enable facile reduction of the ester to the alcohol (10). The ester was selectively reduced to the alcohol using DIBAL-H, whereas LiAlH4 also reduced the olefin. The alcohol 10 was oxidized to the aldehyde (11) under Swern conditions and finally deprotected to yield HNE and its analogs (1-3). Several common silyl deprotection strategies were explored, such as TBAF and pyridine-HF, but we found significant decomposition of the product under these conditions. Optimum yields were obtained when the mild HF conditions were used.
Scheme 2.

Synthesis of HNE and analogs.
BiotTPhPh was synthesized according to previous procedures (28). The biotin reagents for click chemistry were designed to contain either an azide or alkyne functionality for coupling to 2 and 3, respectively, under click conditions. In addition, the biotin tag contains an ethylene glycol linker to increase water-solubility. Biotin was coupled to the linker to yield 12 as previously reported (38). Reaction of 12 with 5-hexynoyl chloride or 6-azidohexanoyl chloride produced the desired tags 5 and 6, respectively.
Peptide adduction with HNE and analogs
The HNE analogs were designed to minimize structural variations compared to native HNE that may result in a change in reactivity. In order to compare the reactivity of 2 and 3 relative to 1, the adduction to several peptides was studied. Three peptides were chosen that contained His, Lys, or Cys, major sites of HNE adduction: Angiotensin II (Asp-Arg-Val-Tyr-Ile-His-Pro-Phe), Thymic humoral gamma 2 factor (Leu-Glu-Asp-Gly-Pro-Lys-Phe-Leu), and ANP (Ser-Leu-Arg-Arg-Ser-Ser-Cys-Phe-Gly-Gly-Arg). Each peptide (1 mM) was incubated in the presence of 1, 2, or 3 (5 mM) at 37 °C, typically for 1 h. The reaction mixture was subsequently reduced with NaBH4, neutralized, and analyzed by LC-MS for adduct formation. In all cases, reduced Michael and Schiff base adducts were observed, as well as a minor amount of a mixture of both adducts (see Supporting Information, Figure S1).
These qualitative experiments indicated that modification of the HNE structure did not impact the formation of Schiff base and Michael adducts. However, we were also interested in the relative reactivity of the analogs 2 and 3 compared to 1. Each peptide (0.7 mM) was incubated in the presence of an equimolar mixture of 1-3 (5 mM each) as described above and aliquots were taken every hour. The samples were subsequently analyzed by LC-MS and the amount of each HNE adduct was measured. For the peptides containing His and Lys, there was no significant difference between the relative amounts of adducts formed with each of the HNE analogs compared to native HNE. However, when the peptide contained Cys, there was approximately 50% less adduct in the presence of Az-HNE (Figure S2). The reason for the less efficient reaction of the Cys-containing peptide with Az-HNE is unknown, but may be from thiol reduction of the azide moiety.
To further explore the reactivity of the HNE analogs and more closely mimic biological conditions, adduction experiments were carried out with an equimolar mixture of the peptides in the presence of each HNE compound. As expected, the Lys and Cys containing peptides were considerably more reactive than the His containing peptide. Consistent with the previous experiment, the analogs 2 and 3 exhibited similar reactivity as HNE, except when a Cys was present in the peptide. As observed in the HNE mixture experiments, incubation of Cys in the presence of Az-HNE generated approximately 50% less adduct (Figure S3).
Comparison of biological activity of HNE and analogs
The structural similarity of HNE to its analogs was also tested by comparing their relative toxicity and ability to induce heme-oxygenase-1 (HO-1) expression. RKO cells were treated with HNE, Az-, or Al-HNE and cellular viability was determined after 48 h of incubation. As shown in Figure 1A, the cellular viability for HNE and its analogs are very similar. Induction of HO-1 expression with exposure of RKO cells to 25 μM HNE, Az-, or Al-HNE for 8 h was similar (Figure 1B). Therefore, Az- and Al-HNE are suitable analogs of HNE to probe reactivity with proteins in vivo.
Figure 1.

Comparison of HNE, Az-HNE, and Al-HNE towards cell toxicity and induction of Heme-oxygenase-1 (HO-1) expression. Cell viability assays were done with cells seeded in 96-well plates at a density of 7.5×10³ cells per well. After adhering overnight, cells were treated with HNE, Az-HNE or Al-HNE (1-80 μM) in DMEM containing 10% fetal bovine serum. After 48 h cell viability was determined using calcein-AM. Data in Panel A are represented as mean % control fluorescence (mean ratio of arbitrary fluorescence units of treated samples to DMSO-treated samples × 100). Error bars represent standard deviations (n = 8). Panel B shows a western blot analysis of HO-1 induction in RKO cells. Cells were treated with 5 and 25 μM HNE, Az-HNE, or Al-HNE for 8 h. Cell were then lysed and western blot analysis was done using an anti HO-1 antibody.
Click chemistry optimization of HNE adducted peptides
Peptides adducted with either Al- or Az-HNE were subsequently tagged with biotin for affinity purification utilizing click chemistry (Scheme 4). The click reaction employs a Cu(I) catalyzed cyclization of an azide with an alkyne to form a stable triazole. There are a variety of reaction conditions published for this particular reaction, so conditions were optimized for our particular reagents. The most striking differences are the CuSO4 reducing agent and the choice of amine to stabilize the in situ formed Cu(I) species. We explored the use of tris(2-carboxyethyl)phosphine or Asc as the reducing agent, and the ligand 13 or diisopropylethylamine (DIPEA) as the stabilizer. The peptide adduct was reacted with the appropriate biotin tag (5 or 6) under a variety of conditions and the progress of the reaction was monitored by LC/MS.
Scheme 3.

Synthesis of biotinylating reagents.
From the studies on the click chemistry of the peptide adducts, we found that Asc was superior to TCEP as the CuSO4 reducing agent. When TCEP was used, there was negligible triazole formation, as detected by LC/MS. Increasing the reaction time and equivalents of CuSO4/TCEP had little effect on the reaction. In addition, the use of 13 or DIPEA did not increase the yield of triazole. However, when Asc was used as the reducing agent in conjunction with 13, complete triazole formation was observed within 1 h. These latter reaction conditions were tested for all peptides mentioned above that had been adducted with either Al- or Az-HNE and subsequently reacted with Az- or Al-biotin, respectively. All adducted peptides were quantitatively converted to their biotin- tagged counterparts within 1 h. Shown in Figure 2 is a representative analysis of the peptide adduction and the subsequent click chemistry with the biotin tags to form triazole.
Figure 2.

Incubation of Angiotensin with A) Al-HNE and Az-biotin and B) Az-HNE and Al-biotin. From top to bottom are the unreacted peptide, peptide Schiff base and Michael adducts, and triazole. Angiotensin (1 mM) was incubated with Al- or Az-HNE (5 mM) at 37 °C for 1 h, then with Az- or Al-biotin (2-5 eq), Asc (50 eq), 13 (10 eq), and CuSO4 (50 eq) for 1 h.
Biotin labeling of Az-HNE adducted protein in RKO cells with the Staudinger Ligation
Initial studies were aimed at biotin labeling Az-HNE adducted proteins using the modified Staudinger ligation. RKO cells labeled with Az-HNE were efficiently labeled with BiotTPhPh after 1 h of incubation (Figure 3). Cells exposed to 50, 100, and 150 μM Az-HNE were efficiently labeled with biotin as judged by the western blot signal using HRP-SA, whereas there was no detectable biotin signal for cell samples treated with vehicle control.
Figure 3.

Staudinger ligation for biotin-labeling of Az-HNE adducted proteins in RKO cells. Intact RKO cells were incubated with Az-HNE (50, 100, and 150 μM) and vehicle control (DMSO) for 1 h. The cells were lysed as described in the methods and then incubated with 200 μM BiotTPhPh for 1 h. The degree of biotin labeling was determined by western blotting using HRP-SA. Protein load was 2.5 μg per lane. S=biotin-labeled standards, B=RKO cells incubated with no DMSO, 0=RKO cells incubated with DMSO (1% v/v), 50, 100, and 150 are the concentrations of Az-HNE added to the cells in DMSO (1% v/v).
Affinity purification of proteins biotin-tagged with the modified Staudinger ligation using SA beads
Purification of biotin-tagged proteins using SA beads was attempted prior to subsequent proteomic analysis. Western blot analysis demonstrated that biotin-tagged proteins readily bound to SA beads (Lane 2, Figure 4B). Also, biotin-tagged proteins were retained on the SA beads in subsequent wash steps with significant elution of biotin-tagged proteins (Lanes 3-6, Figure 4A and B). There was no elution of biotin-tagged proteins from SA beads using 70% CH3CN and 5% FA (Lane 7, Figure 4B), however, boiling the beads in laemmli buffer resulted in significant elution of biotin-tagged proteins (Lane 9, Figure 4B). Unfortunately, detection of total proteins by silver stain analysis showed that there was significant contamination of non-adducted proteins with biotin-tagged proteins (compare Lane 9 of Figure 4C and D). Therefore, biotin-tagged proteins from the modified Staudinger ligation were not affinity-purified with SA beads and subsequent proteomic analysis was not performed.
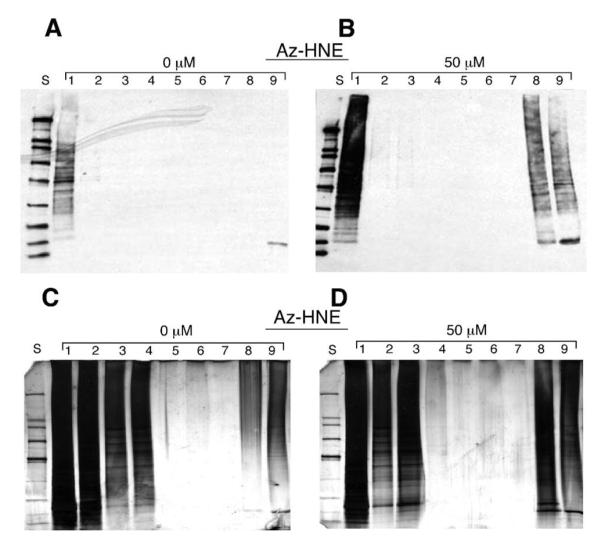
Figure 4.

SA bead purification of biotin-tagged proteins produced from the Staudinger Ligation. Cellular lysates (Lane 1) containing biotin-tagged proteins (30 μl, ∼7.5 μg of protein) were incubated with SA beads (30 μL; 1:1 in 0.1 M ammonium bicarbonate) for 1 h, then the beads and the breakthrough fraction (Lane 2) were recovered by centrifugation. The beads were washed successively with ammonium bicarbonate (Lane 3), 1 M NaCl with 1% Igepal (Lane 4), ammonium bicarbonate (Lane 5), distilled H2O (Lane 6). Protein elution was done in 2 steps. Lane 7 represents elution with 70% CH3CN, 5% FA. Lane 8 represents a wash with distilled H2O and Lane 9 represents elution by boiling in laemmli buffer containing 5% β-mercaptoethanol. Panels A and C are the vehicle control samples and panels B and D are 50 μM Az-HNE samples. Western blotting was performed on Panels A and B and silver stain analysis was done on panels C and D. S=biotin labeled standards.
Click chemistry of cellular proteins labeled with Az-HNE in RKO cells
Click chemistry was applied to conjugate HNE-adducted proteins with biotin as an alternative to the Staudinger ligation. Intact RKO cells were treated with Az-HNE (1, 5, 10, 25, and 50 μM) then the time dependence of Al-Biot conjugation to Az-HNE adducted proteins from cellular lysates was tested using click chemistry. Lysates from cells treated with 50 and 25 μM Az-HNE reached maximal biotin labeling after 90 min of incubation as judged by HRP-SA detection by western blotting (Figure 5D). Comparatively, lysates from cells treated with 5 and 10 μM Az-HNE needed 3-6 h of incubation for maximal labeling (Figure 5C). There was no detection of biotin-tagged proteins in DMSO control samples up to 3h of reaction (Figure 5A). However, there was a barely detectable signal in the DMSO controls after 6 h (Figure 5A). Biotin-tagged proteins from cells treated with as low as 1 μM Az-HNE were detected with a significantly higher signal compared to DMSO controls after 6 h of reaction (Figure 5B vs. 5A, respectively). It is interesting to note that the click chemistry reaction occurred in cell lysates with TCEP as the reductant, whereas the same reaction did not occur with peptide adducts. This is puzzling, however, different reaction conditions (i.e. Az-HNE adducted peptides in aqueous solution vs. Az-HNE adducted proteins in crude cell lysates) may have contributed to this difference. Click chemistry reactions performed with cell lysates in the presence of ascorbate were complete after ∼ 5 min (data not shown), as compared to ∼ 90 min for TCEP. The much higher rate for the click chemistry reaction with ascorbate compared to TCEP is consistent with the model peptide studies. However, biotin-tagged proteins were not affinity purified from non-modified proteins with SA beads when ascorbate was used as the reductant (data not shown). As shown below, using TCEP as the reductant resulted in specific recovery of biotin-tagged proteins. Therefore, TCEP was used in further experiments.
Figure 5.

Time dependence of click chemistry for labeling Az-HNE adducted proteins in RKO cells. Intact RKO cells were incubated with Az-HNE (1, 5, 10, 25, and 50 μM) and vehicle control (DMSO) for 1 h. The cells were lysed as described in the methods and then incubated with biotin linker alkyne (600 μM), TCEP (6.0 mM), ligand (13, 0.75 mM), and CuSO4 (6.0 mM) for 0, 1.5, 3, and 6 h. The degree of biotin labeling with click chemistry is determined by western blotting using HRP-SA. Protein load was 2.5 μg/lane. The biotin labeling is shown for control (Panel A), 1 μM Az-HNE (Panel B), 5 and 10 μM Az-HNE (Panel C), and 25 and 50 μM (Panel D).
Streptavidin purification of proteins biotin-tagged with click chemistry
Biotin-tagged proteins from lysates of cells treated with Az-HNE (5, 10, or 50 μM) were affinity purified with SA beads. Western blot analysis demonstrates that biotin-tagged proteins from lysates of cells treated with 50 μM Az-HNE were efficiently captured with SA beads (Lane 2, Figure 6B) with no detectable proteins in the elution fractions (Lanes 3-7, Figure 6B). Figure 6B shows the elution of biotin-tagged proteins using 70% CH3CN and 5% FA (Lane 8) and boiling in laemmli buffer (Lane 9). As shown in Figure 6A, DMSO controls had a low biotin signal in cell lysates (Lane 1), breakthrough (Lane 2), wash (Lanes 3-7), or elution (Lanes 8-9) fractions. The same fractions analyzed by western blotting were tested by silver stain analysis for total protein detection. The lysate and flow through lanes (Lanes 1 and 2, Figure 6C and D) had similar levels of total protein for both the control and 50 μM Az-HNE treated samples and the wash steps had higher levels of total protein in the sample for 50 μM Az-HNE treated samples compared to control samples, respectively (Lanes 3-5, Figure 6D and 6C, respectively). In the CH3CN elution step, significantly more proteins were eluted from SA beads incubated with the 50 μM Az-HNE treated sample vs. controls (Lane 8, Figure 6D and C, respectively). Similar protein bands were observed in the eluant from boiling SA beads for both control and 50 μM Az-HNE treated samples (Lane 9, Figure 6C and D, respectively). Therefore, biotin-tagged proteins were selectively enriched relative to non-tagged proteins by elution from SA beads with 70% CH3CN and 5% FA.
Figure 6.
SA bead purification of Az-HNE adducted protein conjugated to biotin. Cellular lysates (lane 1) containing biotin-tagged proteins (∼150 μg) were incubated with SA beads (75 μL; 1:1 in ammonium bicarbonate) overnight and then the beads were recovered in the morning and the breakthrough fraction (Lane 2) was collected. The beads were washed with successively with ammonium bicarbonate (Lane 3), 2 times with 1 M NaCl with 1% Igepal (Lane 4 and 5), ammonium bicarbonate (Lane 6), distilled H2O (Lane 7). Protein elution was done in 2 steps. Lane 8 represents elution with 70% CH3CN, 5% FA and Lane 9 represents elution by boiling in laemmli buffer containing 5% β-mercaptoethanol. Panels A and C are the vehicle control samples and panels B and D are 50 μM Az-HNE samples. Western blotting was performed on Panels A and B and silver stain analysis was done on panels C and D. S=biotin labeled standard curve.
Proteomic Analysis of Proteins Isolated with SA Beads
The total number of proteins identified from cells treated with vehicle control, 5, 10, and 50 μM Az-HNE treated samples were 32, 41, 107, and 118, respectively. Proteins unique to the 5, 10, and 50 μM Az-HNE treated cells compared to vehicle controls were 12, 58, and 91, respectively. A complete list of unique protein targets from Az-HNE treatment is displayed in Supporting Information (Table S1). The number of proteins identified corresponded to the concentration of Az-HNE used (i.e. increase in protein hits with increasing Az-HNE concentration), suggesting that the method is specific for HNE adduction of proteins. There were 39 common proteins identified between 50 and 10 μM Az-HNE treated samples (Table S1). Also, 8 out of 12 proteins identified in the 5 μM sample were also present in the 50 μM sample (Table S1). Overall the unique proteins found in the 50 μM Az-HNE treated samples had better quality MS/MS spectra, more distinct peptides identified, and greater sequence coverage compared to 10 and 5 μM treated samples (data not shown). Table 1 shows a select list of stress signaling proteins corresponding to the Heat shock response and ER stress response such as Hsp70 and Hsp90, 78-kDa glucose regulated protein (GRP-78), respectively, as well as proteins involved in redox regulation, xenobiotic metabolism, and protein folding (glutathione-S-transferase Pi, peroxiredoxin-1, and the 60 kDa mitochondrial heat shock protein, respectively). Hsp70, Hsp90, and protein disulfide isomerase isoform A3 (PDIA3) were identified previously as being modified by HNE in vivo (15-17). Table 2 shows the percent sequence coverage for the select list of proteins in correlation with the increase in Az-HNE concentration. GRP-78, peroxiredoxin-1, 60 kDa mitochondrial heat shock protein, and stress-70 protein are identified in the lowest Az-HNE concentration used (5 μM) and may represent significant targets of HNE adduction. Also, the percent sequence coverage for these proteins increases dramatically from 5 to 50 μM Az-HNE.
Table 1.
Select proteins identified by LC-MS/MS analysis of Az-HNE adducted proteinsa
| Protein | Swiss-Prot ID | Functionb | Localizationc |
|---|---|---|---|
| Heat shock 70 kDa protein 1 | P08107 | Protein folding | Cyt |
| Heat shock 70 kDa protein 1L | P34931 | Protein folding | Cyt |
| Heat shock 70 kDa protein 4 | O14992 | Protein folding | Cyt |
| Heat shock 90kDa α-2 | P07900 | Protein folding | Cyt |
| 78 kDa Glucose regulated protein | P11021 | Protein folding | ER |
| Protein disulfide isomerase A3 | P30101 | Protein folding | Cyt |
| Glutathione-S-transferase-Pi | P09211 | Xenobiotic metabolism | Cyt |
| Peroxiredoxin-1 | Q06830 | Redox regulation | Cyt |
| 60 kDa mitochondrial heat shock protein |
P10809 | Protein trafficking, protein folding |
MT |
| Stress-70 protein | P38646 | Cell proliferation | MT |
Proteins are selected from experiments with intact RKO cells treated with 50 μM Az-HNE. Total protein content of the cell lysates was 150 μg prior to SA bead purification.
Protein function is taken from the ingenuity analysis (http://www.ingeuity.com).
Protein localization is taken from the protein information resource website (http://pir.georgetown.edu). Cyt=cytoplasm, ER=endoplasmic reticulum, MT=mitochondria.
Table 2.
Percent coverage of select proteins adducted by Az-HNE in RKO cellsa
| Protein | 0 μM | 5 μM | 10 μM | 50 μM |
|---|---|---|---|---|
| Heat shock 70 kDa protein 1 | - | - | - | 9b |
| Heat shock 70 kDa protein 1L | - | - | - | 7 |
| Heat shock 70 kDa protein 4 | - | - | 6 | 8 |
| Heat shock 90kDa α-2 | - | - | 3 | 6 |
| 78 kDa Glucose regulated protein | - | 9 | 23 | 24 |
| Protein disulfide isomerase A3 | - | - | - | 7 |
| Glutathione-S-transferase-Pi | - | - | 23 | 36 |
| Peroxiredoxin-1 | - | 16 | 37 | 39 |
| 60 kDa mitochondrial heat shock protein |
- | 8 | 10 | 22 |
| Stress-70 protein | - | 10 | 10 | 25 |
This table represents the proteins identified from 3 different concentrations of Az-HNE applied exogenously to intact RKO cells.
The number value indicates the percent amino acid coverage of each protein identified by peptide fragmentation using LC-MS/MS analysis.
Click chemistry and proteomic analysis of biotin conjugated to Al-HNE adducted protein
To confirm the findings with Az-HNE, we repeated the same procedure with Al-HNE. In these experiments we used 2 mg of cell lysates to obtain better MS/MS spectra and identification of proteins. We first used the same lysis buffer for Al-HNE treated cells as with Az-HNE treated cells. However, the conjugation of Az-Biot to Al-HNE adducted proteins was negligible in the 5 and 10 μM Al-HNE treated samples after several hours of click chemistry (data not shown). Therefore we switched to using 100 mM HEPES, pH 7.5, 150 mM NaCl, 0.1 mM EDTA, and 1% Igepal as the lysis buffer. This resulted in efficient labeling of Al-HNE adducted proteins with Az-Biot as shown in Figure 7 (Lane 1; Panel A for 0 and 5 μM and Panel B for 10 and 50 μM Al-HNE). There was an increase in biotin labeling of Al-HNE adducted proteins from 5 to 50 μM Al-HNE as demonstrated with Az-HNE labeling (Figure 5). Affinity purification of biotin-tagged proteins from lysates of cells treated with 5, 10, and 50 μM Al-HNE is shown in Figure 7. There is efficient capture of biotin-tagged proteins with the 5 and 10 μM Al-HNE treated sample (Lanes 2-5, Figure 7A and 7B), with some flow through of biotin tagged proteins in the 50 μM sample. Elution of biotin-tagged proteins from 5, 10, and 50 μM Al-HNE treated samples are shown in Lane 6 of Figures 7A and B.
Figure 7.

Streptavidin purification of Al-HNE adducted proteins conjugated with biotin. Cellular lysates (Lane 1) containing Al-HNE adducted proteins conjugated with biotin (2 mg) were incubated with 1 ml of SA beads (1:1 in ammonium bicarbonate) for 2 h. After 2 h the beads were recovered by centrifugation and the breakthrough was collected (Lane 2). Successive washes include 1% SDS (Lane 3), 4 M urea (Lane 4), and 1 M NaCl (Lane 5). Elution of biotin was done with 70% CH3CN, 5% formic acid (Lane 6). Biotin tagged proteins were detected with HRP-SA and 2.5 μg of protein was loaded per lane. Panel A shows control (DMSO) and 5 μM Al-HNE and panel B shows 10 and 50 μM Al-HNE. S=biotin labeled standard curve.
Proteomic analysis of Al-HNE modified proteins
The total numbers of proteins identified from control, 5, 10, and 50 μM Al-HNE treated RKO cells was 50, 276, 456, and 538. In comparison, 21, 171, 67, and 322 proteins were identified as adducted in control, 5, 10, and 50 μM Az-HNE-treated cells, respectively using 2 mg of cell lysate for click chemistry and SA bead purification. A complete list of proteins for Al-HNE and Az-HNE from 2 mg of cell lysates are shown in Supporting Information (Table S2 and S3). Table 3 shows that the same stress signaling and redox regulatory proteins were found from both Al- and Az-HNE treatment of RKO cells. We found that highly abundant proteins were identified in the DMSO control samples when 2 mg of cell lysate was used. Hsp90α-2 was found in control samples for Az-HNE treated samples only, whereas GRP78, 60kDa mitochondrial heat shock protein, and the stress-70 protein were identified in the control samples for Az-HNE and Al-HNE treated cells. Peroxiredoxin-1 was identified in control samples for Al-HNE treated cells only. However the percent coverage for these proteins increased dramatically over the control. This suggests that although these highly abundant proteins are identified in controls, they are specific for Al-HNE and Az-HNE modification. Further, the percent coverage and overall similarity between the proteins identified using both Al-HNE or Az-HNE confirms that this method can reliably identify proteins adducted by HNE.
Table 3.
| Protein | 0 μM | 5 μM | 10 μM | 50 μM |
|---|---|---|---|---|
| Heat shock 70 kDa protein 1 | -a, -b | 17, 7 | 15, - | 21, 12 |
| Heat shock 70 kDa protein 1L | -, - | 9, 4 | 13, - | 15, 9 |
| Heat shock 70 kDa protein 4 | -, - | 27, 9 | 33, 3 | 37, 18 |
| Heat shock 90kDa α-2 | -, 3 | 11, 4 | 14, 4 | 16, 6 |
| 78 kDa Glucose regulated protein | 13, 10 | 39, 27 | 34, 6 | 46, 33 |
| Protein disulfide isomerase A3 | -, - | 18, 23 | 19, 7 | 31, 26 |
| Glutathione-S-transferase-Pi | -, - | 32, 18 | 48, 18 | 58, 5 |
| Peroxiredoxin-1 | 14, - | 34, 11 | 28, 11 | 51, 13 |
| 60 kDa mitochondrial heat shock protein |
9, 5 | 40, 23 | 44, 7 | 48, 47 |
| Stress-70 protein | 12, 3 | 37, 23 | 42, 12 | 42, 30 |
Percent coverage of select proteins from experiments using Al-HNE adducted proteins from RKO cells (2 mg of protein in cell lysates).
Percent coverage of proteins selected from Az-HNE adducted proteins in RKO cell lysates.
Discussion
This study reports the application of two different methods for labeling HNE adducted proteins with biotin for subsequent enrichment and identification by proteomic analysis. The first method attempted to utilize the modified Staudinger ligation for biotin conjugation of Az-HNE adducted proteins. The Staudinger ligation selectively couples an azide with triphenylphosphine by reaction of a methyl ester ortho to triphenylphosphine, which captures the nucleophilic aza-ylide by intramolecular cyclization to form a stable amide bond and a phosphine oxide (Scheme 1) (28). Using BiotTPhPh, we specifically labeled Az-HNE adducted proteins in lysates of RKO cells with biotin very efficiently (Figure 3). However, the results showed that biotin-conjugated proteins were not eluted from SA beads until their denaturation by boiling (Lane 9, Figure 4B), which also resulted in the elution of non-specific proteins (Lane 9, Figure 4C and D). Attempts to remove the nonspecific proteins with very stringent washes such as 5M NaCl, 5% Igepal, or 4M guanidine-HCl failed (data not shown). It is unknown why the biotin-conjugated proteins did not elute in the 70% CH3CN and 5% FA fraction, which was relatively free of non-labeled proteins. The lack of affinity purification of these biotin-tagged proteins directed us to using click chemistry as an alternative to the modified Staudinger ligation for conjugating biotin to HNE-adducted proteins.
The copper catalyzed Huisgen 1,3-dipolar cycloaddition reaction couples an azide with a terminal alkyne (35). Both azides and alkynes are stable in cells and in vivo, thus providing good probes for specifically labeling HNE modified proteins (28, 31, 32, 43). The reaction between the click chemistry reagents Az-HNE and Al-HNE with Al-Biot and Az-Biot, respectively, proceeded in the presence of TCEP in crude cell lysates, whereas in the peptide model studies the reaction did not occur. Typically, the reactants and products from click chemistry reactions appear insoluble in aqueous buffer, yet the reaction proceeds more efficiently than in organic solvent (34, 44). A potential explanation for this, proposed by Kolb et al, is that organic molecules that are poorly soluble in aqueous solution have higher reaction kinetics due to a greater free energy than when soluble in organic solvents (34). We also observe insoluble particulates during click chemistry reactions in cellular lysates, thus potentially explaining the observed efficient biotin labeling in cell lysates compared to model peptide studies. However, the model studies clearly show that Asc is the better choice for a reductant for efficient click chemistry. Also, studies in cellular lysates demonstrate that Asc is a better reductant for click chemistry than TCEP. Others have used Asc as the reductant for click chemistry in model systems (45), but it has not been reported for biological systems. Biotin-tagged proteins from click chemistry reactions done in the presence of Asc were not affinity purified with SA beads. As judged by coomassie staining, there was a similar profile of proteins that eluted from SA beads incubated with DMSO control and 50 μM Az-HNE treated samples. Metal-ion catalyzed oxidation of proteins from the presence of oxidants generated from CuSO4 and Asc, such as hydroxyl radical or superoxide (46), may have resulted in enhanced binding with sepharose beads or caused oligomerization of proteins. Oligomerization of proteins to biotin-tagged proteins would result in the appearance of non-specific proteins following affinity purification steps. Therefore, TCEP was used for further experiments rather than ascorbate as the reductant for click chemistry.
Proteomic analysis of affinity-purified biotin-conjugated proteins showed that similar proteins were identified for Al- and Az-HNE treated RKO cells (Table 3). This is in accordance with other studies demonstrating that phenyl sulfonate ester probes modified with either an azide (PSN3) or an alkyne (PS≡) used for activity-based protein profiling of serine esterases resulted in identification of similar proteins (31). Also, the PSN3 probe conjugation with the rhodamine-alkyne tag (Rh≡) occurred more readily than the PS≡ conjugation to the rhodamine-azide tag (RhN3) but the latter reaction had fewer non-specific interactions. Both reactions were reported to be complete within 1 h (31). By comparison, we observed a slower rate for click chemistry in RKO crude cell lysates with Az-HNE concentrations of 10 μM and lower (∼3-6 h). After 90 min, both 25 and 50 μM Az-HNE treated samples were completely labeled similar to the other study (31). In the present study, Al-HNE resulted in fewer non-specific bands as judged by western blot analysis in the control samples compared to Az-HNE treated samples (Lane 1, Figure 7A vs. Lane 1, Figure 6A). However, we observed more proteins in the Al-HNE-treated cells for control, 5, 10, and 50 μM than for Az-HNE-treated cells (50, 276, 456, 538 vs. 21, 171, 67, 322). The percent coverage for the select proteins listed in Table 3 are similar between Al-HNE and Az-HNE sample sets. Both the Az- and Al-HNE probes are comparable in the proteins they modify and are similar in reactivity with peptides and toxicity in cells. One discrepancy between the in vitro and in vivo study was the use of NaCNBH3 following cell lysis to stabilize Az- and Al-HNE Schiff base adducts on Lys residues of proteins (47). However, reversible Michael adducts on Lys residues must be stabilized with NaBH4 (14). Therefore, some Michael adducts to Lys may have been los during work-up procedures prior to proteomic analysis. Further studies will be aimed at characterizing HNE adducts on proteins using NaBH4 to ensure the recovery of all adducts. Nonetheless, the method described in this study provides an unambiguous analysis of proteins modified by HNE in vivo.
This study identified several proteins that were identified as in vivo targets of activated derivatives of xenobiotics. Bromobenzene and mycophenolic acid adduct to protein disulfide isomerase isoform-A3 (PDIA3) in rat liver (48, 49). The small molecule, S-(1,1,2,2-tetrafluoroethyl)-L-cysteine (TFEC), was shown to adduct the 60 kDa mitochondrial heat shock protein and the stress-70 protein in rat kidney (50). Both halothane and bromobenzene were shown to adduct GRP-78 in rat liver (49, 51). Glutathione-S-transferase-Pi was adducted by acetaminophen and BHT in mouse liver (52, 53). Hsp-90α was adducted by BHT in mouse lung (53) and peroxiredoxin-1 was adducted by acetaminophen in mouse liver (52). HNE has been previously shown to adduct to Hsp70, Hsp90, and PDIA3 (15-17), all of which were also identified in this analysis.
A previous microarray experiment performed with RKO cells treated with HNE, over the same concentration range used in the present study, demonstrated that the expression of several stress signaling proteins was induced via the heat shock response and the ER stress response. Some of the proteins identified as targets of HNE in the present study play important roles in the control of these pathways. For example, several heat shock proteins (i.e HSP-70, HSP-90, 60 kDa heat shock protein, mitochondrial precursor) and 78kDa glucose regulated protein precursor (GRP-78) (a regulator or ER stress) and stress-70 protein (mitochondrial protein involved in protein binding and cellular proliferation) were identified. GRP-78 and stress-70 protein were both strong hits with 8-11 unique peptides identified in lysates from cells treated with 50 μM Az-HNE (Table 1). Also both proteins were identified at all Az-HNE concentrations used (50, 10, and 5 μM; Table 1). When using 2 mg of cellular lysate protein, several of the heat shock proteins and redox regulatory proteins were identified at concentrations as low as 5 μM Az- or Al-HNE. This method can be used for an unbiased analysis of HNE modified proteins in cells and in vivo for attempting to understand the roles that protein modification plays in gene expression changes in response to oxidative stress.
Supplementary Material
Scheme 4.

Click chemistry of peptide adduct with biotin tag.
Acknowledgement
This research was supported by funds from the National Institutes of Health (P01-ES013125). We are grateful to Simona Codreanu, Elizabeth Burnette, Hansen Wong, and Matt Szapacs for helpful discussions of proteomic analysis, and Andrew Felts for synthesis of BiotTPhPh.
Abbreviations
- HNE
4-Hydroxy-2-nonenal
- Az-HNE
azido-tagged HNE
- Al-HNE
alkynyl-tagged HNE
- Az-Biot
biotin-conjugated azide
- Al-Biot
biotin-conjugated alkyne
- BiotTPhPh
biotin-containing triphenyl phosphine
- SA
streptavidin
- HRP-SA
streptavidin-conjugated horse-radish peroxidase
- DMEM
dulbecco’s modified eagles medium
- D-PBS
dulbecco’s phosphate buffered saline
- TCEP
tris-(2-carboxyethyl)-phosphine-HCl
- BHA
butylated hydroxyanisole
- MS/MS
tandem MS
- LC-MS/MS
liquid chromatography with electrospray ionization tandem MS
- CHIPS
complete hierarchical integration of protein searches
Footnotes
Supporting Information Available: Data comparing the adducts formed for HNE, Az-, and Al-HNE to Angiotension (Figure 1); data comparing the rates of adduct formation to 3 different peptides with an equimolar ratio of HNE:Az-HNE:Al-HNE (Figure 2); data comparing the ratio of adduct formation for HNE, Az-, and Al-HNE in the presence of an equimolar mixture of peptides (Figure 3); table showing all of the proteins identified from Az-HNE adducted proteins affinity purified from cell lysates containing 150 μg of cellular protein (Table 1); table showing all of the proteins identified in an experiment comparing Al- and Az-HNE adducted proteins from cell lysates containing 2 mg of cellular protein (Table 2 and 3, respectively). This information is available free of charge via the Internet at http://pubs.acs.org.
References
- (1).Marnett LJ, Riggins JN, West JD. Endogenous generation of reactive oxidants and electrophiles and their reactions with DNA and protein. J Clin Invest. 2003;111:583–593. doi: 10.1172/JCI18022. [DOI] [PMC free article] [PubMed] [Google Scholar]
- (2).Schneider C, Tallman KA, Porter NA, Brash AR. Two distinct pathways of formation of 4-hydroxynonenal. Mechanisms of nonenzymatic transformation of the 9- and 13-hydroperoxides of linoleic acid to 4-hydroxyalkenals. J Biol Chem. 2001;276:20831–20838. doi: 10.1074/jbc.M101821200. [DOI] [PubMed] [Google Scholar]
- (3).West JD, Marnett LJ. Endogenous reactive intermediates as modulators of cell signaling and cell death. Chem Res Toxicol. 2006;19:173–194. doi: 10.1021/tx050321u. [DOI] [PubMed] [Google Scholar]
- (4).Uchida K, Toyokuni S, Nishikawa K, Kawakishi S, Oda H, Hiai H, Stadtman ER. Michael addition-type 4-hydroxy-2-nonenal adducts in modified low-density lipoproteins: markers for atherosclerosis. Biochemistry. 1994;33:12487–12494. doi: 10.1021/bi00207a016. [DOI] [PubMed] [Google Scholar]
- (5).Grune T, Siems WG, Schonheit K, Blasig IE. Release of 4-hydroxynonenal, an aldehydic mediator of inflammation, during postischaemic reperfusion of the myocardium. Int J Tissue React. 1993;15:145–150. [PubMed] [Google Scholar]
- (6).Sayre LM, Zelasko DA, Harris PL, Perry G, Salomon RG, Smith MA. 4-Hydroxynonenal-derived advanced lipid peroxidation end products are increased in Alzheimer’s disease. J Neurochem. 1997;68:2092–2097. doi: 10.1046/j.1471-4159.1997.68052092.x. [DOI] [PubMed] [Google Scholar]
- (7).Selley ML. (E)-4-hydroxy-2-nonenal may be involved in the pathogenesis of Parkinson’s disease. Free Radic Biol Med. 1998;25:169–174. doi: 10.1016/s0891-5849(98)00021-5. [DOI] [PubMed] [Google Scholar]
- (8).Montine TJ, Huang DY, Valentine WM, Amarnath V, Saunders A, Weisgraber KH, Graham DG, Strittmatter WJ. Crosslinking of apolipoprotein E by products of lipid peroxidation. J Neuropathol Exp Neurol. 1996;55:202–210. doi: 10.1097/00005072-199602000-00009. [DOI] [PubMed] [Google Scholar]
- (9).West JD, Marnett LJ. Alterations in gene expression induced by the lipid peroxidation product, 4-hydroxy-2-nonenal. Chem Res Toxicol. 2005;18:1642–1653. doi: 10.1021/tx050211n. [DOI] [PubMed] [Google Scholar]
- (10).Ji C, Kozak KR, Marnett LJ. IkappaB kinase, a molecular target for inhibition by 4-hydroxy-2-nonenal. J Biol Chem. 2001;276:18223–18228. doi: 10.1074/jbc.M101266200. [DOI] [PubMed] [Google Scholar]
- (11).Neely MD, Sidell KR, Graham DG, Montine TJ. The lipid peroxidation product 4-hydroxynonenal inhibits neurite outgrowth, disrupts neuronal microtubules, and modifies cellular tubulin. J Neurochem. 1999;72:2323–2333. doi: 10.1046/j.1471-4159.1999.0722323.x. [DOI] [PubMed] [Google Scholar]
- (12).Dinkova-Kostova AT, Holtzclaw WD, Cole RN, Itoh K, Wakabayashi N, Katoh Y, Yamamoto M, Talalay P. Direct evidence that sulfhydryl groups of Keap1 are the sensors regulating induction of phase 2 enzymes that protect against carcinogens and oxidants. Proc Natl Acad Sci U S A. 2002;99:11908–11913. doi: 10.1073/pnas.172398899. [DOI] [PMC free article] [PubMed] [Google Scholar]
- (13).Levonen AL, Landar A, Ramachandran A, Ceaser EK, Dickinson DA, Zanoni G, Morrow JD, Darley-Usmar VM. Cellular mechanisms of redox cell signalling: role of cysteine modification in controlling antioxidant defences in response to electrophilic lipid oxidation products. Biochem J. 2004;378:373–382. doi: 10.1042/BJ20031049. [DOI] [PMC free article] [PubMed] [Google Scholar]
- (14).Sayre LM, Lin D, Yuan Q, Zhu X, Tang X. Protein adducts generated from products of lipid oxidation: focus on HNE and one. Drug metabolism reviews. 2006;38:651–675. doi: 10.1080/03602530600959508. [DOI] [PubMed] [Google Scholar]
- (15).Carbone DL, Doorn JA, Kiebler Z, Ickes BR, Petersen DR. Modification of heat shock protein 90 by 4-hydroxynonenal in a rat model of chronic alcoholic liver disease. J Pharmacol Exp Ther. 2005;315:8–15. doi: 10.1124/jpet.105.088088. [DOI] [PubMed] [Google Scholar]
- (16).Carbone DL, Doorn JA, Kiebler Z, Petersen DR. Cysteine modification by lipid peroxidation products inhibits protein disulfide isomerase. Chem Res Toxicol. 2005;18:1324–1331. doi: 10.1021/tx050078z. [DOI] [PubMed] [Google Scholar]
- (17).Carbone DL, Doorn JA, Kiebler Z, Sampey BP, Petersen DR. Inhibition of Hsp72-mediated protein refolding by 4-hydroxy-2-nonenal. Chem Res Toxicol. 2004;17:1459–1467. doi: 10.1021/tx049838g. [DOI] [PMC free article] [PubMed] [Google Scholar]
- (18).Hartley DP, Kroll DJ, Petersen DR. Prooxidant-initiated lipid peroxidation in isolated rat hepatocytes: detection of 4-hydroxynonenal- and malondialdehyde-protein adducts. Chem Res Toxicol. 1997;10:895–905. doi: 10.1021/tx960181b. [DOI] [PubMed] [Google Scholar]
- (19).Hartley DP, Kolaja KL, Reichard J, Petersen DR. 4-Hydroxynonenal and malondialdehyde hepatic protein adducts in rats treated with carbon tetrachloride: immunochemical detection and lobular localization. Toxicol Appl Pharmacol. 1999;161:23–33. doi: 10.1006/taap.1999.8788. [DOI] [PubMed] [Google Scholar]
- (20).Bennaars-Eiden A, Higgins L, Hertzel AV, Kapphahn RJ, Ferrington DA, Bernlohr DA. Covalent modification of epithelial fatty acid-binding protein by 4-hydroxynonenal in vitro and in vivo. Evidence for a role in antioxidant biology. J Biol Chem. 2002;277:50693–50702. doi: 10.1074/jbc.M209493200. [DOI] [PubMed] [Google Scholar]
- (21).Perluigi M, Fai Poon H, Hensley K, Pierce WM, Klein JB, Calabrese V, De Marco C, Butterfield DA. Proteomic analysis of 4-hydroxy-2-nonenal-modified proteins in G93A-SOD1 transgenic mice--a model of familial amyotrophic lateral sclerosis. Free Radic Biol Med. 2005;38:960–968. doi: 10.1016/j.freeradbiomed.2004.12.021. [DOI] [PubMed] [Google Scholar]
- (22).Uchida K, Itakura K, Kawakishi S, Hiai H, Toyokuni S, Stadtman ER. Characterization of epitopes recognized by 4-hydroxy-2-nonenal specific antibodies. Arch Biochem Biophys. 1995;324:241–248. doi: 10.1006/abbi.1995.0036. [DOI] [PubMed] [Google Scholar]
- (23).Uchida K, Szweda LI, Chae HZ, Stadtman ER. Immunochemical detection of 4-hydroxynonenal protein adducts in oxidized hepatocytes. Proc Natl Acad Sci U S A. 1993;90:8742–8746. doi: 10.1073/pnas.90.18.8742. [DOI] [PMC free article] [PubMed] [Google Scholar]
- (24).Lin D, Lee HG, Liu Q, Perry G, Smith MA, Sayre LM. 4-Oxo-2-nonenal is both more neurotoxic and more protein reactive than 4-hydroxy-2-nonenal. Chem Res Toxicol. 2005;18:1219–1231. doi: 10.1021/tx050080q. [DOI] [PubMed] [Google Scholar]
- (25).Soreghan BA, Yang F, Thomas SN, Hsu J, Yang AJ. High-throughput proteomic-based identification of oxidatively induced protein carbonylation in mouse brain. Pharm Res. 2003;20:1713–1720. doi: 10.1023/b:pham.0000003366.25263.78. [DOI] [PubMed] [Google Scholar]
- (26).Grimsrud PA, Picklo MJ, Sr., Griffin TJ, Bernlohr DA. Carbonylation of adipose proteins in obesity and insulin resistance: identification of adipocyte fatty acid-binding protein as a cellular target of 4-hydroxynonenal. Mol Cell Proteomics. 2007;6:624–637. doi: 10.1074/mcp.M600120-MCP200. [DOI] [PubMed] [Google Scholar]
- (27).Yan LJ, Orr WC, Sohal RS. Identification of oxidized proteins based on sodium dodecyl sulfate-polyacrylamide gel electrophoresis, immunochemical detection, isoelectric focusing, and microsequencing. Anal Biochem. 1998;263:67–71. doi: 10.1006/abio.1998.2799. [DOI] [PubMed] [Google Scholar]
- (28).Saxon E, Bertozzi CR. Cell surface engineering by a modified Staudinger reaction. Science. 2000;287:2007–2010. doi: 10.1126/science.287.5460.2007. [DOI] [PubMed] [Google Scholar]
- (29).Hang HC, Yu C, Kato DL, Bertozzi CR. A metabolic labeling approach toward proteomic analysis of mucin-type O-linked glycosylation. Proc Natl Acad Sci U S A. 2003;100:14846–14851. doi: 10.1073/pnas.2335201100. [DOI] [PMC free article] [PubMed] [Google Scholar]
- (30).Speers AE, Cravatt BF. A tandem orthogonal proteolysis strategy for high-content chemical proteomics. J Am Chem Soc. 2005;127:10018–10019. doi: 10.1021/ja0532842. [DOI] [PMC free article] [PubMed] [Google Scholar]
- (31).Speers AE, Cravatt BF. Profiling enzyme activities in vivo using click chemistry methods. Chem Biol. 2004;11:535–546. doi: 10.1016/j.chembiol.2004.03.012. [DOI] [PubMed] [Google Scholar]
- (32).Wang Q, Chan TR, Hilgraf R, Fokin VV, Sharpless KB, Finn MG. Bioconjugation by copper(I)-catalyzed azide-alkyne [3 + 2] cycloaddition. J Am Chem Soc. 2003;125:3192–3193. doi: 10.1021/ja021381e. [DOI] [PubMed] [Google Scholar]
- (33).Krasinski A, Radic Z, Manetsch R, Raushel J, Taylor P, Sharpless KB, Kolb HC. In situ selection of lead compounds by click chemistry: target-guided optimization of acetylcholinesterase inhibitors. J Am Chem Soc. 2005;127:6686–6692. doi: 10.1021/ja043031t. [DOI] [PubMed] [Google Scholar]
- (34).Kolb HC, Finn MG, Sharpless KB. Click Chemistry: Diverse Chemical Function from a Few Good Reactions. Angew Chem Int Ed Engl. 2001;40:2004–2021. doi: 10.1002/1521-3773(20010601)40:11<2004::AID-ANIE2004>3.0.CO;2-5. [DOI] [PubMed] [Google Scholar]
- (35).Kolb HC, Sharpless KB. The growing impact of click chemistry on drug discovery. Drug Discov Today. 2003;8:1128–1137. doi: 10.1016/s1359-6446(03)02933-7. [DOI] [PubMed] [Google Scholar]
- (36).Hopf H, Kruger A. Synthesis of cyclo-1,3-dien-5-ynes. Chemistry. 2001;7:4378–4385. doi: 10.1002/1521-3765(20011015)7:20<4378::aid-chem4378>3.0.co;2-i. [DOI] [PubMed] [Google Scholar]
- (37).Rivero M. Rodriguez, Carretero JC. Intramolecular Pauson-Khand reactions of alpha,beta-unsaturated esters and related electron-deficient olefins. J Org Chem. 2003;68:2975–2978. doi: 10.1021/jo026828g. [DOI] [PubMed] [Google Scholar]
- (38).Reizelman A, Wigchert SC, del-Bianco C, Zwanenburg B. Synthesis and bioactivity of labelled germination stimulants for the isolation and identification of the strigolactone receptor. Org Biomol Chem. 2003;1:950–959. doi: 10.1039/b210678g. [DOI] [PubMed] [Google Scholar]
- (39).Grandjean C, Boutonnier A, Guerreiro C, Fournier JM, Mulard LA. On the preparation of carbohydrate-protein conjugates using the traceless Staudinger ligation. J Org Chem. 2005;70:7123–7132. doi: 10.1021/jo0505472. [DOI] [PubMed] [Google Scholar]
- (40).Pirali T, Tron GC, Zhu J. One-pot synthesis of macrocycles by a tandem three-component reaction and intramolecular [3+2] cycloaddition. Org Lett. 2006;8:4145–4148. doi: 10.1021/ol061782p. [DOI] [PubMed] [Google Scholar]
- (41).Jentoft N, Dearborn DG. Labeling of proteins by reductive methylation using sodium cyanoborohydride. J Biol Chem. 1979;254:4359–4365. [PubMed] [Google Scholar]
- (42).Dennehy MK, Richards KA, Wernke GR, Shyr Y, Liebler DC. Cytosolic and nuclear protein targets of thiol-reactive electrophiles. Chem Res Toxicol. 2006;19:20–29. doi: 10.1021/tx050312l. [DOI] [PubMed] [Google Scholar]
- (43).Link AJ, Tirrell DA. Cell surface labeling of Escherichia coli via copper(I)-catalyzed [3+2] cycloaddition. J Am Chem Soc. 2003;125:11164–11165. doi: 10.1021/ja036765z. [DOI] [PubMed] [Google Scholar]
- (44).Speers AE, Adam GC, Cravatt BF. Activity-based protein profiling in vivo using a copper(i)-catalyzed azide-alkyne [3 + 2] cycloaddition. J Am Chem Soc. 2003;125:4686–4687. doi: 10.1021/ja034490h. [DOI] [PubMed] [Google Scholar]
- (45).Glaser M, Arstad E. “Click labeling” with 2-[18f]fluoroethylazide for positron emission tomography. Bioconjug Chem. 2007;18:989–993. doi: 10.1021/bc060301j. [DOI] [PubMed] [Google Scholar]
- (46).Buettner GR, Jurkiewicz BA. Catalytic metals, ascorbate and free radicals: combinations to avoid. Radiat Res. 1996;145:532–541. [PubMed] [Google Scholar]
- (47).Isom AL, Barnes S, Wilson L, Kirk M, Coward L, Darley-Usmar V. Modification of Cytochrome c by 4-hydroxy- 2-nonenal: evidence for histidine, lysine, and arginine-aldehyde adducts. Journal of the American Society for Mass Spectrometry. 2004;15:1136–1147. doi: 10.1016/j.jasms.2004.03.013. [DOI] [PubMed] [Google Scholar]
- (48).Shipkova M, Beck H, Voland A, Armstrong VW, Grone HJ, Oellerich M, Wieland E. Identification of protein targets for mycophenolic acid acyl glucuronide in rat liver and colon tissue. Proteomics. 2004;4:2728–2738. doi: 10.1002/pmic.200300836. [DOI] [PubMed] [Google Scholar]
- (49).Koen YM, Hanzlik RP. Identification of seven proteins in the endoplasmic reticulum as targets for reactive metabolites of bromobenzene. Chem Res Toxicol. 2002;15:699–706. doi: 10.1021/tx0101898. [DOI] [PubMed] [Google Scholar]
- (50).Bruschi SA, West KA, Crabb JW, Gupta RS, Stevens JL. Mitochondrial HSP60 (P1 protein) and a HSP70-like protein (mortalin) are major targets for modification during S-(1,1,2,2-tetrafluoroethyl)-L-cysteine-induced nephrotoxicity. J Biol Chem. 1993;268:23157–23161. [PubMed] [Google Scholar]
- (51).Witzmann FA, Jarnot BM, Parker DN, Clack JW. Modification of hepatic immunoglobulin heavy chain binding protein (BiP/Grp78) following exposure to structurally diverse peroxisome proliferators. Fundam Appl Toxicol. 1994;23:1–8. doi: 10.1006/faat.1994.1072. [DOI] [PubMed] [Google Scholar]
- (52).Qiu Y, Benet LZ, Burlingame AL. Identification of the hepatic protein targets of reactive metabolites of acetaminophen in vivo in mice using two-dimensional gel electrophoresis and mass spectrometry. J Biol Chem. 1998;273:17940–17953. doi: 10.1074/jbc.273.28.17940. [DOI] [PubMed] [Google Scholar]
- (53).Meier BW, Gomez JD, Zhou A, Thompson JA. Immunochemical and proteomic analysis of covalent adducts formed by quinone methide tumor promoters in mouse lung epithelial cell lines. Chem Res Toxicol. 2005;18:1575–1585. doi: 10.1021/tx050108y. [DOI] [PubMed] [Google Scholar]
Associated Data
This section collects any data citations, data availability statements, or supplementary materials included in this article.