

Abstract
Background/Aims
Previous functional MRI studies in individuals with amnestic mild cognitive impairment (AMCI), a putative, prodromal form of Alzheimer’s disease, reveal substantial regional changes in brain activation during episodic memory function.
Methods
Functional MRI was applied to examine changes in brain activation during different stages of episodic memory function using a subsequent memory task in individuals with AMCI relative to older normal controls.
Results
We found that the AMCI group displayed greater activation in the right hippocampus but less activation in the frontal cortex relative to the older normal control group during intentional encoding of items that were subsequently recognized. We observed nearly the opposite pattern of results for successful recognition. The AMCI group displayed less activation in the medial temporal cortex but greater activation in the frontal cortex. In addition, the AMCI group showed reduced activation in the medial temporal and frontal cortices during incidental encoding of novel information during recognition.
Conclusion
The results of the present study suggest that brain activation differences in individuals with AMCI are modulated by the stage of episodic memory examined (i.e. intentional vs. incidental encoding vs. recognition). These observations may help to clarify some of the conflicting findings regarding brain activation changes in AMCI.
Keywords: Incidental encoding, Intentional encoding, Memory success, Medial temporal cortex, Task performance, Prefrontal cortex, Alzheimer’s disease
Introduction
Amnestic mild cognitive impairment (AMCI) is a term used to describe a transitional state between normal aging and neurodegenerative dementias such as Alzheimer’s disease (AD) [1]. Individuals with AMCI display isolated episodic memory impairment relative to age-matched normal individuals but do not meet the clinical criteria for probable AD. Petersen [1] reported that approximately 12% of individuals diagnosed as having AMCI using published criteria developed AD over a 1-year period, and approximately 80% of AMCI patients developed AD over a 6-year period.
Impairment in the encoding and retrieval of episodic memories in AMCI and AD is thought to be caused by neuropathological changes in brain regions important for episodic memory function such as the medial temporal cortex [2], frontal cortex (FC) [3] and posterior cingulate and inferior parietal cortices [4, 5]. Several structural MRI studies have reported that individuals with AMCI and AD display greater atrophy in the medial temporal cortex relative to age-matched controls [see 6 for review]. Longitudinal, volumetric MRI studies have also found that hippocampal and entorhinal cortex volume reductions over time predicted individuals with AMCI who developed AD from those who did not [7, 8]. Furthermore, amyloid imaging studies have observed substantial β-amyloid deposition in the frontal, posterior cingulate and inferior parietal cortices [4, 9–12]. An important question is whether neuropathological changes result in identifiable functional variation in these brain regions as well.
Blood oxygenation level-dependent (BOLD), functional MRI (fMRI) studies of episodic memory have revealed robust activation in several regions involved in episodic memory function such as the medial temporal and frontal cortices [see 13 for review], and posterior cingulate and inferior parietal cortices [see 14 for review]. These same regions have also been shown to undergo pathophysiological changes during the AD neurodegenerative process [4, 12, 15, 16] . Indeed, fMRI activation changes during episodic memory function have been observed in these same regions in individuals with AMCI. However, the results from these studies have been equivocal. Increased activation in brain regions critical for episodic memory function has been reported in individuals with AMCI using paired-associate encoding and/or recognition paradigms [17–19] and during the encoding of words that were subsequently recognized [20, 21].
By contrast, other studies have found reduced activation in individuals with AMCI using other episodic memory paradigms including novel/familiar picture recognition [22–24] , adaptation to repeated presentation of the same visual stimuli [25] and encoding of complex visual stimuli (e.g. scenes, faces) [26, 27]. Still, other studies have reported both increased, as well as decreased fMRI activation in the same group of individuals with AMCI during episodic memory function. For example, Petrella et al. [28], using a face-name paired associate task very similar to the paradigm employed by the studies that have shown increased activation in AMCI [17–19], found that individuals with AMCI displayed reduced activation bilaterally in the FC during encoding and retrieval of face-name pairs and the left hippocampus during retrieval only. By contrast, these same individuals with AMCI had increased activation in the posterior frontal lobes during retrieval.
The exact reasons for these conflicting findings are unknown. All of the previous fMRI studies of episodic memory function in AMCI have varied along several experimental and clinical factors including, but not limited to: the behavioral paradigm employed, statistical methodology used, criterion for AMCI diagnosis or differing degrees of functional impairment on the continuum of deterioration from AMCI to AD. The clinical and experimental heterogeneity across these studies is likely to have been a significant contributing factor to the discrepant findings [29].
The purpose of the present study was to use BOLD fMRI to further examine regional changes in brain activation during successful episodic encoding and recognition to help clarify some of the reasons for such discrepant reports in individuals with AMCI relative to healthy older normal controls (ONC). We used a variant of an episodic subsequent memory encoding and recognition paradigm that has previously been shown to result in robust activation in the medial temporal cortex [e.g. 30] and prefrontal cortex [e.g. 31 ]. Based on the findings from some of the previous fMRI studies in AMCI (see above), we hypothesized that individuals with AMCI would display changes in fMRI activation relative to the ONC group during the intentional encoding of subsequently recognized items, during successful recognition, and during incidental encoding that can occur in recognition tasks [20, 21, 30, 32] in brain regions critical for episodic memory that are also affected by AD-related neuropathology (see above).
Participants and Methods
Participants
A total of 39 older adults participated in the study. The ONC group consisted of 23 cognitively healthy ONC and 16 individuals who met the criteria for AMCI [33, 34]. All participants were right-handed as determined by the Edinburgh Inventory [35] and provided informed consent as approved by the Rush University Medical Center Institutional Review Board.
Participants were recruited from 2 sources: the Rush Alzheimer’s Disease Center and the Memory and Aging Project [36]. The Rush Alzheimer’s Disease Center is a diagnostic treatment and referral center examining individuals with cognitive complaints. The Memory and Aging Project is a longitudinal clinical-pathologic study of aging and AD. All participants in this investigation received a detailed clinical evaluation including medical history, neurological and neuropsychological examinations, informant interview and laboratory tests [37, 38]. The evaluation incorporated the procedures recommended by the Consortium to Establish a Registry for AD [39]. The specific assessments that comprised the neuropsychological test battery have previously been described in detail [37]. Briefly, they examine a broad range of cognitive domains including semantic memory, working memory/attention, perceptual speed and visual-spatial ability. The measures used to assess episodic memory were immediate and delayed recall of the East Boston Story [40], the Consortium to Establish a Registry for AD 10-word list immediate recall, delayed recall and recognition [39] , and immediate and delayed recall of Story A from the Wechsler Memory Scale Logical Memory test [41].
The classification of ONC required normal neurological examination, normal cognition relative to the normative data for each of the neuropsychological test measures listed above and a score of ≥ 27 on the Mini-Mental State Examination [42]. The diagnostic criteria for AMCI were essentially those recommended by Petersen and Morris [33] and included: (1) presence of memory complaints by the patient that was preferably corroborated by an informant; (2) normal cognition relative to test normative data in all cognitive domains except episodic memory as measured by neuropsychological examination; (3) essentially intact activities of daily living, and (4) cognitive and functional status not consistent with a diagnosis of dementia. The exclusion criteria for all participants were evidence of any other neurological, psychiatric or systemic disorder that could cause cognitive impairment (e.g. stroke, Parkinson’s disease, major depression, substance abuse) and the presence of contraindications for MRI scanning (e.g. cardiac pacemakers, claustrophobia).
fMRI Procedures
Imaging was performed on a 1.5-tesla General Electric scanner with an LX Horizon high-speed gradient upgrade (General Electric Medical Systems Signa, Waukesha, Wisc., USA) with a standard quadrature head coil for signal acquisition. Head movement was minimized using foam pillows around the participant’s head, as well as a securing tape across the forehead. Magnet-compatible vision correction lenses were used when appropriate. Functional images (repetition time = 2,250 ms; echo time = 40 ms; 24-cm field of view; 84° flip angle; slice thickness = 6 mm with 0-mm gap; inplane resolution = 3.75 mm) were obtained using a T2*-weighted 2-dimensional gradient-echo spiral pulse sequence with higher order shimming [43] which is relatively insensitive to motion artifacts [44].
A total of 300 functional volumes were acquired for each participant for the encoding condition and 400 functional volumes for the recognition condition. Each condition included 2 discarded volumes that were acquired at the beginning of each run to allow for stabilization of the magnetic field. The total scanning time was 11 min and 20 s for the encoding condition and 15 min and 5 s for the recognition condition including 2 discarded functional volumes that were acquired at the beginning of each task to stabilize the magnetic field. A 3-dimensional Fourier transform spoiled gradient recalled pulse sequence scan (repetition time = 34 ms; echo time = 7 ms; 22-cm field of view; 35° flip angle; slice thickness = 1.6 mm; inplane resolution = 0.9375 mm) was acquired for all sections that received functional scans. These images were used to correlate functional activation with anatomical structures, i.e. voxels that are found to be significantly activated during the functional scan are overlaid on these structural images.
fMRI Task
The fMRI task consisted of serial presentations of black and white line drawings of nameable objects from the Snodgrass and Vanderwart training set [45] . Visual stimuli were presented to the participants using a magnet-compatible projector (Resonance Technology, Inc., Van Nuys, Calif., USA), which back-projected the visual images onto a screen that was mounted in the bore of the magnet. The participants viewed the projected image via a mirror-mounted head coil. A Macintosh Powerbook G4 (Cupertino, Calif., USA) computer was used to generate visual stimuli and control experimental parameters written in PsyScope software [46]. Behavioral responses were recorded via a magnet-compatible button-press device.
fMRI activation was evaluated for both the encoding and recognition phases of the experiment. Each phase consisted of 1 scanning series. During the encoding portion of the fMRI paradigm, the participants were asked to determine whether the image presented represented a man-made or a naturally occurring object and respond as quickly as possible. The items were presented at 5,000-ms intervals, and each picture was shown for 4,500 ms with a 500-ms interstimulus interval using an event-related design. Naturally occurring pictures (n = 50) were randomly intermixed with man-made ones (n = 50), with the requirement that no event type could be repeated >3 times, consecutively. Null events of the word ‘push’ (n = 50) were also randomly intermixed with the natural and man-made objects with the same display time and interstimulus interval. Behavioral responses to man-made and naturally occurring items and the null events were recorded by button presses in the left, right or both hands, respectively. There were a total of 150 events during the encoding task. Therefore, no 2 subjects received identical forms of the encoding task.
The participants were also asked to remember the items for the recognition phase of the fMRI experimental paradigm during which they would distinguish between items that had been previously presented during the encoding portion of the experiment and novel items that had not been shown. During recognition, the participants were asked to do the best they could, and to try and respond to every item as quickly as possible. There were no specific instructions given to the participants to encode the novel items that were presented during recognition. The previously presented and novel items were randomly intermixed with null events of the word ‘push’ such that every subject received a different form of the recognition task.
There were an average of 52 novel items intermixed with an average of 104 previously presented items (all 100 presented during encoding) and 44 null events of the word ‘push’ for every subject, with the restriction that there were no more than 3 sequential presentations of the same event type. For the recognition phase of the experiment, each of the stimuli was presented for 4,500 ms with a 500-ms interstimulus interval. Behavioral responses were recorded in a method similar to the encoding phase of the fMRI experiment. That is, responses to previously presented, novel and null events were recorded by button presses in the left, right or both hands, respectively. This approach to the recording of behavioral responses in which button presses in each hand were used to respond to the stimuli was done to insure that the instructions for the task and the task itself were fairly simple so that the memory-impaired individuals with AMCI were able to understand and perform the task adequately.
Statistical Analysis of Demographic and fMRI Task Performance Data
The demographic variables, fMRI behavioral performance data and the reaction times to the stimuli were analyzed using 2-sample between-group t tests or χ2 tests for the dichotomous variables of gender and APOE genotype with an α-level set at p < 0.05.
fMRI Data Image Processing
Image reconstruction was performed off-line by transferring the data to a Sun SparcStation (Sun Microsystems, Cupertino, Calif., USA). A gridding algorithm was employed to resample the raw data into a Cartesian matrix. Once individual images had been reconstructed, all T2*-weighted images were realigned to correct for within-scan motion using SPM2 (Wellcome Department of Cognitive Neurology, London, UK). The data were visually inspected and examined for signal artifacts and excessive motion using a custom software package (http://web.mit.edu/swg/software.htm) interfaced with SPM2. The individual subject data were excluded from further analysis if motion exceeded 3 mm in any direction (absolute maximum). Images with excessive signal intensity (>3 SD above the overall whole-brain mean signal intensity) were also excluded from each subjects functional volumes [see also 47].
To facilitate group comparisons, the structural T1-weighted 3-dimensional spoiled gradient recalled volumes were spatially normalized to a standard brain template provided by SPM2 using a 12-parameter affine normalization and nonlinear adjustments with 7 × 8 × 7 basis functions [48]. The spatial transformation parameters derived from normalizing the structural volume were applied to the realigned T2*-weighted images. The resultant realigned and normalized T2* volumes were then smoothed with a 8-mm full width at half maximum isotropic Gaussian kernel to compensate for residual between-subject variability after spatial normalization and to permit application of Gaussian random field theory to provide for corrected statistical inference [49]. The time series at each voxel were regressed on a reference waveform, and the significance of this regression was assessed with a t-statistic at each voxel to construct a SPM (T) map. The reference waveform was calculated by convolving a square wave representing the event (man-made/natural/push for encoding condition; old/new/push for recognition condition) with an estimated he-modynamic response function template [50].
Low-frequency drifts in the fMRI signal were removed from the data set by using a high-pass filter with an upper cutoff period of 128. Statistical analyses of the time series data were performed using the general linear model in SPM2. Temporal autocorrelation was estimated according to the first-order autoregressive method on suprathreshold voxels. A customized general linear model masking procedure (http://web.mit.edu/swg/software.htm) was employed to insure that signals from all voxels were represented within each participant’s functional volumes obtained for both the encoding and recognition phases of the fMRI experiment.
The data from 6 subjects were excluded from the second-level statistical analyses (3 participants from each group) to arrive at the final number of subjects (i.e., 23 and 16, for the ONC and AMCI groups, respectively). The data from 1 subject in the ONC group were excluded because of excessive motion during scanning, 2 subjects (both AMCI) were removed for poor performance during the encoding phase of the experiment, and the data from 3 subjects were not considered due to scanner/equipment malfunction (2 subjects from the ONC group and 1 from the AMCI group).
fMRI Data Statistical Analysis
Statistical analysis of the fMRI data included examination of brain regions displaying significant differences in the magnitude of activation between the AMCI and ONC groups for each of the contrasts examined. The performance data obtained during recognition were used to separate the fMRI volumes obtained during both encoding and recognition for the fMRI data analysis. The 4 trial types included [32, 51, 52] : ‘hits’ (i.e., items previously presented during encoding that were correctly identified as being presented during encoding) and ‘misses’ (previously presented items that were incorrectly identified as novel), ‘correct rejections’ (i.e., novel items correctly identified as novel) and ‘false alarms’ (i.e., novel items identified as being previously presented during encoding). Items that the participants failed to respond to were not included in the statistical analyses. The behavioral performance and reaction times during the encoding and recognition phases for each group can be seen in table 1.
Table 1.
Demographics and fMRI task performance data
| ONC | AMCI | p value | |
|---|---|---|---|
| Demographic variables | |||
| Age, years | 73.1 (5.5) | 77.0 (8.4) | 0.09 |
| Education, years | 16.2 (3.0) | 14.9 (3.3) | 0.22 |
| Gender (M/F) | 11/12 | 5/11 | 0.34 |
| APOE ε4 carriers, % | 22 | 25 | >0.90 |
| MMSE | 28.8 (1.2) | 26.3 (2.3) | <0.0011 |
| fMRI task performance | |||
| Encoding – total correct, % | 88.2 (14.1) | 83.0 (16.1) | 0.29 |
| Encoding RT – total, ms | 1,194.7 (213.4) | 1,456.0 (255.0) | 0.0011 |
| Recognition, % | |||
| Novel correct | 77.2 (14.2) | 65.9 (19.0) | 0.041 |
| Previously presented correct | 79.8 (12.9) | 59.0 (18.1) | 0.0002 |
| Recognition RT, ms | |||
| Novel only | 1,583.6 (314.6) | 1,881.7 (351.7) | <0.0011 |
| Previously presented only | 1,588.4 (274.6) | 1,829.3 (366.5) | 0.021 |
MMSE = Mini-Mental Status Exam; APOE ε4 = apolipoprotein e4 allele; RT = reaction time. The p values represent the results of the 2-group t tests.
Comparisons where the ONC group was significantly better relative to the AMCI group.
The statistical analysis of the contrasts of interest for both encoding and recognition would allow us to determine differences in the magnitude of brain activation during 3 separate stages of episodic memory function (i.e., intentional encoding, successful recognition and incidental encoding during recognition) in individuals with AMCI relative to ONC. First, we conducted a conjunction analysis of the encoding data in which we used the ONC group activation as an inclusive mask to determine brain regions where the AMCI group displayed similar activation as the ONC group. This was done to insure that both groups had similar activation in visual areas that would be critical for task performance. Second, we evaluated group differences in fMRI activation for each contrast of interest using a 2-group, between-subjects t test. Group differences in brain activation during both encoding and recognition were first evaluated across the entire brain with a False Discovery Rate (FDR) correction for multiple comparisons (p value of 0.05, cluster size of 10 contiguous voxels).
We then conducted follow-up region of interest (ROI) analyses that were restricted to the 4 a priori hypothesized regions, including the FC (consisting of inferior and medial FC), the medial temporal cortex (including the hippocampus and parahippocampal cortex), the posterior cingulate cortex (consisting of the posterior cingulate and retrosplenial cortices) and the inferior parietal cortex. These 4 ROIs were chosen because previous imaging studies indicate that these regions are not only critical for normal episodic memory function but also undergo pathophysiological changes prior to the onset of clinical AD (see ‘Introduction’). The ROIs were developed using the Wake Forest Pick Atlas software [53] . All ROI analyses were conducted at a statistical threshold of p < 0.01, uncorrected (cluster size = 10 contiguous voxels).
Encoding and Subsequent Memory Contrasts
The 2 contrasts that were generated from the functional volumes obtained during the encoding phase of the experiment were identical to those reported in several previous studies with similar episodic memory tasks (e.g. [32]). For the first encoding contrast, the functional volumes obtained during the encoding phase of the experiment were divided into 2 trial types: volumes acquired during the presentation of the line drawings (irrespective of whether they were man-made or naturally occurring items), and volumes that were obtained during presentation of the baseline ‘push’ condition. This resulted in the contrast of ‘encoding versus push’, and was used to determine differences in brain activation during encoding between the AMCI and ONC groups irrespective of whether or not these items were correctly identified as PPE during the recognition phase of the experiment.
Although this was not our primary contrast of interest, it was used to determine if the AMCI group displayed reduced or increased activation in lower-order visual processing areas that might limit the interpretation of the subsequent analyses of the fMRI data that are discussed below. We chose not to use the ‘push’ condition as a baseline for the subsequent analyses discussed below because prior studies [54, 55] suggest that individuals with AMCI and AD display reduced deactivation to low-level baseline conditions relative to active conditions in similar brain regions as those that are the focus of this paper.
For the second contrast of the encoding data, the functional volumes obtained during the encoding phase of the experiment were divided into 2 trial types based on recognition performance: the items seen during encoding that were correctly recognized during the recognition phase of the experiment (‘hits’) and those that were not correctly recognized (‘misses’). This contrast was identical to that used in numerous previous studies [32, 51, 52] and corresponded to the examination of subsequent memory. It served to determine similarities and differences between the 2 groups that occurred during the intentional encoding of correctly recognized (hits) versus incorrectly recognized (misses) items based on behavioral performance during the recognition phase of the experiment.
Recognition Contrasts
The analysis of group differences in brain activation between the AMCI and ONC groups during the recognition phase of the fMRI session consisted of 3 contrasts that were based on the 4 trial types outlined in the ‘fMRI Data Analysis’ section above (e.g. hits, misses, correct rejections and false alarms). The first contrast was ‘hits versus misses’ and was identical to the subsequent memory analysis of the encoding data except that the functional volumes were acquired during the recognition phase of the experiment. This contrast was used to evaluate group differences during recognition for items that had been previously presented during encoding.
The final 2 contrasts were done to evaluate differences between the 2 groups for encoding of the novel items (i.e. incidental encoding) that were presented during recognition [32]. The contrast of ‘correct rejections versus false alarms’ was used to evaluate group differences during the successful discrimination of the novel items that were first presented during recognition and were not shown during encoding. The contrast of ‘correct rejections versus hits’ was applied to evaluate incidental encoding of the novel items first presented during recognition, using a more traditional novel versus previously presented contrast [22, 56, 57] for items that were correctly classified as being either novel or previously shown. Although there was no postscan recognition test, the incidental encoding of the novel items during recognition would provide additional information about episodic encoding when there were no explicit instructions to encode the novel items. This would allow us to determine differences between the ONC and AMCI groups during intentional (i.e. when explicit instructions were given to try and remember the items presented) versus incidental (i.e. encoding when no explicit instructions to remember were given).
Results
Demographics and fMRI Task Performance
The demographic and performance data and the results of the statistical analysis can be seen in table 1. As expected, the AMCI group had significantly lower Mini-Mental State Examination scores relative to the ONC group (p < 0.001). The 2-sample t tests failed to reveal significant differences between the AMCI and ONC groups in terms of age (p = 0.09) and education (p = 0.22). The χ2 analyses of the dichotomous variables of APOE genotype and gender did not yield any significant differences between the 2 groups either (p > 0.30). Since there were no significant differences between the groups in terms of education, gender and APOE genotype, these genetic and demographic variables were not included as covariates in the fMRI data group analyses. However, because there was a trend toward older age in the AMCI group, follow-up analyses were conducted using age as a covariate to determine if age was significantly influencing the group differences in fMRI activation.
The analyses of behavioral performance indicated that the AMCI and ONC groups were not significantly different for accuracy in determining whether the line drawings were man-made or naturally occurring during encoding (p = 0.29). However, the AMCI group performed significantly poorer than the ONC group during recognition for both novel (p = 0.04) and previously presented (p < 0.001) items. Furthermore, the AMCI group had significantly longer reaction times during encoding (p = 0.001) and during recognition for both novel (p = 0.008) and previously presented (p = 0.02) items. These results indicate that the AMCI group had significantly poorer episodic recognition and were slower to respond to items during both encoding and recognition.
Group Differences in fMRI Activation
Encoding Contrasts
Perceptual Processing: Conjunction Analysis – Encoding versus Push
The conjunction analysis for the contrast of encoding versus push was used to determine similarities in the patterns of brain activation in the ONC and AMCI groups during basic perceptual processing (see fig. 1a). Both the ONC and AMCI groups displayed activation in several overlapping brain regions including the right occipital lobe, left cerebellum, right hippocampus, right inferior parietal cortex, and bilaterally in specific regions within the medial and inferior FC. Since there was a nonsignificant trend for the AMCI group to be older than the ONC group, we conducted a follow-up analysis that included age as a covariate. The results were nearly identical, suggesting that differences in age between the 2 groups did not significantly influence the findings. This indicates that both the AMCI and ONC groups displayed similar activation in brain regions that are important for visual processing and episodic memory function. Table 2 displays the results of the conjunction analysis.
Fig. 1.
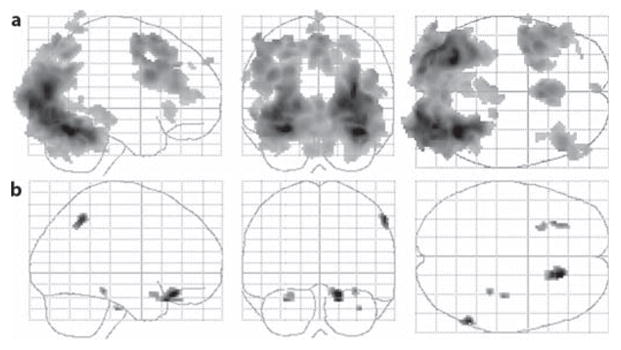
Results of the encoding contrast of encoding versus push. a Results of the conjunction analysis displayed on a glass brain used to determine regions of common activation between the ONC and AMCI groups. b Regions where the ONC group displayed significantly greater activation relative to the AMCI group for this same contrast. The cluster size was 10 contiguous voxels (p < 0.01, uncorrected).
Table 2.
Montreal Neurological Institute (MNI) coordinates of the local maxima for all significant clusters displaying similarities and differences between the 2 groups during encoding and for the subsequent memory analysis
| Region | MNI coordinates |
t value | p value | ||
|---|---|---|---|---|---|
| x | y | z | |||
| Encoding: encoding versus push | |||||
| Common activation in AMCI and ONC groups | |||||
| R posterior hippocampus [9] | 20 | −28 | −8 | 3.81 | <0.0001 |
| R middle frontal cortex (BA46) [616] | 46 | 30 | 22 | 5.23 | <0.0001 |
| L medial frontal cortex (BA8) [431] | −2 | 20 | 50 | 5.88 | <0.0001 |
| R inferior frontal cortex (BA47) [107] | 32 | 26 | −4 | 3.28 | 0.001 |
| L inferior frontal cortex (BA9) [2,439] | −42 | 8 | 30 | 6.76 | <0.0001 |
| L inferior frontal cortex (BA47) [42] | −34 | 24 | 0 | 3.35 | 0.001 |
| R superior frontal cortex (BA6) [306] | 4 | 12 | 62 | 5.89 | <0.0001 |
| R inferior parietal cortex (BA7) [14] | 6 | −78 | 52 | 3.53 | 0.001 |
| L precentral cortex (BA6) [21] | −62 | 2 | 32 | 3.50 | 0.001 |
| L postcentral cortex (BA7) [141] | −6 | −54 | 70 | 3.96 | <0.0001 |
| R occipital cortex (BA19) [6,574] | 32 | −84 | 16 | 9.48 | <0.0001 |
| L cerebellum [7,061] | −28 | −68 | −16 | 9.46 | <0.0001 |
| ONC > AMCI | |||||
| R inferior frontal cortex (BA47) [124] | 16 | 30 | 18 | 3.54 | 0.001 |
| L inferior frontal cortex (BA47) [24] | −28 | 14 | −20 | 2.77 | 0.004 |
| L inferior frontal cortex [21] | −30 | 26 | −24 | 3.05 | 0.002 |
| R inferior parietal cortex (BA40) [37] | 58 | −52 | 48 | 3.35 | 0.001 |
| R parahippocampal cortex (BA36) [12] | 32 | −34 | −16 | 2.94 | 0.003 |
| R parahippocampal cortex (BA36) [12] | 36 | −22 | −32 | 2.91 | 0.003 |
| Encoding: hits versus misses | |||||
| ONC > AMCI | |||||
| L inferior frontal cortex (BA9) [102] | −48 | 10 | 34 | 3.40 | 0.001 |
| L inferior frontal cortex (BA9) [18] | −50 | 2 | 20 | 2.49 | 0.006 |
| AMCI > ONC | |||||
| R hippocampus [20] | 24 | −16 | −14 | 2.68 | 0.005 |
Figures in parentheses represent Brodmann’s area (BA) and values in square brackets are cluster sizes. All p values are uncorrected. R = Right; L = left.
Intentional Encoding: Group Difference Analysis – Encoding versus Push
The statistical analysis of group differences in fMRI activation for the contrast of encoding versus push (fig. 1b) during intentional encoding revealed that the ONC group displayed significantly greater activation than the AMCI group in different brain regions than those observed in the conjunction analysis. These included the right parahippocampal gyrus, right inferior parietal cortex, and bilaterally in specific regions of the inferior FC. There were no brain regions in which the AMCI group displayed greater fMRI activation than the ONC group for this contrast. These results were essentially the same after including age as a covariate. This indicates that the ONC group displayed greater fMRI activation during encoding (irrespective of whether or not the items were successfully recognized during recognition). Table 2 displays the coordinates of the local maxima and the results of the statistical analyses for all significant clusters for this analysis.
Subsequent Memory: Intentional Encoding Contrast – Hits versus Misses
Group differences in fMRI activation during the encoding of items that were subsequently successfully recognized (hits versus misses) were not significant after whole-brain FDR correction for multiple comparisons. The follow-up ROI analysis revealed that the AMCI group displayed significantly greater activation in the right hippocampus ( fig. 2a). By contrast, the ONC group had significantly greater activation in the left inferior FC (fig. 2b). These results were nearly identical after including age as a covariate in the statistical model. Table 2 displays the coordinates of the local maxima for all significant clusters for the subsequent memory ROI analyses. These results indicate that the AMCI group displays hypoactivation in the medial and inferior FC but hyper-activation in the medial temporal cortex during intentional encoding of items that were recognized successfully.
Fig. 2.

Results of the subsequent memory intentional encoding contrast of hits versus misses. a Results of the ROI analysis of medial temporal cortex regions where the AMCI group showed greater activation relative to the ONC group. The numbers above each slice represent the coordinate in the y direction moving rostral (left side) to caudal (right side). b Inferior FC regions where the AMCI group displayed significantly less activation relative to the ONC group. The numbers above each slice represent the coordinate in the z direction moving dorsal (left side) to ventral (right side). The cluster size was set at 10 contiguous voxels (p < 0.01, uncorrected). The images are oriented in standard radiological view in which the right hemisphere is displayed on the left side of the brain image and the left hemisphere on the right side of the brain image.
Recognition Contrasts
Recognition Success – Hits versus Misses
The whole-brain analyses of recognition success for the contrast of ‘hits versus misses’ failed to reveal any brain regions displaying group differences after FDR correction for multiple comparisons. The follow-up ROI analysis showed that the AMCI group had significantly greater activation than the ONC group in the left inferior FC [Brodmann area (BA) 47; fig. 3a]. By contrast, the ONC group displayed significantly greater activation than the AMCI group bilaterally in the medial prefrontal cortex (BA11; fig. 3b) and the left parahippocampal cortex (fig. 3c). The results of the statistical analyses were nearly identical after including age as a covariate in the statistical model. These findings indicate that the AMCI group displays hyperactivation in the medial FC but hypoactivation in the inferior frontal and medial temporal cortices during successful recognition. Table 3 presents the results of the statistical analysis and the coordinates of the local maxima for all significant clusters for the ROI analyses.
Fig. 3.
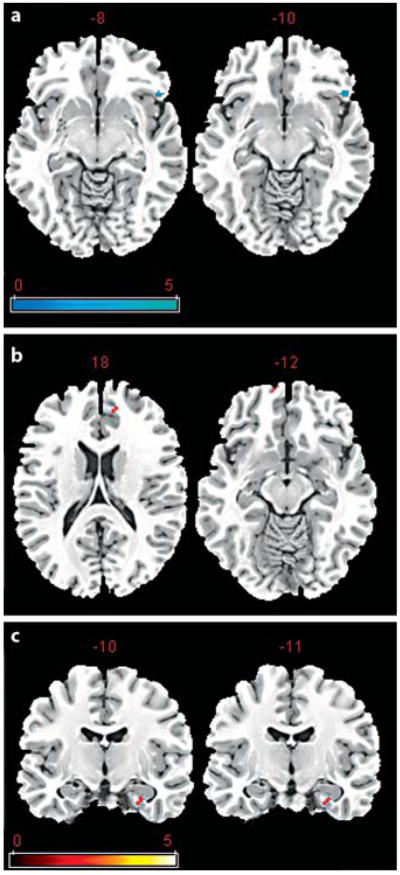
Results of the recognition contrast of hits versus misses. a Results of the ROI analysis of inferior FC regions where the AMCI group showed greater activation relative to the ONC group. The numbers above each slice represent the coordinate in the z direction moving dorsal (left side) to ventral (right side). b, c Medial frontal and parahippocampal regions in which the AMCI group displayed significantly less activation relative to the ONC group. The numbers above each slice in c represent the coordinate in the y direction moving rostral (left side) to caudal (right side). The cluster size was set at 10 contiguous voxels (p < 0.01, uncorrected). The images are oriented in standard radiological view in which the right hemisphere is displayed on the left side of the brain image and the left hemisphere on the right side of the brain image.
Table 3.
Montreal Neurological Institute coordinates of the local maxima for all significant clusters for the recognition data
| Region | MNI coordinates |
t value | p value | ||
|---|---|---|---|---|---|
| x | y | z | |||
| Recognition: hits versus misses | |||||
| ONC > AMCI | |||||
| L parahippocampal cortex (BA35) [25] | −32 | −12 | −24 | 2.71 | 0.005 |
| R medial prefrontal cortex (BA11) [13] | 8 | 62 | −12 | 2.62 | 0.006 |
| L medial prefrontal cortex (BA11) [17] | −16 | 46 | 18 | 2.60 | 0.007 |
| AMCI > ONC | |||||
| L inferior frontal cortex (BA47) [28] | −50 | 24 | −12 | 2.81 | 0.004 |
| Encoding during recognition | |||||
| Correct rejections versus false alarms: ONC > AMCI | |||||
| R parahippocampal cortex (BA20) [104] | 38 | −12 | −20 | 4.09 | <0.001 |
| R hippocampus | 34 | −8 | −22 | 2.76 | 0.003 |
| L hippocampus [44] | −36 | −24 | −10 | 2.94 | 0.003 |
| R posterior cingulate cortex (BA30) [144] | 12 | −54 | 6 | 3.40 | 0.001 |
| R medial prefrontal cortex (BA9) [74] | −6 | 50 | 40 | 3.45 | 0.001 |
| R medial prefrontal cortex (BA9) [58] | 22 | 38 | 28 | 3.22 | 0.001 |
| L medial prefrontal cortex (BA10) [248] | 20 | 50 | 10 | 3.43 | 0.001 |
| L medial prefrontal cortex (BA10) [25] | −4 | 50 | 8 | 2.85 | 0.004 |
| R inferior frontal cortex (BA46) [23] | 48 | 44 | 14 | 2.66 | 0.004 |
| L inferior frontal cortex (BA10) [128] | −42 | 40 | 14 | 3.31 | 0.001 |
| L inferior frontal cortex (BA44) [55] | −48 | 2 | 20 | 3.05 | 0.002 |
| L inferior frontal cortex (BA46) [71] | −42 | 8 | 38 | 2.90 | 0.003 |
| L inferior parietal cortex (BA2) [33] | −46 | −24 | 38 | 2.93 | 0.003 |
| L inferior parietal cortex (BA40) [21] | −44 | −50 | 60 | 2.65 | 0.004 |
| Correct rejections versus hits: ONC > AMCI | |||||
| R hippocampus [33] | 42 | −18 | −18 | 3.54 | 0.001 |
| R parahippocampal cortex (BA28) [132] | 24 | −18 | −22 | 3.37 | 0.001 |
| R medial prefrontal cortex (BA10) [69] | 10 | 60 | 10 | 3.51 | 0.001 |
| L medial prefrontal cortex (BA9) [35] | −6 | 50 | 42 | 3.25 | 0.001 |
| R medial frontal cortex (BA6) [229] | 4 | −30 | 60 | 3.45 | 0.001 |
| L medial frontal cortex (BA8) [285] | −6 | 26 | 52 | 3.06 | 0.002 |
| R medial frontal cortex (BA6) [63] | 4 | 0 | 62 | 2.94 | 0.003 |
| R inferior frontal cortex (BA47) [90] | 30 | 26 | −22 | 3.59 | <0.0001 |
| R inferior frontal cortex (BA47) [55] | 58 | 34 | −10 | 3.41 | 0.001 |
| L inferior frontal cortex (BA47) [122] | −46 | 24 | −14 | 3.42 | 0.001 |
| L inferior frontal cortex (BA13) [21] | −40 | 22 | 10 | 2.89 | 0.003 |
| L inferior frontal cortex (BA13) [21] | −52 | 6 | 22 | 2.76 | 0.004 |
| L inferior parietal cortex (BA40) [88] | −42 | 50 | 60 | 3.77 | <0.0001 |
Figures in parentheses represent Brodmann’s area (BA) and values in square brackets are cluster sizes. All p values are uncorrected. R = Right; L = left. All p values are uncorrected and reflect the results of each ROI analysis.
Incidental Encoding during Recognition – Correct Rejections versus False Alarms
The novel items that were first presented during the recognition phase of the experiment were used to examine group differences in fMRI activation during incidental encoding, because there were no instructions given to try and remember these novel stimuli. The whole-brain analyses for the recognition contrast of incidental encoding (correct rejections vs. false alarms) failed to reveal any brain regions displaying group differences after FDR correction for multiple comparisons.
The follow-up ROI analysis indicated that the ONC group displayed significantly greater activation than the AMCI group (see fig. 4) in the right posterior cingulate cortex (BA30), the left inferior parietal cortex (BA2), bilaterally in the hippocampus, and several clusters bilaterally in the medial (BA9 and 10) and inferior (BA10, 44, and 46) FC. By contrast, there were no brain regions in which the AMCI group displayed significantly greater activation than the ONC. The results of the statistical analyses were nearly identical after including age as a covariate in the statistical model. Table 3 displays the findings of the statistical analysis and the coordinates of all local maxima for all significant clusters for the ROI analyses. These results indicate that the AMCI group dis-played hypoactivation in all ROIs, including the hippocampus, whereas there were no regions in which the AMCI group showed hyperactivation for incidental encoding during recognition.
Fig. 4.

Results of the incidental encoding during the recognition contrast of correct rejections versus false alarms. a, b Results of the ROI analysis of the hippocampal and inferior parietal regions where the AMCI group showed significantly less activation relative to the ONC group. c Frontal and posterior cingulate regions where the AMCI group displayed less activation than the ONC group. The cluster size was set at 10 contiguous voxels (p < 0.01, uncorrected). The images are oriented in standard radiological view in which the right hemisphere is displayed on the left side of the brain image and the left hemisphere on the right side of the brain image.
Incidental Encoding during Recognition: Correct Rejections versus Hits
In a second comparison of incidental encoding during recognition we examined group differences in brain activation during the presentation of items correctly classified as being novel (correct rejections) relative to items correctly classified as being previously presented during encoding (hits). The whole-brain analyses of this incidental encoding during recognition contrast (correct rejections vs. false alarms) failed to reveal any brain regions displaying group differences after FDR correction for multiple comparisons.
The follow-up ROI analysis indicated that the ONC group displayed significantly greater activation than the AMCI group in the right hippocampus, right parahippocampal cortex (BA28), left inferior parietal cortex (BA40) and several additional clusters bilaterally in the inferior (BA13 and 47) and medial (BA6, 8–10) FC. By contrast, there were no brain regions in which the AMCI group showed significantly greater activation than the ONC. The results of the statistical analyses were nearly identical after including age as a covariate in the statistical model. These findings are consistent with those of the previous contrast used to examine incidental encoding during recognition. That is, the AMCI group displayed hypoactivation in nearly all of the ROIs examined, including the hippocampus. Table 3 gives the results of the statistical analysis and the coordinates of all local maxima for all significant clusters for the ROI analyses.
Discussion
In the present study we used fMRI to examine changes in brain activation during successful, intentional episodic memory encoding, successful recognition and incidental encoding during recognition in individuals with AMCI relative to an ONC group. We applied a variant of a subsequent memory paradigm [20, 30, 32, 51, 52] to evaluate fMRI activation changes in brain regions critical for normal episodic memory function that also undergo pathophysiological changes early in AD including the medial temporal cortex [38, 58, 59], parts of the inferior and medial FC [4, see 13, 16 for reviews], and inferior parietal and posterior cingulate cortices [4, 14, 16] in individuals with AMCI. We hypothesized that individuals with AMCI would display changes in brain activation in these structures during both encoding and recognition relative to an ONC group.
We found that the AMCI group had significantly reduced activation relative to the ONC group during intentional encoding of subsequently recognized items (i.e. encoding contrast of hits versus misses) in the left inferior FC. By contrast, individuals with AMCI displayed significantly greater activation in the right hippocampus for this same contrast. Several previous fMRI studies have examined brain activation changes during intentional episodic encoding in individuals with AMCI. For example, Kircher et al. [60] used a very similar subsequent memory paradigm (employing words instead of line drawings) and found that individuals with AMCI displayed greater activation in the hippocampus, medial FC and cingulate gyrus during the encoding of words that were subsequently recognized. Hamalainen et al. [61] also reported increased activation in the middle and inferior FC, hippocampus/parahippocampal cortex and fusiform gyrus but reduced activation in the cingulate gyrus during encoding of novel picture/word paired associates in individuals with AMCI. Petrella et al. [28] reported reduced activation in the medial and inferior FC during encoding of face/name paired associates in individuals with AMCI but did not find any brain regions where the AMCI group displayed greater activation during encoding. However, Machulda et al. [26] reported that individuals with AMCI showed a reduced extent of activation (i.e. number of contiguous and noncontiguous voxels) in a manually traced ROI that included the hippocampus, and parahippocampal and fusiform cortices during the encoding of complex scenes.
In general, these studies of intentional encoding seem to indicate that individuals with AMCI display increased activation in parts of the medial temporal cortex during intentional encoding, when the subjects are explicitly given instructions to encode information irrespective of the behavioral paradigm employed. These findings suggest that individuals with AMCI display hyperactivation in the medial temporal cortex regions that are critical for normal episodic memory function in certain experimental situations that require intentional encoding of episodic information, at least when measured with BOLD fMRI.
However, recently Xu et al. [24] used quantitative arterial spin labeling perfusion fMRI to evaluate regional changes in brain perfusion during intentional episodic encoding. These authors found that an ONC group demonstrated a 22.7% increase in cerebral perfusion in the right parahippocampal gyrus, whereas no change was observed in the right parahippocampal gyrus in the AMCI group. These latter results are of interest because arterial spin labeling fMRI might provide more easily interpretable information about functional changes in specific components of the hemodynamic BOLD signal, and give a more complete picture of task-related functional changes in brain regions critical for episodic memory that might be more useful than BOLD fMRI alone [see 62 for review].
In the present study, we found the opposite pattern of results during successful recognition of the items previously presented during encoding (i.e., recognition contrast of hits vs. misses). The AMCI group was found to display significantly reduced activation relative to the ONC group in the left parahippocampal gyrus and bilaterally in the medial FC, but greater activation in the left inferior FC, during successful recognition of the previously encoded items. Several previous studies have reported fMRI activation changes in AMCI during episodic recognition and/or retrieval. Consistent with the findings of the present study, Petrella et al. [28] reported reduced activation bilaterally in the FC and the left hippocampus but increased activation in the posterior frontal lobes in AMCI during retrieval of face/name paired associates that had been previously presented during encoding.
Johnson et al. [22] found reduced activation in AMCI in the right posterior cingulate cortex and precuneus during presentation of line drawing that had previously been encoded prior to scanning. More recently, Mandzia et al. [23] observed that individuals with AMCI displayed reduced activation in the left hippocampus and in several regions bilaterally throughout the FC but increased activation in the left fusiform gyrus, right cingulate gyrus and left superior FC during recognition of photographs of various objects and animals that had been previously presented during encoding. Heun et al. [20] also reported increased activation in the prefrontal cortex in AMCI during successful recognition of words previously shown during encoding. Overall, studies of episodic recognition/retrieval suggest that individuals with AMCI display reduced activation in parts of the MTL during episodic recognition/retrieval.
Activation changes in the FC in AMCI are more difficult to interpret, since both increased and decreased activation have been reported. These discrepancies between the various studies might be due to differences in the stimuli employed (i.e. words, line drawings or photographs) or possibly the baseline conditions that were used. In the present study, we applied a contrast that was very similar to the ones used for encoding in which we contrasted successful recognition of items previously presented during encoding (i.e. hits) relative to unsuccessful recognition of items that were presented during encoding (i.e. misses). The studies discussed above used a variety of baseline stimuli for comparison relative to previously presented items including novel face/name pairs [28], novel line drawings [22] , a complex colored pattern [23] and words that were not correctly recognized as having been previously presented during encoding [20] . It is possible that these inconsistencies may have contributed to the discrepancies with respect to changes in FC activation in AMCI because different baseline conditions have previously been shown to result in different patterns of activation in the frontal and medial temporal cortices [63].
Incidental episodic encoding of information is often found to be a secondary processing effect in many situations [64] including fMRI experiments of recognition/retrieval in which there are no explicit instructions to encode information [32]. Incidental encoding can be assessed using fairly straightforward novel versus previously presented or hits versus misses contrasts [22, 56, 57]. We used a method similar to that described by Buckner et al. [32] in which we essentially treated the recognition phase of the experiment as an encoding task. To examine brain activation changes in individuals with AMCI during incidental encoding, we created 2 contrasts: a novel versus previously presented contrast (i.e. correct rejections vs. hits) and a hits versus misses contrast (i.e. correct rejections vs. false alarms), which presumably reflects incidental encoding of the novel items.
We found that the AMCI group displayed significantly less activation than the ONC group for both contrasts in the inferior parietal cortex, inferior and medial FC, and in the right hippocampus/parahippocampal cortex. The AMCI group showed significantly less activation, additionally, in the right posterior cingulate cortex and left hippocampus/parahippocampal cortex for the contrast of correct rejections versus hits only. The AMCI group did not display increased activation relative to the ONC group for either of these contrasts. One caveat to these latter results is that we did not administer a post-scan recognition test to verify that the novel items presented during recognition were successfully encoded for obvious reasons (e.g. length of experimental paradigm and participant fatigue). However, Buckner et al. [32] reported that young adults displayed good memory during a postscan recognition test for novel items that were presented during a scanned recognition test.
The results of the incidental encoding analysis are also consistent with previous studies which have examined encoding of novel information when no explicit instructions were given to encode the novel information. For example, Johnson et al. [22] used a similar novel versus previously presented contrast and found that individuals with AMCI displayed reduced activation in the left superior FC and hippocampus relative to an ONC group. More recently, Mandzia et al. [23] reported reduced activation in the left parahippocampal cortex, and bilaterally in the inferior FC and precuneus in AMCI during the encoding of photographs of objects and animals. Neither study mentioned any regions in which the AMCI group displayed increased activation during encoding.
The results presented here may help to clarify some of the inconsistent findings from previous fMRI studies in individuals with AMCI. We demonstrated that, in AMCI, increased activation in the medial temporal cortex is observed during intentional episodic encoding, whereas decreased medial temporal cortex activation is found during incidental encoding, recognition of previously encoded information and during successful discrimination of novel items presented during encoding.
Although differences in the type of episodic encoding examined may at least partly explain some of the discrepancies observed between the studies, it is important to note that studies evaluating functional brain changes during episodic memory function in individuals with AMCI also vary along several additional clinical and methodological dimensions. These parameters include (but are not limited to) the behavioral paradigm employed (e.g. encoding vs. recognition or retrieval), the statistical methodology used, different criterion for the diagnosis of AMCI or differing degrees of cognitive impairment on the continuum of deterioration from AMCI to AD [65].
In a series of studies, Dickerson et al. [17, 18], Sperling et al. [57] and Celone et al. [65] used a face-name associative encoding paradigm to examine changes in the magnitude and extent of activation in the medial temporal cortex in individuals with clinically diagnosed mild AD and individuals defined as having AMCI based on the clinical dementia ratings scale (although not all subjects in their AMCI group demonstrated objective memory impairment or met the clinical criterion for AMCI developed by Petersen and Morris [33] and Winblad et al. [34]).
These authors manually traced ROIs of the hippocampus and entorhinal cortex from each participant’s structural MRI and reported an increased extent of activation in these regions during encoding of novel face-name paired associates in individuals that were classified as AMCI based on the clinical dementia rating [17, 18]. Furthermore, these authors reported that a greater extent of activation in these medial temporal regions was predictive of later decline in cognitive status [66]. They suggested that the paradoxical increased medial temporal cortex activation found in their group of AMCI patients may have been due to differences in the level of cognitive impairment in their AMCI group versus those in previous studies, which were discussed above.
To directly test this hypothesis, Celone et al. [65] conducted an elegant study using independent component analysis to determine if a nonlinear trend of changes in the extent of brain activation (magnitude was not assessed) could be observed during the formation of face-name associations along the continuum of AD. Celone et al. [65] found that less impaired individuals with AMCI displayed an increased extent of activation in the hippocampus relative to controls. Conversely, more impaired individuals with AMCI and subjects with mild AD were found to show a reduced extent of activation in the hippocampus relative to controls. Furthermore, the extents of deactivation in the posterior cingulate, frontal and inferior parietal regions that are thought to be part of the default network of brain activity [see 67 for review] were found to be correlated with the extent of activation in the medial temporal cortex during encoding of face-name associations. The results of these studies suggest that different levels of functional impairment along the continuum of AD result in a different pattern of changes in brain activation during episodic memory function.
There are several limitations to the present study. It is likely that not all of the individuals with AMCI in our investigation were at the same level of functional impairment along the AD clinical continuum, and thus our findings may have been diluted by more or less successful performance. Previous studies suggest that the degree of functional impairment in AMCI is an important variable that influences fMRI activation changes in this population during episodic memory function [65]. Our sample size is somewhat limited and may not be reflective of the general populations of ONC and AMCI individuals. Furthermore, the fMRI data analyses reported here were based on functional scans that were spatially normalized to a standard template to facilitate the examination of group differences in the magnitude of activation. However, recent reports suggest that brain atrophy, which is pervasive in AMCI and AD, may confound the measurement of fMRI activation in the standard space in this population [68, 69] . Alternate approaches based on manual tracings of ROIs in the native space of each participant [17, 18, 26, 68, 69] or acquisition of high-resolution structural scans that highlight the microstructure of regions such as the medial temporal cortex of each participant [27] may help to reduce this limitation. However, this would increase the difficulty in examining voxel-wise group differences in magnitude of activation because of interindividual variation in the neuroanatomical localization of certain structures.
Despite these limitations, we believe that our results add to the findings of previous fMRI studies of episodic memory function in AMCI. We suggest that, in addition to the level of functional impairment and type of functional imaging modality employed (i.e. arterial spin labeling or BOLD fMRI), another important variable to consider when examining functional activation changes during episodic memory function in AMCI is the stage of memory examined (i.e. intentional versus incidental encoding or recognition).
Acknowledgments
This study was supported by grants from the National Institute on Aging (P01 AG09466; T32 AG000257-10). We would like to thank Leyla deToledo-Morrell for her role as mentor to the first author. We also would like to thank the participants of the Rush Alzheimer’s Disease Center and the Memory and Aging Project for participating in this study.
References
- 1.Petersen RC. Mild cognitive impairment as a diagnostic entity. J Intern Med. 2004;256:183–194. doi: 10.1111/j.1365-2796.2004.01388.x. [DOI] [PubMed] [Google Scholar]
- 2.Hyman BT, Arriagada PV, van Hoesen GW, Damasio AR. Memory impairment in Alzheimer’s disease: an anatomical perspective. In: Parks RW, Zec RF, Wilson RS, editors. Neuropsychology of Alzheimer’s Disease and Other Dementias. New York: Oxford University Press; 1993. pp. 138–150. [Google Scholar]
- 3.Desgranges B, Baron JC, de la Sayette V, Petit-Taboue MC, Benali K, Landeau B, Lechevalier B, Eustache F. The neural substrates of memory systems impairment in Alzheimer’s disease: a PET study of resting brain glucose utilization. Brain. 1998;121:611–631. doi: 10.1093/brain/121.4.611. [DOI] [PubMed] [Google Scholar]
- 4.Buckner RL, Snyder AZ, Shannon BJ, LaRossa G, Sachs R, Fotenos AF, Sheline YI, Klunk WE, Mathis CA, Morris JC, Mintun MA. Molecular, structural, and functional characterization of Alzheimer’s disease: evidence for a relationship between default activity, amyloid, and memory. J Neurosci. 2005;25:7709–7717. doi: 10.1523/JNEUROSCI.2177-05.2005. [DOI] [PMC free article] [PubMed] [Google Scholar]
- 5.Ries ML, Jabbar BM, Schmitz TW, Trivedi MA, Gleason CE, Carlsson CM, Rowley HA, Asthana S, Johnson SC. Anosognosia in mild cognitive impairment: relationship to activation of cortical midline structures involved in self-appraisal. J Int Neuropsychol Soc. 2007;13:450–461. doi: 10.1017/S1355617707070488. [DOI] [PMC free article] [PubMed] [Google Scholar]
- 6.Chetelat G, Baron JC. Early diagnosis of Alzheimer’s disease: contribution of structural neuroimaging. Neuroimage. 2003;18:525–541. doi: 10.1016/s1053-8119(02)00026-5. [DOI] [PubMed] [Google Scholar]
- 7.Jack CR, Jr, Petersen RC, Xu Y, O’Brien PC, Smith GE, Ivnik RJ, Tangalos EG, Kokmen E. Rate of medial temporal lobe atrophy in typical aging and Alzheimer’s disease. Neurology. 1998;51:993–999. doi: 10.1212/wnl.51.4.993. [DOI] [PMC free article] [PubMed] [Google Scholar]
- 8.Stoub TR, Bulgakova M, Leurgans S, Bennett DA, Fleischman D, Turner DA, deToledo-Morrell L. MRI predictors of risk of incident Alzheimer disease: a longitudinal study. Neurology. 2005;64:1520–1524. doi: 10.1212/01.WNL.0000160089.43264.1A. [DOI] [PubMed] [Google Scholar]
- 9.Engler H, Forsberg A, Almkvist O, Blomquist G, Larsson E, Savitcheva I, Wall A, Ringheim A, Langstrom B, Nordberg A. Two-year follow-up of amyloid deposition in patients with Alzheimer’s disease. Brain. 2006;129:2856–2866. doi: 10.1093/brain/awl178. [DOI] [PubMed] [Google Scholar]
- 10.Forsberg A, Engler H, Almkvist O, Blomquist G, Hagman G, Wall A, Ringheim A, Langstrom B, Nordberg A. PET imaging of amyloid deposition in patients with mild cognitive impairment. Neurobiol Aging. doi: 10.1016/j.neurobiolaging.2007.03.029. in press. [DOI] [PubMed] [Google Scholar]
- 11.Klunk WE, Engler H, Nordberg A, Wang Y, Blomqvist G, Holt DP, Bergstrom M, Savitcheva I, Huang GF, Estrada S, Ausen B, Debnath ML, Barletta J, Price JC, Sandell J, Lopresti BJ, Wall A, Koivisto P, Antoni G, Mathis CA, Langstrom B. Imaging brain amyloid in Alzheimer’s disease with Pittsburgh Compound-B. Ann Neurol. 2004;55:306–319. doi: 10.1002/ana.20009. [DOI] [PubMed] [Google Scholar]
- 12.Small GW, Kepe V, Ercoli LM, Siddarth P, Bookheimer SY, Miller KJ, Lavretsky H, Burggren AC, Cole GM, Vinters HV, Thompson PM, Huang SC, Satyamurthy N, Phelps ME, Barrio JR. PET of brain amyloid and tau in mild cognitive impairment. N Engl J Med. 2006;355:2652–2663. doi: 10.1056/NEJMoa054625. [DOI] [PubMed] [Google Scholar]
- 13.Cabeza R, Nyberg L. Imaging cognition II: an empirical review of 275 PET and fMRI studies. J Cogn Neurosci. 2000;12:1–47. doi: 10.1162/08989290051137585. [DOI] [PubMed] [Google Scholar]
- 14.Wagner AD, Shannon BJ, Kahn I, Buckner RL. Parietal lobe contributions to episodic memory retrieval. Trends Cogn Sci. 2005;9:445–453. doi: 10.1016/j.tics.2005.07.001. [DOI] [PubMed] [Google Scholar]
- 15.Drzezga A, Grimmer T, Henriksen G, Stangier I, Perneczky R, Diehl-Schmid J, Mathis CA, Klunk WE, Price J, Dekosky S, Wester HJ, Schwaiger M, Kurz A. Imaging of amyloid plaques and cerebral glucose metabolism in semantic dementia and Alzheimer’s disease. Neuroimage. 2008;39:619–633. doi: 10.1016/j.neuroimage.2007.09.020. [DOI] [PubMed] [Google Scholar]
- 16.Nordberg A. Amyloid imaging in Alzheimer’s disease. Curr Opin Neurol. 2007;20:398–402. doi: 10.1097/WCO.0b013e3281a47744. [DOI] [PubMed] [Google Scholar]
- 17.Dickerson BC, Salat DH, Bates JF, Atiya M, Killiany RJ, Greve DN, Dale AM, Stern CE, Blacker D, Albert MS, Sperling RA. Medial temporal lobe function and structure in mild cognitive impairment. Ann Neurol. 2004;56:27–35. doi: 10.1002/ana.20163. [DOI] [PMC free article] [PubMed] [Google Scholar]
- 18.Dickerson BC, Salat DH, Greve DN, Chua EF, Rand-Giovannetti E, Rentz DM, Bertram L, Mullin K, Tanzi RE, Blacker D, Albert MS, Sperling RA. Increased hippocampal activation in mild cognitive impairment compared to normal aging and AD. Neurology. 2005;65:404–411. doi: 10.1212/01.wnl.0000171450.97464.49. [DOI] [PMC free article] [PubMed] [Google Scholar]
- 19.Hamalainen A, Pihlajamaki M, Tanila H, Hanninen T, Niskanen E, Tervo S, Karjalainen PA, Vanninen RL, Soininen H. Increased fMRI responses during encoding in mild cognitive impairment. Neurobiol Aging. 2007;28:1889–1903. doi: 10.1016/j.neurobiolaging.2006.08.008. [DOI] [PubMed] [Google Scholar]
- 20.Heun R, Freymann K, Erb M, Leube DT, Jessen F, Kircher TT, Grodd W. Mild cognitive impairment (MCI) and actual retrieval performance affect cerebral activation in the elderly. Neurobiol Aging. 2007;28:404–413. doi: 10.1016/j.neurobiolaging.2006.01.012. [DOI] [PubMed] [Google Scholar]
- 21.Kircher TT, Weis S, Freymann K, Erb M, Jessen F, Grodd W, Heun R, Leube DT. Hippocampal activation in patients with mild cognitive impairment is necessary for successful memory encoding. J Neurol Neurosurg Psychiatry. 2007;78:812–818. doi: 10.1136/jnnp.2006.104877. [DOI] [PMC free article] [PubMed] [Google Scholar]
- 22.Johnson SC, Schmitz TW, Moritz CH, Meyerand ME, Rowley HA, Alexander AL, Hansen KW, Gleason CE, Carlsson CM, Ries ML, Asthana S, Chen K, Reiman EM, Alexander GE. Activation of brain regions vulnerable to Alzheimer’s disease: the effect of mild cognitive impairment. Neurobiol Aging. 2006;27:1604–1612. doi: 10.1016/j.neurobiolaging.2005.09.017. [DOI] [PMC free article] [PubMed] [Google Scholar]
- 23.Mandzia JL, McAndrews MP, Grady CL, Graham SJ, Black SE. Neural correlates of incidental memory in mild cognitive impairment: an fMRI study. Neurobiol Aging. doi: 10.1016/j.neurobiolaging.2007.08.024. in press. [DOI] [PubMed] [Google Scholar]
- 24.Xu G, Antuono PG, Jones J, Xu Y, Wu G, Ward D, Li SJ. Perfusion fMRI detects deficits in regional CBF during memory-encoding tasks in MCI subjects. Neurology. 2007;69:1650–1656. doi: 10.1212/01.wnl.0000296941.06685.22. [DOI] [PubMed] [Google Scholar]
- 25.Johnson SC, Baxter LC, Susskind-Wilder L, Connor DJ, Sabbagh MN, Caselli RJ. Hippocampal adaptation to face repetition in healthy elderly and mild cognitive impairment. Neuropsychologia. 2004;42:980–989. doi: 10.1016/j.neuropsychologia.2003.11.015. [DOI] [PubMed] [Google Scholar]
- 26.Machulda MM, Ward HA, Borowski B, Gunter JL, Cha RH, O’Brien PC, Petersen RC, Boeve BF, Knopman D, Tang-Wai DF, Ivnik RJ, Smith GE, Tangalos EG, Jack CR., Jr Comparison of memory fMRI response among normal, MCI, and Alzheimer’s patients. Neurology. 2003;61:500–506. doi: 10.1212/01.wnl.0000079052.01016.78. [DOI] [PMC free article] [PubMed] [Google Scholar]
- 27.Small SA, Perera GM, DeLaPaz R, Mayeux R, Stern Y. Differential regional dysfunction of the hippocampal formation among elderly with memory decline and Alzheimer’s disease. Ann Neurol. 1999;45:466–472. doi: 10.1002/1531-8249(199904)45:4<466::aid-ana8>3.0.co;2-q. [DOI] [PubMed] [Google Scholar]
- 28.Petrella JR, Krishnan S, Slavin MJ, Tran TT, Murty L, Doraiswamy PM. Mild cognitive impairment: evaluation with 4-T functional MR imaging. Radiology. 2006;240:177–186. doi: 10.1148/radiol.2401050739. [DOI] [PubMed] [Google Scholar]
- 29.Dickerson BC, Sperling RA. Functional abnormalities of the medial temporal lobe memory system in mild cognitive impairment and Alzheimer’s disease: insights from functional MRI studies. Neuropsychologia. 2008;46:1624–1635. doi: 10.1016/j.neuropsychologia.2007.11.030. [DOI] [PMC free article] [PubMed] [Google Scholar]
- 30.Brewer JB, Zhao Z, Desmond JE, Glover GH, Gabrieli JD. Making memories: brain activity that predicts how well visual experience will be remembered. Science. 1998;281:1185–1187. doi: 10.1126/science.281.5380.1185. [DOI] [PubMed] [Google Scholar]
- 31.Dickerson BC, Miller SL, Greve DN, Dale AM, Albert MS, Schacter DL, Sperling RA. Prefrontal-hippocampal-fusiform activity during encoding predicts intraindividual differences in free recall ability: an event-related functional-anatomic MRI study. Hippocampus. 2007;17:1060–1070. doi: 10.1002/hipo.20338. [DOI] [PMC free article] [PubMed] [Google Scholar]
- 32.Buckner RL, Wheeler ME, Sheridan MA. Encoding processes during retrieval tasks. J Cogn Neurosci. 2001;13:406–415. doi: 10.1162/08989290151137430. [DOI] [PubMed] [Google Scholar]
- 33.Petersen RC, Morris JC. Mild cognitive impairment as a clinical entity and treatment target. Arch Neurol. 2005;62:1160–1163. doi: 10.1001/archneur.62.7.1160. discussion 1167. [DOI] [PubMed] [Google Scholar]
- 34.Winblad B, Palmer K, Kivipelto M, Jelic V, Fratiglioni L, Wahlund LO, Nordberg A, Backman L, Albert M, Almkvist O, Arai H, Basun H, Blennow K, de Leon M, DeCarli C, Erkinjuntti T, Giacobini E, Graff C, Hardy J, Jack C, Jorm A, Ritchie K, van Duijn C, Visser P, Petersen RC. Mild cognitive impairment – beyond controversies, towards a consensus: report of the international working group on mild cognitive impairment. J Intern Med. 2004;256:240–246. doi: 10.1111/j.1365-2796.2004.01380.x. [DOI] [PubMed] [Google Scholar]
- 35.Oldfield RC. The assessment and analysis of handedness: the Edinburgh inventory. Neuropsychologia. 1971;9:97–113. doi: 10.1016/0028-3932(71)90067-4. [DOI] [PubMed] [Google Scholar]
- 36.Bennett DA, Schneider JA, Buchman AS, Mendes de Leon C, Bienias JL, Wilson RS. The Rush Memory and Aging Project: study design and baseline characteristics of the study cohort. Neuroepidemiology. 2005;25:163–175. doi: 10.1159/000087446. [DOI] [PubMed] [Google Scholar]
- 37.Bennett DA, Wilson RS, Schneider JA, Evans DA, Beckett LA, Aggarwal NT, Barnes LL, Fox JH, Bach J. Natural history of mild cognitive impairment in older persons. Neurology. 2002;59:198–205. doi: 10.1212/wnl.59.2.198. [DOI] [PubMed] [Google Scholar]
- 38.Dickerson BC, Goncharova I, Sullivan MP, Forchetti C, Wilson RS, Bennett DA, Beckett LA, deToledo-Morrell L. MRI-derived entorhinal and hippocampal atrophy in incipient and very mild Alzheimer’s disease. Neurobiol Aging. 2001;22:747–754. doi: 10.1016/s0197-4580(01)00271-8. [DOI] [PubMed] [Google Scholar]
- 39.Morris JC, Heyman A, Mohs RC, Hughes JP, van Belle G, Fillenbaum G, Mellits ED, Clark C. The Consortium to Establish a Registry for Alzheimer’s disease (CERAD). I. Clinical and neuropsychological assessment of Alzheimer’s disease. Neurology. 1989;39:1159–1165. doi: 10.1212/wnl.39.9.1159. [DOI] [PubMed] [Google Scholar]
- 40.Albert M, Smith LA, Scherr PA, Taylor JO, Evans DA, Funkenstein HH. Use of brief cognitive tests to identify individuals in the community with clinically diagnosed Alzheimer’s disease. Int J Neurosci. 1991;57:167–178. doi: 10.3109/00207459109150691. [DOI] [PubMed] [Google Scholar]
- 41.Wechsler D. Wechsler Memory Scale-Revised. San Antonio: Psychological Corporation, Harcourt Brace Jovanovich; 1987. [Google Scholar]
- 42.Folstein MF, Folstein SE, McHugh PR. ‘Mini-Mental State’: a practical method for grading the cognitive state of patients for the clinician. J Psychiatr Res. 1975;12:189–198. doi: 10.1016/0022-3956(75)90026-6. [DOI] [PubMed] [Google Scholar]
- 43.Glover GH, Lai S. Self-navigated spiral fMRI: Interleaved versus single-shot. Magn Reson Med. 1998;39:361–368. doi: 10.1002/mrm.1910390305. [DOI] [PubMed] [Google Scholar]
- 44.Glover GH, Lee AT. Motion artifacts in fMRI: comparison of 2DFT with PR and spiral scan methods. Magn Reson Med. 1995;33:624–635. doi: 10.1002/mrm.1910330507. [DOI] [PubMed] [Google Scholar]
- 45.Snodgrass JG, Vanderwart M. A standardized set of 260 pictures: norms for name agreement, image agreement, familiarity, and visual complexity. J Exp Psychol Hum Learn. 1980;6:174–215. doi: 10.1037//0278-7393.6.2.174. [DOI] [PubMed] [Google Scholar]
- 46.Cohen JD, MacWhinney B, Flatt MR, Provost J. Psyscope: a new graphic interactive environment for designing psychology experiments. Behav Res Methods Instrum Comput. 1993;25:257–271. [Google Scholar]
- 47.Ofen N, Kao YC, Sokol-Hessner P, Kim H, Whitfield-Gabrieli S, Gabrieli JD. Development of the declarative memory system in the human brain. Nat Neurosci. 2007;10:1198–1205. doi: 10.1038/nn1950. [DOI] [PubMed] [Google Scholar]
- 48.Ashburner J, Friston KJ. Nonlinear spatial normalization using basis functions. Hum Brain Mapp. 1999;7:254–266. doi: 10.1002/(SICI)1097-0193(1999)7:4<254::AID-HBM4>3.0.CO;2-G. [DOI] [PMC free article] [PubMed] [Google Scholar]
- 49.Friston KJ, Tononi G, Reeke GN, Jr, Sporns O, Edelman GM. Value-dependent selection in the brain: simulation in a synthetic neural model. Neuroscience. 1994;59:229–243. doi: 10.1016/0306-4522(94)90592-4. [DOI] [PubMed] [Google Scholar]
- 50.Friston KJ, Frith CD, Turner R, Frackowiak RS. Characterizing evoked hemodynamics with fMRI. Neuroimage. 1995;2:157–165. doi: 10.1006/nimg.1995.1018. [DOI] [PubMed] [Google Scholar]
- 51.Heun R, Jessen F, Klose U, Erb M, Granath DO, Grodd W. Response-related fMRI analysis during encoding and retrieval revealed differences in cerebral activation by retrieval success. Psychiatry Res. 2000;99:137–150. doi: 10.1016/s0925-4927(00)00060-3. [DOI] [PubMed] [Google Scholar]
- 52.Heun R, Jessen F, Klose U, Erb M, Granath DO, Grodd W. Response-related fMRI of veridical and false recognition of words. Eur Psychiatry. 2004;19:42–52. doi: 10.1016/j.eurpsy.2003.09.005. [DOI] [PubMed] [Google Scholar]
- 53.Maldjian JA, Laurienti PJ, Kraft RA, Bur-dette JH. An automated method for neuroanatomic and cytoarchitectonic atlas-based interrogation of fMRI data sets. Neuroimage. 2003;19:1233–1239. doi: 10.1016/s1053-8119(03)00169-1. [DOI] [PubMed] [Google Scholar]
- 54.Greicius MD, Flores BH, Menon V, Glover GH, Solvason HB, Kenna H, Reiss AL, Schatzberg AF. Resting-state functional connectivity in major depression: abnormally increased contributions from subgenual cingulate cortex and thalamus. Biol Psychiatry. 2007;62:429–437. doi: 10.1016/j.biopsych.2006.09.020. [DOI] [PMC free article] [PubMed] [Google Scholar]
- 55.Petrella JR, Wang L, Krishnan S, Slavin MJ, Prince SE, Tran TT, Doraiswamy PM. Cortical deactivation in mild cognitive impairment: high-field-strength functional MR imaging. Radiology. 2007;245:224–235. doi: 10.1148/radiol.2451061847. [DOI] [PubMed] [Google Scholar]
- 56.Bondi MW, Houston WS, Eyler LT, Brown GG. fMRI evidence of compensatory mechanisms in older adults at genetic risk for Alzheimer disease. Neurology. 2005;64:501–508. doi: 10.1212/01.WNL.0000150885.00929.7E. [DOI] [PMC free article] [PubMed] [Google Scholar]
- 57.Sperling RA, Bates JF, Chua EF, Cocchiarella AJ, Rentz DM, Rosen BR, Schacter DL, Albert MS. fMRI studies of associative encoding in young and elderly controls and mild Alzheimer’s disease. J Neurol Neurosurg Psychiatry. 2003;74:44–50. doi: 10.1136/jnnp.74.1.44. [DOI] [PMC free article] [PubMed] [Google Scholar]
- 58.Chetelat G, Desgranges B, Landeau B, Mezenge F, Poline JB, de la Sayette V, Viader F, Eustache F, Baron JC. Direct voxel-based comparison between grey matter hypometabolism and atrophy in Alzheimer’s disease. Brain. 2008;131:60–71. doi: 10.1093/brain/awm288. [DOI] [PubMed] [Google Scholar]
- 59.DeToledo-Morrell L, Stoub TR, Bulgakova M, Wilson RS, Bennett DA, Leurgans S, Wuu J, Turner DA. MRI-derived entorhinal volume is a good predictor of conversion from MCI to AD. Neurobiol Aging. 2004;25:1197–1203. doi: 10.1016/j.neurobiolaging.2003.12.007. [DOI] [PubMed] [Google Scholar]
- 60.Kircher T, Weis S, Freymann K, Erb M, Jessen F, Grodd W, Heun R, Leube DT. Hippocampal activation in MCI patients is necessary for successful memory encoding. J Neurol Neurosurg Psychiatry. 2007;78:812–818. doi: 10.1136/jnnp.2006.104877. [DOI] [PMC free article] [PubMed] [Google Scholar]
- 61.Hamalainen A, Pihlajamaki M, Tanila H, Hanninen T, Niskanen E, Tervo S, Karjalainen PA, Vanninen RL, Soininen H. Increased fMRI responses during encoding in mild cognitive impairment. Neurobiol Aging. 2007;28:1889–1903. doi: 10.1016/j.neurobiolaging.2006.08.008. [DOI] [PubMed] [Google Scholar]
- 62.Wierenga CE, Bondi MW. Use of functional magnetic resonance imaging in the early identification of Alzheimer’s disease. Neuropsychol Rev. 2007;17:127–143. doi: 10.1007/s11065-007-9025-y. [DOI] [PMC free article] [PubMed] [Google Scholar]
- 63.Stark CE, Squire LR. When zero is not zero: the problem of ambiguous baseline conditions in fMRI. Proc Natl Acad Sci USA. 2001;98:12760–12766. doi: 10.1073/pnas.221462998. [DOI] [PMC free article] [PubMed] [Google Scholar]
- 64.Craik FIM, Tulving E. Depth of processing and the retention of words in episodic memory. J Exp Psychol Gen. 1975;104:168–294. [Google Scholar]
- 65.Celone KA, Calhoun VD, Dickerson BC, Atri A, Chua EF, Miller SL, DePeau K, Rentz DM, Selkoe DJ, Blacker D, Albert MS, Sperling RA. Alterations in memory networks in mild cognitive impairment and Alzheimer’s disease: an independent component analysis. J Neurosci. 2006;26:10222–10231. doi: 10.1523/JNEUROSCI.2250-06.2006. [DOI] [PMC free article] [PubMed] [Google Scholar]
- 66.Miller SL, Fenstermacher E, Bates J, Blacker D, Sperling RA, Dickerson BC. Hippocampal activation in adults with mild cognitive impairment predicts subsequent cognitive decline. J Neurol Neurosurg Psychiatry. 2008;79:630–635. doi: 10.1136/jnnp.2007.124149. [DOI] [PMC free article] [PubMed] [Google Scholar]
- 67.Raichle ME, Gusnard DA. Intrinsic brain activity sets the stage for expression of motivated behavior. J Comp Neurol. 2005;493:167–176. doi: 10.1002/cne.20752. [DOI] [PubMed] [Google Scholar]
- 68.Krishnan S, Slavin MJ, Tran TT, Doraiswamy PM, Petrella JR. Accuracy of spatial normalization of the hippocampus: implications for fMRI research in memory disorders. Neuroimage. 2006;31:560–571. doi: 10.1016/j.neuroimage.2005.12.061. [DOI] [PubMed] [Google Scholar]
- 69.Sandstrom CK, Krishnan S, Slavin MJ, Tran TT, Doraiswamy PM, Petrella JR. Hippocampal atrophy confounds template-based functional MR imaging measures of hippocampal activation in patients with mild cognitive impairment. AJNR Am J Neuroradiol. 2006;27:1622–1627. [PMC free article] [PubMed] [Google Scholar]