

SUMMARY
The value of a health state may depend on how long an individual has had to endure the health state (i.e. hedonic load). In this paper, we test the constant proportionality (CP) assumption and determine the sign of relationship between duration and health state value for 42 health states using the nationally representative data from the United Kingdom Measurement and Valuation of Health study. The results reject the CP assumption and suggest that the relationship is negative for optimal health (i.e. fair innings argument) and that the relationship is positive for poorer health states (i.e. adaptation). We find no evidence of the maximum endurable time hypothesis using these data. This evidence on the duration effect has important implications for outcomes research and the economic evaluation of interventions.
Keywords: outcomes research, health state valuation, quality-adjusted life years, EQ-5D
INTRODUCTION
The value of a health state, such as a state with severe pain, may be duration dependent. That is, its value may depend on how long an individual has had to endure the health state (i.e. hedonic load). Duration dependence violates the constant proportionality (CP) assumption underlying current quality adjustment techniques employed in cost—utility analyses. Researchers in health economics have found evidence that the value of a heath state is related to its duration, and the sign of this relationship depends on health state and length of duration (Bleichrodt et al., 2003; Dolan, 1996; Dolan and Stalmeier, 2003; Groot, 2000; Spencer, 2003; Bala et al., 1999; Franic et al., 2003).
In this paper, we test the CP assumption and determine the sign of relationship between duration and health state value for 42 EQ-5D health states using nationally representative data from the United Kingdom Measurement and Valuation of Health (MVH) study (Shaw et al., 2005; Robinson et al., 1997; Kind, 1996).
To test the CP assumption and sign of the duration effect, we compare visual analog scale (VAS) and time trade-off (TTO) responses. Under the CP assumption, the VAS-based values and TTO-based values are theoretically equivalent, and as such both techniques have been applied to compute quality-adjusted life years (QALYs). However, the available empirical evidence suggests that these two valuation techniques elicit significantly different values from respondents (Robinson et al., 1997). Instead of CP, we assume a simple linear relationship between duration, y, and health state value, Vh(y) = αh + βhy. We determine the sign of the duration effect, βh, for hypothesized EQ-5D health states and show that the differences between VAS-based and TTO-based values may be explained by this sign.
VAS and TTO responses
In psychology and clinical practice, rating scales, such as the VAS, have a long history (Priestman and Baum, 1976). The MVH studies performed in the United Kingdom used the EQ VAS, a 10 cm, vertical rating scale with endpoints from 0 (‘best imaginable health state’) to 100 (‘worst imaginable health state’) (Bleichrodt and Johannesson, 1997). Using the VAS responses for ‘immediate death’ and optimal health and by assuming equidistant points, VAS responses can be rescaled, such that unity equals 10 years in optimal health and zero represents immediate death (Dolan, 1996). Rescaling VAS-based values reduces the effect of response spread and facilitates the comparison between VAS- and TTO-based values.
The validity of the VAS has been challenged, because it is not a choice-based measure, like the TTO. Choice-based values rendered using hypothetical scenarios, such as the TTO, may be more accurate, because the scenarios characterize health decisions, and not just health states (Dolan, 2000). Differential framing between the VAS and TTO may lead to different values, especially for respondents who have ethical or religious concerns with choice-based measures (Drummond and Davies, 1991). In addition to being choice based, the TTO is anchored at optimal health and ‘immediate death’, which may decrease the respondent’s cognitive burden.
Each valuation technique has its benefits relative to the other. Compared with the TTO, the VAS valuation technique is equally reliable, less expensive, easier to administer, less burdensome on respondents, and associated with a fewer number of refusals, missing values, and inconsistent responses (Green et al., 2000). The TTO technique is choice based and its anchors are clearly described. While both valuation techniques allow for the states worse than ‘immediate death’, the TTO questions depend on whether the state is better than ‘immediate death’ or worse than ‘immediate death,’ and the VAS question is the same regardless of the health state’s rank with respect to ‘immediate death’.
Data from both valuation techniques are typically evaluated on the same dimension, the ability to predict behavior. Predictive validity of TTO relative to that of VAS is difficult to assess, because both measures exclude uncertainty and interactive effects with wealth (i.e. willingness-to-pay), which are commonplace in medical decisions (Stiggelbout et al., 1995; Bala et al., 1998). While other studies have examined the relationship between TTO and VAS values under the CP assumption (Robinson et al., 1997; Badia et al., 1999), we re-interpret their correspondence under a linear dependence (LD) assumption and examine the relationship between duration and health state value from the societal perspective using nationally representative data from the United Kingdom (Shaw et al., 2005; Robinson et al., 1997; Kind, 1996).
THEORY
The TTO and VAS techniques may be characterized by a two-period schedule, (y, h). In the first period, a hypothetical person is in the optimal health state for the duration for y years. After the first period, the hypothetical person is in an alternative health state, h, for the remaining duration, (10−y) years. The alternative state, h, may be any health state other than the optimal state and y is bounded by 0 and 10.
The value of a two-period schedule, U(y, h), may be represented by the function
| (1) |
where V0(y) is the point-in-time value of the optimal state given duration y and Vh(10 − y) is the point-in-time value of the alternative state, h, given duration, (10−y). The value of a schedule, U(y, h), is the weighted sum of the state-specific values, V0 and Vh, according to the number of years spent in each state.
Under the CP assumption, duration, y, does not affect the point-in-time values of health states, such as V0 and Vh. We represent this assumption by assigning V0 = α0 and Vh = αh where α0 and αh are constants representing the duration-independent values of the health states.
Under the LD assumption, the point-in-time values, V0 and Vh, are simple linear functions of y, V(y) = α + βy, where α is the duration-independent value and β is the coefficient representing the relationship between V and y. To retain the anchors of the value scale, we assume V0(10) = α0 + 10β0 = 1 and Vdeath(y) = 0 for all y.
By substituting the two assumptions into Equation (1), we find that
| (2) |
LD and CP assumptions will render equivalent values for health state schedules where βh = −β0y2/(10 − y)2. This suggests that if βh and β0 have opposite sign, there exists a unique value of y where the CP assumption is equivalent to the LD assumption. Even a broken grandfather clock will be correct twice a day.
Current literature includes ambiguous evidence on the sign of the coefficients, βh and β0. The fair innings argument suggests that the coefficient on β0 is negative (Robinson et al., 1997; Harris, 1985). As the duration in optimal health increases, the value of the optimal health state health decreases, particularly after one has had their ‘fair innings’. Groot (2000) suggests that individuals learn to adapt to a health state, and that adaptation with time makes a health state more bearable leading to an increase in the health state’s value (i.e. βh>0). Coping theory suggests that duration makes the health more or less bearable (i.e. βh≠0) (Heyink, 1993). Dolan and Stalmeier (2003) put forth the concept of maximum endurable time (MET), after which a person would prefer ‘immediate death’ over continuing in a health state (i.e. Vh(y)<0 if y>MET), which suggests a negative sign on βh. The validity of each hypothesis may depend on which alternative health state, h, is examined. By examining responses elicited for 42 health states using the VAS and TTO techniques, we provide some evidence on the sign of the coefficient and their differences by health state.
Tabula rasa bias
In the MVH studies, respondents are asked to imagine themselves in particular schedule of health-related events over future period, as represented by (y, h). Under the CP assumption, the value of future experiences is independent of past health state experiences (i.e. tabula rasa). Under duration dependence, an additional period of time in a current health state may be lower or higher in value, depending on the sign of the relationship, βh. For example, a person who recently experienced a dreadful health state for 10 years may prefer ‘immediate death’ over hypothetically experiencing the state for an additional 10 years. In this paper, we assume LD, but that their responses are independent of past health experiences.
Tabula rasa bias is similar to scale of reference, loss aversion, and sequencing biases (Bleichrodt et al., 2003; Groot, 2000; Gafni, 1995). The unit of the value scale is defined by the distance between the values of an episode in optimal health and immediate death, and optimal health state may be perceived differently depending on one’s reference (Groot, 2000). Variation in reference may lead to scale heterogeneity, and bias the valuation of health states. Loss aversion bias, a form of tabula rasa bias, refers to large near-term changes in health, such as switching from the optimal health state to states with values close to or worse than the value of being dead (Bleichrodt et al., 2003). Persons in good health may react fearfully when they are asked to hypothetically value near-term death-like states. Sequencing bias, another form of tabula rasa bias, relates to the order of events and its influence on health state values (Gafni, 1995). While episode durations may be the same across schedules, persons may prefer one schedule of episodes over another for reasons other than discounting. In this analysis, we focus on relaxing the CP assumption through the incorporation of a linear relationship between duration and health state value, and do not address the tabula rasa or scale of reference bias.
Health state valuation and the LD assumption
In the MVH studies in the United Kingdom, respondents assigned values of 15 hypothetical health schedules using the EQ VAS, a 101-point rating scale from 0 (best imaginable health state) to 100 (worst imaginable health state) (Shaw et al., 2005; Robinson et al., 1997; Kind, 1996). These schedules include 10 years in the health state, h, followed by ‘immediate death’. Using VAS responses for the alternative health state, ‘immediate death’, and the optimal state (, , and ), we can estimate Vh(10) using the function
where
For the 13 health states, excluding optimal health and ‘immediate death’, the MVH choice-based valuation process begins by asking the respondent whether the value of 10 years in the alternative health state, U(0, h), is preferred over ‘immediate death’, V(0, Dead) (Erens, 1994). If the state is considered better than ‘immediate death’, the valuation process determines the number of years, y1, such that 10 years in the health state, h, equals y1 years in the optimal health state:
| (3) |
where VASh is αh + 10βh and TTOh is y1. Given the difference (VASh − TTOh) and y1, we can compute β0. Under CP assumption, β0 equals zero; therefore, the difference is zero. Under the LD assumption, the difference depends on the sign and magnitude of β0. A positive difference signifies a negative β0, which would be evidence in favor of the fair innings hypothesis.
For states worse than ‘immediate death’, the unadjusted TTO response, y2, represents the number of years, such that ‘immediate death’ equals y2 years in the optimal state and (10−y2) years in the alternative state, h:
| (4) |
where VASh is αh + 10βh and TTOh is −y2/10 − y2. Given the difference (VASh−TTOh) and y2, we can compute (β0+βh). Under CP assumption, β0 and βh equal zero; therefore, the difference is zero. Under the LD assumption, the difference depends on the sign and magnitude of β0 and βh. In the unlikely case that β0 and βh are equivalent in magnitude, but opposite in sign (i.e. β0 = −βh), the difference will still be zero.
Estimation of LD
VAS responses (VASh, VASdeath, and VAS0) and TTO responses (y1 and y2) are sufficient to compute a respondent’s parameters, α0, αh, β0, and βh. However, the process of collecting TTO responses prohibits the computation of these parameters. If y1 is collected from a respondent, y2 is not. If the health state, h, is better than ‘immediate death’, we can compute α0, β0, and αh+10βh. If the health state, h, is worse than ‘immediate death’, we can compute α0+10β0, αh+10βh,and β0+βh. In this section, we show that this censoring complicates, but does not prohibit, the identification of sign(β0) and sign(βh).
Under the CP assumption, the expected difference between VASh and TTOh is zero. However, under LD, the expected difference may be expressed as
| (5) |
where w1 = (10 − y1)y1P(y1>0) and w2 = y2P(y2 ≥ 0). Both weights, w, are positive by construction. If β0 and βh are zero, the expected difference is zero (i.e. CP).
If a health state is excellent, but non-optimal, P(y2>0) would be zero. In this case, the sign of the expected difference would be the opposite the sign of the β0. If the difference has a significant positive sign, this is evidence for the fair innings hypothesis (Stalmeier et al., 2005). In the case of a state worse than ‘immediate death’, P(y1>0) = 0, the sign of the expected difference would agree with the sign of (β0+βh). Suppose that β0 is negative (i.e. fair innings hypothesis) and the sign of the difference is positive. For these worse than death health states, βh must be positive, which supports the adaptation hypothesis. If β0 is negative (i.e. fair innings hypothesis) and the sign of the difference is negative, this evidence would suggest either that the adaptation effect was insufficient to overcome the fair innings effect (i.e. βh is positive, but smaller than β0) or that the value of the health state was decreasing with time (i.e. βh is negative), such as in the case of the MET hypothesis.
METHODS AND RESULTS
Using data from the United Kingdom, we examine the bivariate distribution of the transformed VAS and TTO values (VASh and TTOh). The protocol of the MVH group of the Centre for Health Economics in York has already been described in detail elsewhere (Shaw et al., 2005; Robinson et al., 1997; Kind, 1996). In this interview survey, respondents evaluated a subsample of 42 EQ-5D health states from the EQ-5D descriptive system (see Table I). The system consists of five dimensions: mobility, self-care, usual activities, pain/discomfort, and anxiety/depression. Each dimension has three levels, reflecting ‘no problems’, ‘some problems’, and ‘extreme problems.’ A standard means of naming the unique health states involves assigning the numbers 1, 2, 3 to each level in the five dimensions. Hence, the EQ-5D health state 21223 represents the following measurements: some problems in walking about, no problems with self-care, some problems with performing usual activities, moderate pain or discomfort, and extremely anxious or depressed. Results from MVH studies in the United States, the Netherlands, Japan, Spain, Denmark, Argentina, and Solvenia data were similar to those from the United Kingdom data and are available upon request (Craig et al., 2007).
Table I.
Unweighted difference between time trade-off and visual analog scale values in the United Kingdoma
| EQ-5D states | Number of observations | VAS-TTO | Two-sided t-test p-value | Probability of a worse than death TTO response (%) |
|---|---|---|---|---|
| 11211 | 1110 | −0.03 | 0.45 | 0.40 |
| 11121 | 1103 | 0 | 0.84 | 0.90 |
| 21111 | 1084 | 0 | 0.92 | 0.60 |
| 12121 | 710 | 0.02 | 0.84 | 2.00 |
| 11112 | 1097 | 0.03 | 0.51 | 1.30 |
| 12111 | 1090 | 0.05 | 0.34 | 1.40 |
| 12211 | 701 | 0.13 | 0.19 | 2.00 |
| 11122 | 671 | 0.17 | 0.08 | 3.40 |
| 22112 | 696 | 0.24 | 0.05 | 4.20 |
| 12222 | 692 | 0.29 | 0 | 9.00 |
| 21312 | 659 | 0.29 | 0.02 | 10.50 |
| 21222 | 675 | 0.39 | 0 | 9.20 |
| 22121 | 697 | 0.39 | 0 | 6.20 |
| 11312 | 672 | 0.44 | 0 | 9.80 |
| 22222 | 698 | 0.49 | 0 | 11.60 |
| 22122 | 680 | 0.5 | 0 | 9.60 |
| 11113 | 684 | 0.8 | 0 | 18.60 |
| 13212 | 683 | 0.84 | 0 | 18.60 |
| 13311 | 676 | 1.12 | 0 | 21.90 |
| 12223 | 682 | 1.33 | 0 | 31.50 |
| 21323 | 680 | 1.53 | 0 | 32.10 |
| 11131 | 669 | 1.58 | 0 | 32.00 |
| 32211 | 671 | 1.86 | 0 | 33.20 |
| 22323 | 668 | 2.17 | 0 | 43.00 |
| 23321 | 691 | 2.3 | 0 | 35.20 |
| 22331 | 679 | 2.32 | 0 | 46.70 |
| 21232 | 703 | 2.33 | 0 | 40.50 |
| 33212 | 698 | 2.69 | 0 | 47.10 |
| 23232 | 665 | 2.93 | 0 | 50.40 |
| 11133 | 695 | 3.02 | 0 | 49.60 |
| 21133 | 693 | 3.15 | 0 | 50.90 |
| 33321 | 669 | 3.18 | 0 | 56.50 |
| 22233 | 704 | 3.41 | 0 | 55.30 |
| 13332 | 680 | 3.44 | 0 | 62.40 |
| 23313 | 685 | 3.5 | 0 | 49.10 |
| 32313 | 708 | 3.53 | 0 | 57.80 |
| 32223 | 687 | 3.66 | 0 | 60.40 |
| 32232 | 680 | 3.92 | 0 | 64.90 |
| 32331 | 677 | 4.86 | 0 | 66.80 |
| 33232 | 708 | 5.14 | 0 | 72.00 |
| 33323 | 692 | 5.86 | 0 | 78.00 |
| 33333 | 2742 | 9.08 | 0 | 87.60 |
EQ-5D states are arranged by percentage of TTO responses that rank the state worse than ‘immediate death’.
For each of the 42 health states, we estimate the mean transformed values, the mean difference in transformed values between the VAS and TTO techniques, and statistical significance of the difference using two-sided t-tests (Table I). The health states are sorted by percentage of respondents who ranked the health state as worse than ‘immediate death’ (Column 5), because the interpretation of a difference depends on the prevalence of worse than ‘immediate death’ ratings. In Figure 1, we plot the mean transformed values for each health state including a quadratic regression to illustrate the relationship between VAS and TTO.
Figure 1.
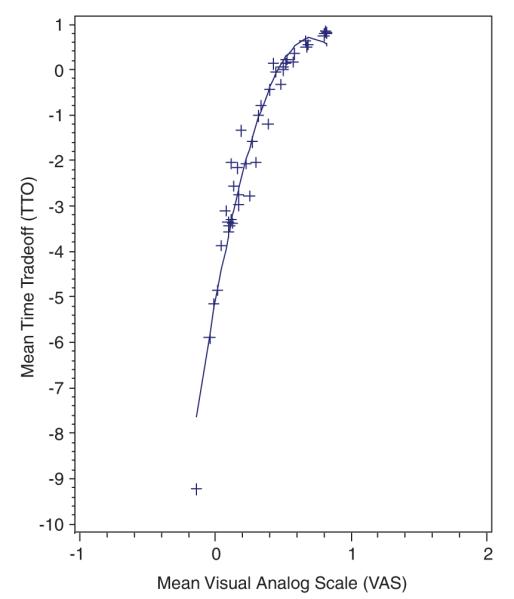
Unweighted mean time trade-off and visual analog scale values in the United Kingdom
The estimated differences were statistically significant at a 5% significance level among the poorer states, as indicated by greater than 5% of the population rating the state as worse than ‘immediate death’. This evidence rejects the CP assumption for the majority of EQ-5D states. Under the CP assumption, the mean values would form a line that passes through (0,0) at a 45° angle, which is clearly not the case (Figure 1).
The difference estimates vary across health states, and all are positive, except 11211, which is negative, but insignificant. Under the linear duration assumption, the positive values provide evidence in favor of the fair innings hypothesis (β0<0) and the adaptation hypothesis (βh>0) and against the MET hypothesis (βh<0) (Dolan and Stalmeier, 2003; Groot, 2000; Robinson et al., 1997; Harris, 1985; Heyink, 1993).
DISCUSSION AND CONCLUSION
In this study, we relax the CP assumption by adding LD. For each health state, the rescaled VAS and TTO responses will be equivalent under CP. Instead, the empirical evidence suggests a significant, positive difference, particularly for states with more than 5% worse than ‘immediate death’ responses.
Based on the LD model, the effect of duration on the value of optimal health is negative and the effect of duration on the value of alternative health is positive, which supports the fair innings and adaptation hypotheses. This is also evidence against the MET hypothesis for the EQ-5D health states.
The LD assumption in the health state value model is useful, but unnecessary to show the adaptation hypothesis. By construction, the VAS responses represent a full 10-year period in the alternative state, whereas the TTO responses represent fewer years in the alternative state. Fewer years allow less time to adapt, which would explain the lower values produced using TTO responses. These theoretical and empirical findings have important implications for outcomes research and the economic evaluation of interventions.
In cost—utility analysis, the outcome of interest is the societal value of a schedule of longevity adjusted for quality of life. QALYs are estimated as a sum of products measure, which aggregates the products of episode length and the point-in-time value for each health state experienced. The CP assumption implies that the point-in-time health state value is unrelated to episode length. Our analysis suggests that value of optimal health is negatively related to episode length (i.e. fair innings), and that the value of non-optimal health is positively related for poor health states (i.e. adaptation). In practice, technology assessments conducted under the CP assumption overvalue optimal health and under-value poor health in the long term. As such, these assessments also undervalue short-term gains in optimal health and over-value short-term gains in poor health. Under the standard use of QALYs, cost—utility analyses including long-term effects (e.g. statins) and short-term effects (e.g. chemotherapy) may misrepresent societal values.
The discount factor in economic evaluations facilitates the estimation of present value for future health outcomes. Duration dependence relates to the marginal utility of health in units of time, not time preference. Discounting discriminates between 2 months in optimal health today versus in a year from now, whereas duration dependence suggests that the values of an additional month in optimal health today depend on how long you have experienced optimal health. Our results suggest that the value of a non-optimal health state increases with time, which may seem like a negative discount rate. Salomon and Murray (2004) and Van Der Pol and Cairns (2000) examined TTO values for various health states and estimated a negative discount rate, but did not consider its interpretation as duration dependence.
To address duration dependence, researcher may estimate the LD coefficients for the health states βh and include them in their cost—utility analysis. We refer to this as a coping adjustment. Unlike adaptation, which implies that βh is positive, coping may lead to lower or higher values for health states as duration increases. Using local samples and experimental methods, researchers arrived at the conclusion that poor states become intolerable the longer they last (Dolan, 1996; Dolan and Stalmeier, 2003; Bala et al., 1999; Franic et al., 2003). Their subjects may have coped poorly with their health states. While we found the opposite result, it is difficult to compare this evidence due to difference in study design and sample characteristics; however, we recognize that coping with poor health is painful and costly. Economic analyses with coping adjustments may need to incorporate the economic and health burden of adjusting to a health state into their analysis. It is also possible that the burden of coping may be greater than the relief that it provides or that the relief and burden may cancel each other out in economic evaluations. Coping adjustments are particularly warranted for long-term outcomes (e.g. chronic pain).
Stalmeier et al. (2005) examined the United Kingdom data, estimated similar results, and came to the opposite conclusion. While their article also rejects the CP assumption, they interpret the positive difference between TTO and VAS to be an inadequacy of the VAS to measure the intolerability of health states near death, which they call a gap effect, a psychometric interpretation of the MET hypothesis. In this paper, we do not address the gap near death or the differential rates in worse than death responses across techniques. Instead, we directly relate the TTO and VAS responses to assess the CP assumption and interpret the positive difference under an LD relationship between duration and health state value.
The findings also re-emphasize the importance of developments in measurement and valuation techniques that account for duration dependence. Using discrete choice experiments, respondents may evaluate schedules of health states (Spencer, 2003). The TTO method may be adjusted to remove the censoring of responses, y1 and y2, and capture the relationships between duration and health state in valuation studies. The LD specification may be further relaxed to examine the quadratic or discrete relationship between duration and health state value, which may better address the fair innings and MET hypotheses for particular health states.
REFERENCES
- Badia X, Roset M, Herdman M. Inconsistent responses in three preference-elicitation methods for health states. Social Science & Medicine. 1999;49(7):943–950. doi: 10.1016/s0277-9536(99)00182-3. [DOI] [PubMed] [Google Scholar]
- Bala MV, Wood LL, Zarkin GA, Norton EC, Gafni A, O’Brien B. Valuing outcomes in health care: a comparison of willingness to pay and quality-adjusted life-years. Journal of Clinical Epidemiology. 1998;51(8):667–676. doi: 10.1016/s0895-4356(98)00036-5. [DOI] [PubMed] [Google Scholar]
- Bala MV, Wood LL, Zarkin GA, Norton EC, Gafni A, O’Brien BJ. Are health states ‘timeless’? The case of the standard gamble method. Journal of Clinical Epidemiology. 1999;52(11):1047–1053. doi: 10.1016/s0895-4356(99)00074-8. [DOI] [PubMed] [Google Scholar]
- Bleichrodt H, Johannesson M. Standard gamble, time trade-off and rating scale: experimental results on the ranking properties of QALYs. Journal of Health Economics. 1997;16(2):155–175. doi: 10.1016/s0167-6296(96)00509-7. [DOI] [PubMed] [Google Scholar]
- Bleichrodt H, Pinto JL, Abellan-Perpinan JM. A consistency test of the time trade-off. Journal of Health Economics. 2003;22(6):1037–1052. doi: 10.1016/s0167-6296(03)00046-8. [DOI] [PubMed] [Google Scholar]
- Craig BM, Busschbach JJV, Salomon JA. The relationship between ordinal and cardinal valuation of EQ-5D health states: evidence from a large international database. Journal of Clinical Epidemiology. 2008:1–16. Forthcoming. [Google Scholar]
- Dolan P. Modelling valuations for health states: the effect of duration. Health Policy. 1996;38(3):189–203. doi: 10.1016/0168-8510(96)00853-6. [DOI] [PubMed] [Google Scholar]
- Dolan P. The measurement of health-related quality of life. In: Culyer AJ, Newhouse JP, editors. Handbook of Health Economics. Elsevier Science B.V; Amsterdam, The Netherlands: 2000. pp. 1723–1760. [Google Scholar]
- Dolan P, Stalmeier P. The validity of time trade-off values in calculating QALYs: constant proportional time trade-off versus the proportional heuristic. Journal of Health Economics. 2003;22(3):445–458. doi: 10.1016/S0167-6296(02)00120-0. [DOI] [PubMed] [Google Scholar]
- Drummond MF, Davies L. Economic analysis alongside clinical trials: revisiting the methodological issues. International Journal of Technology Assessment in Health Care. 1991;7(4):561–573. doi: 10.1017/s0266462300007121. [DOI] [PubMed] [Google Scholar]
- Erens B. Health-related Quality of Life: General Population Survey. Social & Community Planning Research; London: 1994. [Google Scholar]
- Franic DM, Pathak DS, Gafni A. Are health states ‘timeless’? A case study of an acute condition: post-chemotherapy nausea and vomiting. Journal of Evaluation in Clinical Practice. 2003;9(1):69–82. doi: 10.1046/j.1365-2753.2003.00381.x. [DOI] [PubMed] [Google Scholar]
- Gafni A. Time in health — can we measure individuals pure time-preferences. Medical Decision Making. 1995;15(1):31–37. doi: 10.1177/0272989X9501500106. [DOI] [PubMed] [Google Scholar]
- Green C, Brazier J, Deverill M. Valuing health-related quality of life — a review of health state valuation techniques. Pharmacoeconomics. 2000;17(2):151–165. doi: 10.2165/00019053-200017020-00004. [DOI] [PubMed] [Google Scholar]
- Groot W. Adaptation and scale of reference bias in self-assessments of quality of life. Journal of Health Economics. 2000;19(3):403–420. doi: 10.1016/s0167-6296(99)00037-5. [DOI] [PubMed] [Google Scholar]
- Harris J. The Value of Life. Routledge & Kegan Paul; London, Boston: 1985. [Google Scholar]
- Heyink J. Adaptation and well-being. Psychological Reports. 1993;73:1331–1342. doi: 10.2466/pr0.1993.73.3f.1331. [DOI] [PubMed] [Google Scholar]
- Kind P. The EuroQol instrument: an index of health-related quality of life. In: Spilker B, editor. Quality of Life and Pharmacoeconomics in Clinical Trials. 2nd edn Lippincott-Raven; Philadelphia: 1996. pp. 191–201. [Google Scholar]
- Priestman TJ, Baum M. Evaluation of quality of life in patients receiving treatment for advanced breast-cancer. Lancet. 1976;1(7965):899–901. doi: 10.1016/s0140-6736(76)92112-7. [DOI] [PubMed] [Google Scholar]
- Robinson A, Dolan P, Williams A. Valuing health status using VAS and TTO: what lies behind the numbers? Social Science & Medicine. 1997;45(8):1289–1297. doi: 10.1016/s0277-9536(97)00057-9. [DOI] [PubMed] [Google Scholar]
- Salomon JA, Murray CJL. A multi-method approach to measuring health-state valuations. Health Economics. 2004;13(3):281–290. doi: 10.1002/hec.834. [DOI] [PubMed] [Google Scholar]
- Shaw JW, Johnson JA, Coons SJ. US valuation of the EQ-5D health states — development and testing of the D1 valuation model. Medical Care. 2005;43(3):203–220. doi: 10.1097/00005650-200503000-00003. [DOI] [PubMed] [Google Scholar]
- Spencer A. A test of the QALY model when health varies over time. Social Science & Medicine. 2003;57(9):1697–1706. doi: 10.1016/s0277-9536(02)00554-3. [DOI] [PubMed] [Google Scholar]
- Stalmeier PFM, Busschbach JJV, Lamers LM, Krabbe PFM. The gap effect: discontinuities of preferences around dead. Health Economics. 2005;14(7):679–685. doi: 10.1002/hec.986. [DOI] [PubMed] [Google Scholar]
- Stiggelbout AM, Kiebert GM, Kievit J, Leer JWH, Habbema JDF, Dehaes JCJM. The utility of the time trade-off method in cancer-patients — feasibility and proportional trade-off. Journal of Clinical Epidemiology. 1995;48(10):1207–1214. doi: 10.1016/0895-4356(95)00011-r. [DOI] [PubMed] [Google Scholar]
- Van Der Pol MM, Cairns JA. Negative and zero time preference for health. Health Economics. 2000;9(2):171–175. doi: 10.1002/(sici)1099-1050(200003)9:2<171::aid-hec492>3.0.co;2-z. [DOI] [PubMed] [Google Scholar]