

Abstract
M2 transmembrane domain channel (M2-TMD) permeation properties are studied using molecular dynamics simulations of M2-TMD (1NYJ) embedded in a lipid bilayer (DMPC) with 1 mol/kg NaCl or KCl saline solution. This study allows examination of spontaneous cation and anion entry into the selectivity filter. Three titration states of the M2-TMD tetramer are modeled for which the four His37 residues, forming the selectivity filter, are net uncharged, +2 charged, or +3 charged. M2-TMD structural properties from our simulations are compared with the properties of other models extracted from NMR and X-ray studies. During 10 ns simulations, chloride ions rarely occupy the positively-charged selectivity filter, whereas from umbrella sampling simulations, Cl− has a lower free-energy barrier in the selectivity-filter region than either Na+ or , and has a lower free-energy barrier than Na+. For Na+ and Cl−, the free-energy barriers are less than 5 kcal/mol, suggesting that the 1NYJ conformation would probably not be exquisitely proton selective. We also point out a rotameric configuration of Trp41 that could fully occlude the channel.
Keywords: Interhelical distances, Side chain rotamers, Potential of mean force, Influenza A virus, Membrane channel, Salt
Introduction
The influenza A virus is a genus of the orthomyxovirus family of viruses. It is coated by a cell membrane containing several copies of three integral membrane proteins: a receptor-cleavage protein known as neuraminidase, a fusion protein known as hemagglutinin, and a proton channel known as an M2 channel.1,2
After the endocytosis process of the virus in an epithelial cell of a host, the engulfed virus appears in an endosome. In the endosome, which has a pH range of 4.9–5.2,3 the M2 channel assumes an active form that allows protons to pass through it to acidify the matrix of the virus prior to the fusion of the virion membrane with the endosomal membrane.4–8 This acidification facilitates the uncoating process that allows a release of the viral genome.
Amantadine (1-Aminoadamantane hydrochloride) has an antiviral activity for the influenza A viruses at low concentrations (≤ 5 μM).5,7,9–16 It blocks the M2 channel and disallows it from passing protons to the virion interior.5,7,8,12,15–21 Previous experimental data indicate that the M2 channel is an essential part in virus replication and assembly.1,11,22–26
The M2 channel is comprised of four identical monomers, 4,22,27–30 and each monomer consists of 97 amino acids.2 Each monomer is divided into three domains: an extracellular N-terminal domain of 18 to 23 amino acid residues, an intracellular C-terminal domain of 54 amino acid residues, and an internal transmembrane domain (TMD) of 20 to 25 amino acid residues.1,2 The internal domains of the M2 channel form a left-handed bundle of four α-helices,31,32 which are stabilized by disulfide bonds between the N-terminal domains at Cys17, Cys19, or both.4,27 Thus, the homotetrameric structure could be a pair of disulfide-linked dimers4,33 or four variably-linked monomers27. The α-helices of the M2-TMD channel are tilted in such a way that the N-terminal end of the channel is wider than the C-terminal end.29 This tilted-helix bundle geometry enables the amantadine molecule to enter the channel and interact with the residues close to the N-terminal end and prevents it from passing through the C-terminal end of the channel.29 The M2-TMD α-helices have an amphiphilic nature that also contributes to their role as a target of the amantadine interaction.4,17
Under ideal conditions, the M2 channel only transports protons7,15,34,35 and this permeation increases as the external pH decreases5 below 8.5 until it reaches a saturation level at pH 4.7,15 The permeation of other ions through this channel has been suggested from experiments as well.5,6,8,14,35,36 It is not known whether experimental artifacts or variations in protein structure for different expression systems are responsible for these differences. Mutagenesis studies suggested that the Trp41 side chains function as a gate that opens and closes the M2-TMD pore for proton current at low and high pH, respectively,36 whereas the His37 side chains function as a selectivity filter for protons.6,37
This study explores the behavior of ionic species in the M2-TMD channel based on solid state NMR observables38 and initially thought to represent the closed state. Previous simulations29,33,39–46 with this NMR structure38, generally using neat water for the bath, have frequently demonstrated that, when the selectivity filter is multiply-titrated, it relaxes to a water-containing structure. It was observed that this structure can pass protons but still has a high barrier to Na+.21 However, the relaxed water-filled structure observed in these simulations raises questions about the occupancy of the charged selectivity filter. Namely, do Cl− occupy the charged selectivity filter and neutralize it? Is the free-energy barrier to Cl− passage lower than that of cation passage when there is a fixed charge in the selectivity filter? With slight relaxations, does the structure retain its tightness against Na+ transport? Are there significant structural differences between the 1NYJ model and other models extracted from NMR and X-ray experiments? We conducted molecular dynamics (MD) and umbrella sampling simulations with, for the first time to our knowledge, concentrated electrolyte solutions as the bath, to address those questions.
Methods
Model System and Parameters
The initial system consisted of an M2-TMD homotetramer, with the 1NYJ structure, 38 embedded in 96 1,2-Dimyristoyl-sn-glycero-3-phosphocholine (DMPC) molecules as a lipid bilayer, as well as 6400 water molecules (with the TIP3P model)47, and 1 mol/kg NaCl or NH4Cl saline solution. The 1NYJ structure represents the M2-TMD channel as a homotetramer with a left-handed bundle of four α-helices.38 The M2-TMD α-helix was obtained from solid-state NMR spectroscopy in a hydrated DMPC bilayer, which consists of 22–46 residues with the amino acid sequence: -Ser 22-Ser-Asp-Pro-Leu-Val-Val-Ala-Ala-Ser-Ile-Ile-Gly-Ile-Leu-His37-Leu-Ile-Leu-Trp41-Ile-Leu-Asp-Arg-Leu46-COO−.38 The initial crystal-like structure was constructed, using the VMD software,48 in a box with initial dimensions of 62 × 62 × 80 Å in x, y, and z dimensions, respectively. This system was denoted .
Another two M2-TMD systems were modeled using the same traditional empirical-force-field approach as the . In the first system, two opposite histidine residues were protonated, whereas in the second system three histidine residues were protonated using a covalent bond in the force field. The former system was denoted , whereas the later was denoted . This approach allowed us to examine the limiting electrostatic effects of His37 titration.
The ammonium ion ( ) force field was not available in the empirical force field. Its parameters were obtained using the Extensible Computational Chemistry Environment (ECCE)49 after performing quantum mechanics calculations using NWChem50,51. The ammonium ion was built in ECCE and geometrically optimized at the RHF level of theory with the 6-311++G(3df,3pd) basis set, with Pople(3df,3pd) as a polarization function, and with Pople-style as a diffusion function. The bond lengths for the ammonium ion were derived from the resulting structure. The atomic partial charges were derived using electrostatic potential fitting. Energy constants were taken from the CHARMM, version 22, force field for primary amines. The ammonium ion parameters are listed (Table I). The calculated partial charges for ammonium atoms are somewhat stronger than the OPLS charges, H: 0.35 and N: −0.40,52 but we expect this to have only minor impacts on total mean force potential. To produce electroneutrality for the M2-TMD systems, appropriate numbers (4, 2, or 1) of Cl− were removed from , or , respectively.
Table I.
Ammonium Ion Parameters
| Stretching | Elements | Energy constant (Kb)a (kcal/(mol·Å2)) | Bond length (Å) |
| N–H | 403.0 | 1.003 | |
| Bending | Elements | Energy constant (Kθ)a (kcal/(mol·rad2)) | Bond angle (°) |
| H–N–H | 44.0 | 109.471 | |
| Electrostatic | Elements | Partial charge | |
| N | −0.625490 | ||
| H | +0.406372 | ||
Extracted from version 31 of the CHARMM force field
System Preparation
The total simulation time for system preparation was 25 ns, with different periodic boundary conditions and harmonic restraints (Table II). This preparation allowed relaxation of the channel and disordering the lipid molecules, ions, and water molecules starting from the crystal-like structure.
Table II.
Summary of System Preparation Approach
| Process | Ensemblea | Restraints (kfb, kcal/(mol·Å2)) |
Steps | |||
|---|---|---|---|---|---|---|
| Lipidsc |
Channeld |
|||||
| P | bb | non bb | com | |||
| Minimization 1 | NVT | 200 | F | F | 10,000 | |
| Heating 1 | NV | 200 | F | F | 20,000 | |
| Equilibration 1 | NVT | 200 | F | F | 100,000 | |
| Annealinge | NV | 200 | F | F | 200,000 | |
| Minimization 2 | NVT | 200 | F | 3000 | ||
| Heating 2 | NV | 20 | F | 50,000 | ||
| Equilibration 2 | NPAT | 20 | F | 100,000 | ||
| Equilibration 3 | NPγT | 10 | F | 10,000,000 | ||
| Equilibration 4 | NPAT | 2 | 100 | 100,000 | ||
| Equilibration 5 | NPAT | 1 | 40 | 100,000 | ||
| Equilibration 6 | NPAT | 10 | 100,000 | |||
| Equilibration 7 | NPAT | 2 | 100,000 | |||
| Equilibration 8 | NPAT | 0.4 | 100,000 | |||
| Equilibration 9 | NPAT | 0.1 | 267,000 | |||
| Equilibration 10 | NPAT | 1000 | 1,250,000 | |||
The symbols in this column stand for; N: constant number of atoms, V: constant volume, T: constant temperature, P: constant pressure, A: constant area, γ: constant surface tension
kf: force constant
The symbol in this column stands for; P: phosphorus atoms
The symbols in this column stand for; bb: backbone, com: center-of-mass, F: fixed atoms
It consists of three stages with each stage: 40 ps of heating to 1000 K followed by 80 ps of cooling to 303.15 K
Both the lipid deuterium order parameters and the lipid surface area are sensitive to the changes in the bilayer structures due to many factors such as the lipid hydration level, number of lipid molecules, temperature, statistical ensemble, surface tension, and saline-solution concentration.53–60 Surface tension is the force applied per unit length to a filament required to stretch a liquid film.61,62 Mathematically, the surface tension per interface (γ) can be calculated from the pressure tensors, averaged over the central cell containing a lipid bilayer system normal to the z direction, as follows:56
| (1) |
where Lz is the length of the unit cell, Pzz is the component of the pressure tensor normal to the bi-layer surface, Pxx and Pyy are the tangential components of the pressure tensor, and the angle brackets denote an average over time. For simulating a pure lipid bilayer in pure water, the appropriate surface tension has been evaluated to be within the range of 30–45 dyn/(cm·interface).56,58,63,64 However, with a more complex lipid bilayer system, such as one that includes salt and polypeptide, the surface tension is unknown.
We carried out a test for the suitable surface tension using a gramicidin A (gA) channel system because of a well estimated surface area for the gA channel65, whereas it is unknown for the M2-TMD channel. Briefly, the test was done by fixing the gA channel in the original structure, 1JNO structure,66 to avoid channel-surface perturbation effect on the lipid bilayer properties,67 applying two planar harmonic restraints on the lipid phosphorus atoms (kf = 10 kcal/(mol·Å2)) at z = ± 17.5 Å to agree with the experimental head–head or phosphate–phosphate thickness of 35.3 Å, 68,69 and using 2.5 unit increments of the surface tension in the range of 0–75 dyn/(cm·interface). Based on accuracy and precision in the lipid molecular surface area consistent with the experimental DMPC molecular surface area,69 the optimal surface tension was found to be 40 dyn/(cm·interface).
The Equilibration 3 stage was then carried out with γ = 40 dyn/(cm·interface), a fixed channel in the 1NYJ structure, and two planar harmonic restraints on the lipid phosphorus atoms (kf = 10 kcal/(mol·Å2)) at z = ± 17.5 Å (Table II). This stage was run for 20 ns, enough time to obtain stable lateral dimensions for the system under study.70 The purpose of this stage is to prepare a realistic lipid environment for the polypeptide channel.
During the subsequent equilibrations, the restraints on the channel and the lipid phosphorus atoms were progressively reduced without significant changes in the system structure. The simulations in the NPAT ensemble (Equilibrations 4–10) utilized a tetragonal box having a lateral dimension of 59.849 Å, the average value from the second 10 ns of the Equilibration 3 stage. Both the Equilibration 10 stage and the routine 10 ns production run (done in parallel with the umbrella sampling simulations) were performed with the channel center-of-mass (COM) as the only restraint.
Molecular Dynamics Simulations
Simulations were performed with NAMD software,71 version 2.6, using version 31 of the CHARMM force field.72–77 Trajectory files were written every 1 ps for both the 10 ns test-ion-free production run and the umbrella sampling production runs using a time step of 2 fs and the NPAT ensemble. A smoothing function was applied to both the electrostatic and the van der Waals forces at a distance of 8 Å with a switching cutoff distance of 12 Å, a pair list distance of 14 Å, and all bonds with hydrogen being rigid using the ShakeH algorithm. The non-bonded interactions parameters (switching, spherical cutoff, and pair list distances) were carefully chosen to achieve realistic macromolecular simulations.78 The Particle Mesh Ewald (PME) algorithm, implemented to add a reciprocal space long-range electrostatic energy to the limited non-bonded component, was used with an interpolation function of order 5, and PME box grid size of 128, 128, 256 in x, y, and z direction, respectively. Langevin dynamics were used to maintain the temperature at 303.15 K with a damping coefficient of 5 ps−1, whereas the pressure in the z direction was maintained at 1 atm using the Nosé–Hoover Langevin piston method with an oscillation of 1 ps and a damping time of 0.1 ps.79,80
Analysis scripts were composed using VMD and Tcl81 commands. The deuterium order parameters of the deuterium-labeled segment were calculated from:53,55,57,59
| (2) |
where θi is the angle between the ith C–H vector and the z axis (bilayer normal), and the angle brackets denote an average over both acyl chains from all lipid molecules, all C–H vectors associated with the ith carbon, and time. These parameters have a range from −0.5 to 1.0 and reflect the lipid tails orientation (i.e., a −0.5 value represents fully ordered lipid tails, whereas a 1.0 value represents fully disordered lipid tails).
The root-mean-square displacement (RMSD) reflects the degree of similarity between three-dimensional protein structures. It was computed by measuring the RMSD between equivalent atoms after optimal superposition of the two structures (the protein structure in trajectory frame i and the initial trajectory frame).
The conformational stability of the side chains can be represented by their torsion angles (dihedral angles) such as χ1 and χ2 angles. For histidine side chains, the χ1 angle is the counterclockwise rotation of the Cβ –Cγ bond around the Cα –Cβ bond in N–Cα –Cβ –Cγ chain of atoms, whereas χ2 angle is the counterclockwise rotation of the Cγ –Nδ1 bond around the Cβ –Cγ bond in Cα –Cβ –Cγ–Nδ1 chain of atoms.82 For tryptophan side chains, the χ1 angle is the counterclockwise rotation of the Cβ –Cγ bond around the Cα –Cβ bond in N–Cα –Cβ –Cγ chain of atoms, whereas χ2 angle is the counterclockwise rotation of the Cγ –Cδ1bond around the Cβ –Cγ bond in Cα –Cβ–Cγ–Cδ1 chain of atoms.82 These definitions give a positive torsion angle, whereas a negative torsion angle requires rotation in the opposite direction. The rotameric state was given to each side chain based on observing their χ1 and χ2 fluctuations around their averages, most of the simulation time scale (8–10 ns). A rotameric state combination is represented with a notation (His37, Trp41).
The tilt angle was computed by calculating the angle between the helix principle axis and the bilayer normal, and then averaged over all helices and trajectories.
The interhelical distance was computed by calculating the distance between two neighboring helices using their COM, and then averaged over all trajectories.21,83,84 This distance was also calculated at another two different points, at the C-terminal end of the principle axis and at the N-terminal end of the principle axis taken at equal distances from the helix COM.
Another interesting distance was computed after averaging over all trajectories is the distance, which is the distance between Cγ in Trp41 from helixi and Nδ1 in His37 from helixi+1. 38 The notation Hi−(i+1) was used to denote distances between residues on helixi and helixi+1, where the latter is the clockwise adjacent helix as viewed from the C-terminus side.
Umbrella Sampling Simulations
All the umbrella sampling simulations were performed using the final frame of the Equilibration 10 stage of the system under study as an initial structure. In these simulations, the channel COM was restrained to within 0.1 Å of the origin ( ) and the test ion, selected from the bath ions, was restrained to a plane normal to the z axis (kf = 30 kcal/(mol·Å2)), with the position of the plane being varied along the transport coordinate (“reaction coordinate”). All kf symbols designated force constants (i.e., harmonic spring constants).
We don’t view the restraining force on the channel COM as a biasing force for the umbrella sampling, but rather as a structural restraint force designed to compensate for missing components in the system, that is, the rest of the experimental system (remainder of planar bilayer or plasmalemma, etc), and thus to establish a reference point for the coordinate system. Here we use the term “transport coordinate” because no bond-forming or -breaking takes place during ion transport. The transport coordinate is then defined to be independent of the ion channel position, and to be just the z coordinate of the ion relative to the Cartesian origin. For systems of this size, the transport coordinate is similar, if not identical, to a “relative position” transport coordinate, in which the distance between the ion and the channel or bilayer-channel center of mass is the restrained coordinate. Figure 1, taken from a study on the gramicidin channel in which the same restraint forces, equilibration parameters, window duration and spacing parameters, etc. were used, shows that usage of relative or absolute transport coordinates yields almost identical free-energy profiles. More detail on this comparison is provided in the report on that study.85
Figure 1.

Symmetrized one-dimensional K+ PMF profiles in the gA system as a function of the transport coordinate.85 The PMF profiles shown are from independent transport coordinate (black line) and relative transport coordinate (grey line) implementations.
During umbrella sampling with the test ion, a cylindrical restraint (kf = 20 kcal/(mol·Å2)) was applied on the test ion to keep it within 10 Å of the z axis. The purpose of the cylindrical restraint was to assure a one-dimensional free-energy profile.86–89
We used 201 windows with a window width of 0.2 Å to cover the transport coordinate −20 ≤ z ≤ 20 Å. For each window, the z coordinate of the test ion was set to the window position and the x and y initial values of the test ion were set to zero before performing minimization for 3000 steps, heating from 0 to 303.15 K, equilibration in the NPAT ensemble for 1 ns, and production in the NPAT ensemble for 1 ns. Because each window was initiated independently of the others, they could be run in parallel and there was no hysteresis associated with the direction of ion transport.90,91 We used the weighted histogram analysis method (WHAM) to unbias the umbrella potential on the test ion and extract the free-energy profile.92,93 The mathematical details for calculating or extracting the free-energy profile were the same as described previously.88,92,94,95
The potential of mean restraint (PMR) is used as a test for the WHAM results. The PMR can be extracted as follows:96
| (3) |
| (4) |
where zion is the test ion position in the z direction (sampled every 2 fs for the ensemble average), zw is the window-reference position, and F (zion) is the instantaneous restraint force applied in the z direction to the test ion. The Composite Simpson’s Rule was used as a numerical integration method.97
Results and Discussion
Preparation and Simulation Methods Stability
The preparation process generally produces stable and randomized systems compared with the initial crystal-like structures. For example, the simulating annealing, based on the deuterium order parameters [Figs. 2(a) and (b)], is sufficient to produce disordered lipid tails in the presence of either NaCl or NH4Cl saline solution. Our order parameter results agree with both the experimental98–100 and the simulation59 results, except in the region close to the head group, where the order remains high in experiments,98–100 but commonly declines in simulation.59 The consistency in the order parameters results among differently titrated M2-TMD structures as well as different saline composition is an indication of the robustness of the preparation method.
Figure 2.


Deuterium order parameters for the DMPC tails in (black — line), (black – – line), and (grey — line) systems with (a) NaCl and (b) NH4Cl saline solutions.
Our RMSD results show reasonable channel-backbone structural stability within the production run time scale for all M2-TMD structures in NaCl saline solution [Fig. 3(a)], whereas slight excesses occurred in the presence of NH4Cl saline solution [Fig. 3(b)] after 3 ns, especially for the structure. This indicates some structural variations, but these may be random in origin and are not necessarily caused by the presence of the NH4Cl saline solution or the charged histamines. The RMSD results appear to be incomplete in convergence after 10 ns, but stable enough for the 2 ns umbrella sampling runs started from the end of the last equilibration run (Equilibration 10). Our RMSD results are in good agreement with previous simulation observations.33,40,43–45
Figure 3.


RMSD versus time for the polypeptide backbone in (black line), (red line), and (grey line) systems with (a) NaCl and (b) NH4Cl saline solutions.
M2-TMD Channel Structural Analysis
Some of the M2-TMD channel structure properties in the presence of NaCl or NH4Cl saline solutions are listed (Tables III and IV) and compared with those from experimental models using our calculations. The tilt angle averages in the presence of two different saline solutions are in a good agreement with experimental observations,21,30,31,38,101 even though there are large fluctuations in the protonated structures. Slight variances of our results with some experimental102–104 and simulation33,39,41–43 results are expected because of different M2-TMD length, lipid bilayer environment, water model, hydration level, experimental source, equilibration level, or simulation length. However, the basic size and shape of the molecule is now established, and our results further attest to the stability of the 1NYJ structure in the lipid membrane environment.
Table III.
Some of M2-TMD Channel Structure Properties in NaCl Saline Solution
| PDB Structure | 1NYJ |
1NYJ | 2H95 | 2RLFa | 3C9J | ||||||
|---|---|---|---|---|---|---|---|---|---|---|---|
| M2 | M2 | M2 | |||||||||
| Source | MD Simulations | NMR | NMR | NMR | X-ray | ||||||
| Residues | 22–46 | 22–46 | 26–43 | 18–60 | 22–46 | ||||||
| Lipid Bilayer | DMPC | DMPC | DMPC | DHPCb | |||||||
| Reference | This work | (38) | (102) | (103) | (101) | ||||||
| Tilt Angle (°) | 36.9 ± 3.9 | 39.6 ± 5.6 | 38.0 ± 2.8 | 37 | 23 | 16 | 32 | ||||
| Interhelical | Cc | 17.6 ± 0.9 | 19.5 ± 2.2 | 17.8 ± 1.1 | 17 | 12 | 12 | 24 | |||
| Md | 11.4 ± 0.8 | 11.7 ± 1.3 | 11.6 ± 0.8 | 10 | 13 | 10 | 12 | ||||
| Distance (Å) | Ne | 18.9 ± 2.1 | 18.9 ± 1.1 | 19.5 ± 1.3 | 17 | 16 | 13 | 11 | |||
|
|
HA–B | 5.5 ± 0.4 | 8.1 ± 0.8 | 4.8 ± 0.5 | 3.8 | 10.9 | 9.3 | 16.0 | |||
| HB–C | 5.6 ± 0.7 | 5.4 ± 1.0 | 7.4 ± 0.8 | 3.7 | 10.9 | 9.0 | 13.7 | ||||
| Distance (Å) | HC–D | 6.8 ± 1.0 | 5.3 ± 0.4 | 5.6 ± 0.5 | 3.7 | 10.9 | 8.6 | 15.0 | |||
| HD–A | 5.8 ± 0.9 | 4.6 ± 0.4 | 6.1 ± 0.6 | 3.8 | 10.9 | 8.6 | 14.0 | ||||
| His37 | HA | t–80° | t–80° f | t–80° f | t–160° | t–160° | t–80° | t60° | |||
| HB | t60° | m-170° g | t–80° f | t–160° | t–160° | t–80° | t60° | ||||
| Rotamerh | HC | t60° | t60° f | t–80° f | t–160° | t–160° | t–160° | t–160° | |||
| HD | t–80° | t–80° | t60° | t–160° | t–160° | t–80° | t60° | ||||
| Trp41 | HA | t–105° | t–105° | t90° | t–105° | m95° | t–105° | t90° | |||
| HB | t90° | m0° | t–105° | t–105° | m95° | t–105° | t90° | ||||
| Rotamerh | HC | t90° | t90° | t–105° | t–105° | m95° | t–105° | t90° | |||
| HD | t–105° | t90° | t–105° | t–105° | m95° | t–105° | t90° | ||||
The analysis for this structure was performed on the residues 22–46
DHPC stands for 1,2-Dihexanoyl-sn-glycero-3-phosphocholine
C Stands for the distance between two neighboring helices using the C-terminal end of the principle axis
M Stands for the distance between two neighboring helices using the COM of each helix
N Stands for the distance between two neighboring helices using the N-terminal end of the principle axis
This is for a protonated histidine residue
This is not a common rotamer in the Lovell et al. library.82
Hi stands for helix i
Table IV.
Some of M2-TMD Channel Structure Properties in NH4Cl Saline Solution
| PDB Structure | 1NYJ |
1NYJ | 2H95 | 2RLFa | 3C9J | ||||||
|---|---|---|---|---|---|---|---|---|---|---|---|
| M2 | M2 | M2 | |||||||||
| Source | MD Simulations | NMR | NMR | NMR | X-ray | ||||||
| Residues | 22–46 | 22–46 | 26–43 | 18–60 | 22–46 | ||||||
| Lipid Bilayer | DMPC | DMPC | DMPC | DHPCb | |||||||
| Reference | This work | (38) | (102) | (103) | (101) | ||||||
| Tilt Angle (°) | 37.2 ± 3.8 | 36.1 ± 3.5 | 37.9 ± 6.4 | 37 | 23 | 16 | 32 | ||||
| Interhelical | Cc | 17.1 ± 1.3 | 18.0 ± 2.4 | 17.7 ± 1.2 | 17 | 12 | 12 | 24 | |||
| Md | 11.2 ± 0.8 | 11.5 ± 1.8 | 11.8 ± 0.6 | 10 | 13 | 10 | 12 | ||||
| Distance (Å) | Ne | 18.9 ± 2.4 | 18.5 ± 3.1 | 20.0 ± 1.5 | 17 | 16 | 13 | 11 | |||
|
|
HA-B | 4.5 ± 0.4 | 5.5 ± 0.9 | 5.0 ± 0.7 | 3.8 | 10.9 | 9.3 | 16.0 | |||
| HB-C | 5.4 ± 0.3 | 6.6 ± 1.3 | 4.9 ± 1.0 | 3.7 | 10.9 | 9.0 | 13.7 | ||||
| Distance (Å) | HC-D | 5.7 ± 0.3 | 5.4 ± 0.9 | 5.8 ± 0.7 | 3.7 | 10.9 | 8.6 | 15.0 | |||
| HD-A | 5.6 ± 0.5 | 7.2 ± 1.2 | 7.3 ± 0.9 | 3.8 | 10.9 | 8.6 | 14.0 | ||||
| His37 | HA | t–80° | t–160° f | t–160° f | t–160° | t–160° | t–80° | t60° | |||
| HB | t60° | t–80° | t–160° f | t–160° | t–160° | t–80° | t60° | ||||
| Rotamerg | HC | t60° | t–160° f | t–160° f | t–160° | t–160° | t–160° | t–160° | |||
| HD | t–80° | t–80° | t60° | t–160° | t–160° | t–80° | t60° | ||||
| Trp41 | HA | t–105° | t–105° | t90° | t–105° | m95° | t–105° | t90° | |||
| HB | t90° | t–105° | t–105° | t–105° | m95° | t–105° | t90° | ||||
| Rotamerg | HC | t–105° | t–105° | t–105° | t–105° | m95° | t–105° | t90° | |||
| HD | t90° | t90° | t–105° | t–105° | m95° | t–105° | t90° | ||||
The analysis for this structure was performed on the residues 22–46
DHPC stands for 1,2-Dihexanoyl-sn-glycero-3-phosphocholine
C Stands for the distance between two neighboring helices using the C-terminal end of the principle axis
M Stands for the distance between two neighboring helices using the COM of each helix
N Stands for the distance between two neighboring helices using the N-terminal end of the principle axis
This is for a protonated histidine residue
Hi stands for helix i
The interhelical distances at the C- and N-termini have rather modest fluctuations around their averages and are higher than those from the experimental models. We speculate that these values might be moderated and stabilized for the whole polypeptide in simulations as they are in experiments.104 On the other hand, the average distances between the COM of two neighboring helices are consistent with results from experimental studies.21,101,102 Previous studies suggested that an interhelical distance within the range of 9.5–10.2 Å is an indication of a channel in the closed form, where water molecules penetration is not possible.38,39,43,103 The slight increase in this distance, as we change the to the structure, may be caused by the electrostatic repulsion effect in the selectivity filter, which was also observed in other MD simulations.39,41,43,45,46
A REDOR solid-state NMR spectroscopy study suggested that the distance between the Cγ in Trp41 from helixi and Nδ1 in His37 from helixi+1 is < 3.9 Å and represents the channel in the closed form.38 Our results for this distance are higher than 3.9 Å (Tables III and IV) and less than some other values measured experimentally,101–103 but consistent with a previous simulation observation.46 Because the thermally relaxed version of the solid state NMR M2-TMD structure is somewhat more open in the region of His37 cluster, there may be other components, such as the Trp41 residues, shuttering the channel (see below).
The Rotameric Basis of Trp41 Gating
Various rotameric states for His37 and Trp41 side chains are observed in our simulations with NaCl or NH4Cl saline solution (Tables III and IV). The most commonly observed rotameric states are the t–105° [Fig. 4(a)], which blocks the channel from passing water molecules or ions [Fig. 4(b)], and the t90° [Fig. 4(c)], which allows the channel to pass water molecules and ions with the size of water molecule or smaller [Fig. 4(d)]. This apparent gating function of Trp41 side chains in our simulations is in a good agreement with the mutagenesis study.36 To our knowledge, the Trp41 side chain rotamer, t–105°, has never previously been proposed to be the rotamer that blocks the M2-TMD channel.
Figure 4.

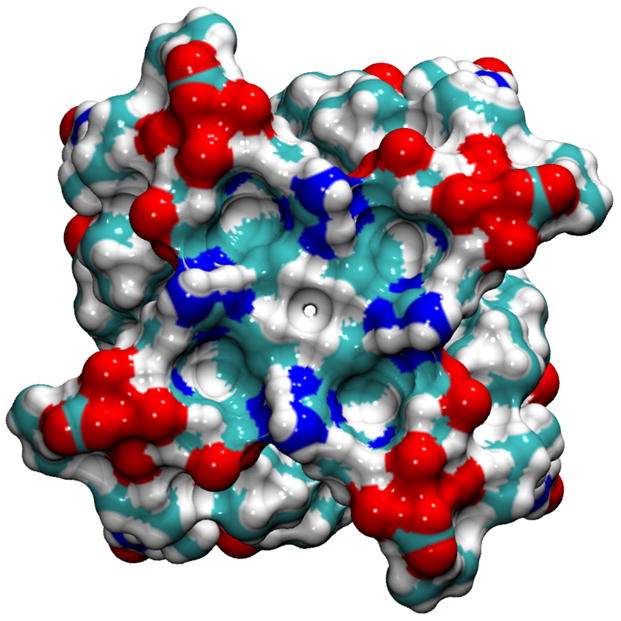
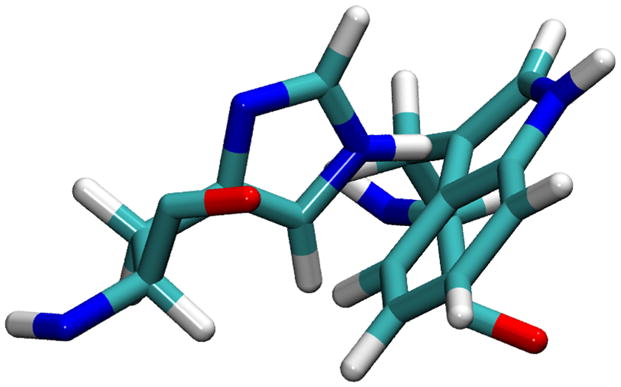
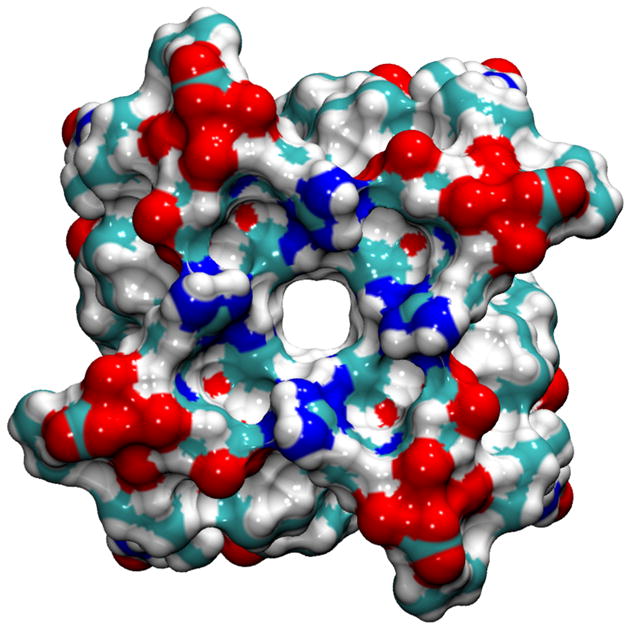
Selected Rotameric states for the (His37, Trp41) conformations; (t–80°, t–105°) in (a) and (b), (t–80°, t90°) in (c) and (d), are demonstrated using the initial 1NYJ structure.
The His37 and Trp41 residues from two adjacent helices are shown by the Licorice drawing method, whereas the whole polypeptide is shown by the Maximal Speed Molecular Surface (MSMS) drawing method using a probe radius of 1.4 Å. The colored objects represent: C (cyan), H (white), N (blue), and O (red). In the Licorice images, the left-side of the image points toward the N-terminus side, whereas the right-side of it points toward the C-terminus side. In the molecular surface view, the perspective is looking from the C-terminus end.
The illustrations of side chains configurations [Figs. 4(a) and (c)] reveal that there is a possible favorable interaction between Nε1 in Trp41 residue from helixi and Hε2 in His37 residue from helixi+1 as a hydrogen bonding (H-bonding) interaction. Although solid-state NMR results suggested that there is a possibility of H-bonding interactions as imidazole–imidazolium interactions,105 an alternative interpretation could be H-bonding interactions between His37 and Trp41 residues.
The t–160° His37 rotameric state and the t–105° and t90° rotameric states for Trp41 side chains were also observed in restrained MD simulations.46 The next discussion explores the importance of this rotameric state for spontaneous water molecule and ion distributions in the channel.
Distribution of Water Molecules and Ions
The zoomed-in water molecule densities inside the M2-TMD channel in the z direction for two different saline solutions are shown [Figs. 5(a) and (b)]. The water molecule density was calculated by averaging the water molecules located within 1.0 Å thick slabs parallel to the bilayer over all trajectories, then divided by the slab volume. In the channel, the density value is low because the slab is primarily occupied by lipid and channel atoms, but still demonstrates the presence of water molecules, on average, in each slab. In particular, there is an occasional presence of a few water molecules in the selectivity filter at z = 5 Å, even for the structure.
Figure 5.


A zoomed in water molecules density profiles inside a channel in the z direction in (black — line), (black – – line), and (grey — line) systems with (a) NaCl and (b) NH4Cl saline solutions.
The occasional presence of water molecules in the filter raises the possibility that ions can enter the channel as well. Therefore, we also examined the Cl− molality profiles for 10 ns production runs [Figs. 6(a) and (b)] in NaCl or NH4Cl saline solution, respectively. On the production run time scale, no Cl− were able to enter the selectivity region (around z = 5 Å) for and structures, whereas some Cl− were able to enter the selectivity-filter region for structure. Neither Na+ [Fig. 6(c)] nor [Fig. 6(d)] ions have any occupancy in the selectivity-filter region. In all M2-TMD structures, the high cation occupancy in the region (10 < z < 20 Å) is due to the negatively charged C-terminus side. The high cation occupancy in the structure in (−4 < z < 4 Å) is reduced by the repulsion effects from protonated imidazole rings for the +2 and +3 states. All anion and cations molality profiles show good homogeneity in the bulk region (| z | > 30 Å).
Figure 6.


Ions molality profiles in the z direction: Cl− molality profiles in (black — line), black – – line), and grey — line) systems with (a) NaCl and (b) NH4Cl saline solutions. Cation molality profiles in (black — line), (black – – line), and (grey — line) systems for (c) Na+ and (d) .
Because chloride ions have a better chance of entering the selectivity filter than their counterions due to electrostatic attraction to the titrated histidine side chains, we next examine the height of the free-energy barrier in the selectivity-filter region.
Ion Potentials of Mean Force
Generally, the free-energy barrier in the selectivity-filter region (Fig. 7) does not exceed 8 kcal/mol for any of the three ions or any of the three-charged states, which would probably be low enough to allow significant permeation.106 Therefore, the partially open state used in these umbrella sampling simulations does not fully exclude water molecules and ions, as we would expect the fully closed state would do.
Figure 7.


One-dimensional ions PMF profiles as a function of the transport coordinate. (a) Na+ PMF profiles in including different simulation times; 0.5 ns (grey — line), 0.75 ns (black – – line), and 1.0 ns (black — line). In the other panels, the PMF profiles shown are from the (black — line), (black – – line), and (grey — line) systems for (b) Cl−, (c) Na+, and (d) .
Free-energy profile convergence depends on many factors, such as adequacy of sampling of test ion positions in the umbrella windows, variations in surrounding structures on the umbrella window time scale (which, in turn, is very different for usage of serial processions along the transport coordinate rather than uniform starting structures for each umbrella window), and statistical fluctuations affecting relative positioning of PMF components from adjacent windows. We examined free-energy profile convergence by comparing free-energy profiles obtained with increasingly longer portions of the umbrella window trajectories. Convergence, determined from increasingly complete data sets, accuracy, judged from the proximity of the free-energy integral endpoint to the reference potential on the opposite side of the bilayer, and methodological independence, judged from comparison of the WHAM method to the PMR method [Eq. (4)], were all excellent. In one demonstration of convergence [Fig. 7(a)], the PMF converged to within 0.5 kcal/mol over the entire extent of the transport coordinate, whether based on 0.5, 0.75, or 1.0 ns, and to within 0.5 kcal/mol of the reference energy (0 kcal/mol at z = −20 Å) at the opposite z position (z = 20 Å). Other sources of uncertainty,90,91 such as polarizability effects, structural fluctuations during ion transport, and real-time titration of polypeptide or test ion (i.e., ammonium), have not been examined and might be interesting topics for future research.
Changing from the to the structure, the selectivity-filter free-energy barrier in the Cl− PMF profiles [Fig. 7(b)] gets lower. As expected, this behavior is in the opposite sense for the Na+ PMF profiles [Fig. 7(c)] and for the PMF profiles [Fig. 7(d)], except for the structure, where the more open form of the channel allows a lower barrier in spite of the electrostatic repulsion of the tetraimidazole selectivity filter.
The electrostatic attraction between the Cl− and the protonated imidazole rings is the apparent cause for the decrease in the Cl− translocation free-energy barrier. The cation results imply that the channel has a higher permeability for than for Na+, which is in a good agreement with some of the electrophysiological results.8 This prediction, based on the free-energy profile for a nondissociable model for ammonium, should be conservative, considering that proton dissociation in the channel may enhance effective ammonium conductance. However, the simulations make the prediction that the channel would have a higher permeability for Cl− than for either Na+ or (nondissociable) , which, although might be expected on electrostatics grounds, was not seen in whole-cell clamping of mouse erythroleukemia (MEL) cells.7,15 Of course, in contrast to the simulations with covalently titrated imidazole groups, experimentally, the protons titrating the His37 residues could flea in advance of incoming cations and might not substantially inhibit cation flow, and likewise a fourth titration might stabilize and be stabilized by Cl− in the filter. So, the remarkable finding here is that non-protonic current would appear to be moderately high for this structure in any of the selectivity-filter states, provided that all of the Trp41 side chains are in the open configuration.
From our simulations of Cl− and transport, it appears that the 1NYJ-based structure would not fully exclude non-protonic ions like the whole polypeptide in MEL cells does. Of course, the whole polypeptide may have slightly different tilt angles and His37–Trp41 rotamer positions.104
We were unable to confirm the high barrier to Na+ obtained with this structure in the initial report of proton-selective PMF profile21. We would speculate that, given the similarities of the most recent structural assessments for peptides in crystal101 and micelle103 to that obtained previously in bilayer38,102, the proton-selective and closed state (if any) may be yet to be identified.
Conclusions
Three M2-TMD structures with two different saline solutions were studied using MD and umbrella sampling simulations. The has been thought to represent a closed form, whereas the and represent intermediate forms.
Generally, our M2-TMD structures, after 25 ns preparation time with the CHARMM force field, have several of the features observed in NMR and X-ray studies.
The t–105° rotamer for Trp41 blocks the channel from passing water molecules, whereas the t90° rotamer allows the channel to pass them.
Cl− have a lower free-energy barrier in the selectivity-filter region of the M2-TMD channel than either Na+ or , and have a higher expected permeability than Na+.
Acknowledgments
We are grateful for the financial support of a Roland K. Robbins Graduate Research Fellowship. A generous allotment of computer time by the Ira and Marylou Fulton Supercomputing Center at Brigham Young University is acknowledged with thanks. This project was supported in part by NIH grant AI23007.
Contributor Information
Morad Mustafa, Department of Chemistry and Biochemistry, Brigham Young University, Provo, Utah 84602.
Douglas J. Henderson, Department of Chemistry and Biochemistry, Brigham Young University, Provo, Utah 84602
David D. Busath, Department of Physiology and Developmental Biology, Brigham Young University, Provo, Utah 84602
References
- 1.Lamb RA, Zebedee SL, Richardson CD. Influenza Virus M2 Protein is an Integral Membrane Protein Expressed on the Infected-Cell Surface. Cell. 1985;40(3):627–633. doi: 10.1016/0092-8674(85)90211-9. [DOI] [PubMed] [Google Scholar]
- 2.Zebedee SL, Lamb RA. Influenza A Virus M2 Protein: Monoclonal Antibody Restriction of Virus Growth and Detection of M2 in Virions. J Virol. 1988;62(8):2762–2772. doi: 10.1128/jvi.62.8.2762-2772.1988. [DOI] [PMC free article] [PubMed] [Google Scholar]
- 3.Skehel JJ, Bayley PM, Brown EB, Martin SR, Waterfield MD, White JM, Wilson IA, Wiley D. Changes in the Conformation of Influenza Virus Hemagglutinin at the pH Optimum of Virus-Mediated Membrane Fusion. Proc Natl Acad Sci USA. 1982;79(4):968–972. doi: 10.1073/pnas.79.4.968. [DOI] [PMC free article] [PubMed] [Google Scholar]
- 4.Sugrue RJ, Hay AJ. Structural Characteristics of the M2 Protein of Influenza A Viruses: Evidence that It Forms a Tetrameric Channel. Virology. 1991;180(2):617–624. doi: 10.1016/0042-6822(91)90075-M. [DOI] [PMC free article] [PubMed] [Google Scholar]
- 5.Pinto LH, Holsinger LJ, Lamb RA. Influenza Virus M2 Protein Has Ion Channel Activity. Cell. 1992;69(3):517–528. doi: 10.1016/0092-8674(92)90452-i. [DOI] [PubMed] [Google Scholar]
- 6.Wang C, Lamb RA, Pinto LH. Activation of the M2 Ion Channel of Influenza Virus: A Role for the Transmembrane Domain Histidine Residue. Biophys J. 1995;69(4):1363–1371. doi: 10.1016/S0006-3495(95)80003-2. [DOI] [PMC free article] [PubMed] [Google Scholar]
- 7.Chizhmakov IV, Geraghty FM, Ogden DC, Hayhurst A, Antoniou M, Hay AJ. Selective Proton Permeability and pH Regulation of the Influenza Virus M2 Channel Expressed in Mouse Erythroleukaemia Cells. J Physiol. 1996;494(2):329–336. doi: 10.1113/jphysiol.1996.sp021495. [DOI] [PMC free article] [PubMed] [Google Scholar]
- 8.Shimbo K, Brassard DL, Lamb RA, Pinto LH. Ion Selectivity and Activation of the M2 Ion Channel of Influenza Virus. Biophys J. 1996;70(3):1335–1346. doi: 10.1016/S0006-3495(96)79690-X. [DOI] [PMC free article] [PubMed] [Google Scholar]
- 9.Davies WL, Grunert RR, Haff RF, McGahen JW, Neumayer EM, Paulshock M, Watts JC, Wood TR, Hermann EC, Hoffmann CE. Antiviral Activity of 1-Adamantanamine (Amantadine) Science. 1964;144(3620):862–863. doi: 10.1126/science.144.3620.862. [DOI] [PubMed] [Google Scholar]
- 10.Appleyard G. Amantadine-Resistance as a Genetic Marker for Influenza Viruses. J Gen Virol. 1977;36(2):249–255. doi: 10.1099/0022-1317-36-2-249. [DOI] [PubMed] [Google Scholar]
- 11.Hay AJ, Wolstenholme AJ, Skehel JJ, Smith MH. The Molecular Basis of the Specific Anti-influenza Action of Amantadine. EMBO J. 1985;4(11):3021–3024. doi: 10.1002/j.1460-2075.1985.tb04038.x. [DOI] [PMC free article] [PubMed] [Google Scholar]
- 12.Skehel JJ. Amantadine Blocks the Channel. Nature. 1992;358(6382):110–111. doi: 10.1038/358110b0. [DOI] [PubMed] [Google Scholar]
- 13.Holsinger LJ, Nichani D, Pinto LH, Lamb RA. Influenza A Virus M2 Ion Channel Protein: A Structure-Function Analysis. J Virol. 1994;68(3):1551–1563. doi: 10.1128/jvi.68.3.1551-1563.1994. [DOI] [PMC free article] [PubMed] [Google Scholar]
- 14.Tosteson MT, Pinto LH, Holsinger LJ, Lamb RA. Reconstitution of the Influenza Virus M2 Ion Channel in Lipid Bilayers. J Mol Biol. 1994;142(1):117–126. doi: 10.1007/BF00233389. [DOI] [PubMed] [Google Scholar]
- 15.Chizhmakov IV, Ogden DC, Geraghty FM, Hayhurst A, Skinner A, Betakova T, Hay AJ. Differences in Conductance of M2 Proton Channels of Two Influenza Viruses at Low and High pH. J Physiol. 2003;546(2):427–438. doi: 10.1113/jphysiol.2002.028910. [DOI] [PMC free article] [PubMed] [Google Scholar]
- 16.Astrahan P, Kass I, Cooper MA, Arkin IT. A Novel Method of Resistance for Influenza Against a Channel-Blocking Antiviral Drug. Proteins. 2004;55(2):251–257. doi: 10.1002/prot.20018. [DOI] [PubMed] [Google Scholar]
- 17.Sugrue RJ, Bahadur G, Zambon MC, Hall-Smith M, Douglas AR, Hay AJ. Specific Structural Alteration of the Influenza Haemagglutinin by Amantadine. EMBO J. 1990;9(11):3469–3476. doi: 10.1002/j.1460-2075.1990.tb07555.x. [DOI] [PMC free article] [PubMed] [Google Scholar]
- 18.Okada A, Miura T, Takeuchi H. Protonation of Histidine and Histidine-Tryptophan Interaction in the Activation of the M2 Ion Channel from Influenza A Virus. Biochemistry. 2001;40(20):6053–6060. doi: 10.1021/bi0028441. [DOI] [PubMed] [Google Scholar]
- 19.Vijayvergiya V, Wilson R, Chorak A, Gao PF, Cross TA, Busath DD. Proton Conductance of Influenza Virus M2 Protein in Planar Lipid Bilayers. Biophys J. 2004;87 (3):1697–1704. doi: 10.1529/biophysj.104.043018. [DOI] [PMC free article] [PubMed] [Google Scholar]
- 20.Hu J, Fu R, Cross TA. The Chemical and Dynamical Influence of the Anti-Viral Drug Amantadine on the M2 Proton Channel Transmembrane Domain. Biophys J. 2007;93 (1):276–283. doi: 10.1529/biophysj.106.102103. [DOI] [PMC free article] [PubMed] [Google Scholar]
- 21.Chen H, Wu Y, Voth GA. Proton Transport Behavior through the Influenza A M2 Channel: Insights from Molecular Simulation. Biophys J. 2007;93(10):3470–3479. doi: 10.1529/biophysj.107.105742. [DOI] [PMC free article] [PubMed] [Google Scholar]
- 22.Duff KC, Ashley RH. The Transmembrane Domain of Influenza A M2 Protein Forms Amantadine-Sensitive Proton Channels in Planar Lipid Bilayers. Virology. 1992;190(1):485–489. doi: 10.1016/0042-6822(92)91239-q. [DOI] [PubMed] [Google Scholar]
- 23.Watanabe T, Watanabe S, Ito H, Kida H, Kawaoka Y. Influenza A Virus Can Undergo Multiple Cycles of Replication without M2 Ion Channel Activity. J Virol. 2001;75(12):5656–5662. doi: 10.1128/JVI.75.12.5656-5662.2001. [DOI] [PMC free article] [PubMed] [Google Scholar]
- 24.Takeda M, Pekosz A, Shuck K, Pinto LH, Lamb RA. Influenza A Virus M2 Ion Channel Activity Is Essential for Efficient Replication in Tissue Culture. J Virol. 2002;76 (3):1391–1399. doi: 10.1128/JVI.76.3.1391-1399.2002. [DOI] [PMC free article] [PubMed] [Google Scholar]
- 25.McCown MF, Pekosz A. Distinct Domains of the Influenza A Virus M2 Protein Cytoplasmic Tail Mediate Binding to the M1 Protein and Facilitate Infectious Virus Production. J Virol. 2006;80(16):8178–8189. doi: 10.1128/JVI.00627-06. [DOI] [PMC free article] [PubMed] [Google Scholar]
- 26.Iwatsuki-Horimoto K, Horimoto T, Noda T, Kiso M, Maeda J, Watanabe S, Muramoto Y, Fujii K, Kawaoka Y. The Cytoplasmic Tail of the Influenza A Virus M2 Protein Plays a Role in Viral Assembly. J Virol. 2006;80(11):5233–5240. doi: 10.1128/JVI.00049-06. [DOI] [PMC free article] [PubMed] [Google Scholar]
- 27.Holsinger LJ, Lamb RA. Influenza Virus M2 Integral Membrane Protein Is a Homote- tramer Stabilized by Formation of Disulfide Bonds. Virology. 1991;183(1):32–43. doi: 10.1016/0042-6822(91)90115-r. [DOI] [PubMed] [Google Scholar]
- 28.Panayotov PP, Schlesinger RW. Oligomeric Organization and Strain-Specific Proteolytic Modification of the Virion M2 Protein of Influenza A H1N1 Viruses. Virology. 1992;186(1):352–355. doi: 10.1016/0042-6822(92)90096-8. [DOI] [PubMed] [Google Scholar]
- 29.Sansom MSP, Kerr ID. Influenza Virus M2 Protein: A Molecular Modelling Study of the Ion Channel. Protein Eng. 1993;6(1):65–74. doi: 10.1093/protein/6.1.65. [DOI] [PubMed] [Google Scholar]
- 30.Wang J, Kim S, Kovacs F, Cross TA. Structure of the Transmembrane Region of the M2 protein H+ Channel. Protein Sci. 2001;10(11):2241–2250. doi: 10.1110/ps.17901. [DOI] [PMC free article] [PubMed] [Google Scholar]
- 31.Kovacs FA, Cross TA. Transmembrane Four-Helix Bundle of Influenza A M2 Pro- tein Channel: Structural Implications from Helix Tilt and Orientation. Biophys J. 1997;73 (5):2511–2517. doi: 10.1016/S0006-3495(97)78279-1. [DOI] [PMC free article] [PubMed] [Google Scholar]
- 32.Pinto LH, Dieckmann GR, Gandhi CS, Papworth CG, Braman J, Shaughnessy MA, Lear JD, Lamb RA, DeGrado WF. A Functionally Defined Model for the M2 Proton Channel of Influenza A Virus Suggests a Mechanism for its Ion Selectivity. Proc Natl Acad Sci USA. 1997;94(21):11301–11306. doi: 10.1073/pnas.94.21.11301. [DOI] [PMC free article] [PubMed] [Google Scholar]
- 33.Forrest LR, Kukol A, Arkin IT, Tieleman DP, Sansom MSP. Exploring Models of the Influenza A M2 Channel: MD Simulations in a Phospholipid Bilayer. Biophys J. 2000;78 (1):55–69. doi: 10.1016/s0006-3495(00)76572-6. [DOI] [PMC free article] [PubMed] [Google Scholar]
- 34.Lin TI, Schroeder C. Definitive Assignment of Proton Selectivity and Attoampere Unitary Current to the M2 Ion Channel Protein of Influenza A Virus. J Virol. 2001;75(8):3647–3656. doi: 10.1128/JVI.75.8.3647-3656.2001. [DOI] [PMC free article] [PubMed] [Google Scholar]
- 35.Mould JA, Drury JE, Frings SM, Kaupp UB, Pekosz A, Lamb RA, Pinto LH. Permeation and Activation of the M2 Ion Channel of Influenza A Virus. J Biol Chem. 2000;275(40):31038–31050. doi: 10.1074/jbc.M003663200. [DOI] [PubMed] [Google Scholar]
- 36.Tang Y, Zaitseva F, Lamb RA, Pinto LH. The Gate of the Influenza Virus M2 Proton Channel Is Formed by a Single Tryptophan Residue. J Biol Chem. 2002;277(42):39880–39886. doi: 10.1074/jbc.M206582200. [DOI] [PubMed] [Google Scholar]
- 37.Venkataraman P, Lamb RA, Pinto LH. Chemical Rescue of Histidine Selectivity Filter Mutants of the M2 Ion Channel of Influenza A Virus. J Biol Chem. 2005;280(22):21463–21472. doi: 10.1074/jbc.M412406200. [DOI] [PubMed] [Google Scholar]
- 38.Nishimura K, Kim S, Zhang L, Cross TA. The Closed State of a H+ Channel Helical Bundle Combining Precise Orientational and Distance Restraints from Solid State NMR. Biochemistry. 2002;41(44):13170–13177. doi: 10.1021/bi0262799. [DOI] [PubMed] [Google Scholar]
- 39.Sansom MSP, Kerr ID, Smith GR, Son HS. The Influenza A Virus M2 Channel: A Molecular Modeling and Simulation Study. Virology. 1997;233(1):163–173. doi: 10.1006/viro.1997.8578. [DOI] [PubMed] [Google Scholar]
- 40.Forrest LR, DeGrado WF, RDG, Sansom MSP. Two Models of the Influenza A M2 Channel Domain: Verification by Comparison. Fold Des. 1998;3(6):443–448. doi: 10.1016/S1359-0278(98)00061-3. [DOI] [PubMed] [Google Scholar]
- 41.Zhong QF, Husslein T, Moore PB, Newns DM, Pattnaik P, Klein ML. The M2 Channel of Influenza A Virus: A Molecular Dynamics Study. FEBS Lett. 1998;434(3):265–271. doi: 10.1016/s0014-5793(98)00988-0. [DOI] [PubMed] [Google Scholar]
- 42.Zhong Q, Newns DM, Pattnaik P, Lear JD, Klein ML. Two Possible Conducting States of the Influenza A Virus M2 Ion Channel. FEBS Lett. 2000;473(2):195–198. doi: 10.1016/s0014-5793(00)01522-2. [DOI] [PubMed] [Google Scholar]
- 43.Schweighofer KJ, Pohorille A. Computer Simulation of Ion Channel Gating: The M2 Channel of Influenza A Virus in a Lipid Bilayer. Biophys J. 2000;78(1):150–163. doi: 10.1016/S0006-3495(00)76581-7. [DOI] [PMC free article] [PubMed] [Google Scholar]
- 44.Smondyrev AM, Voth GA. Molecular Dynamics Simulation of Proton Transport through the Influenza A Virus M2 Channel. Biophys J. 2002;83(4):1987–1996. doi: 10.1016/S0006-3495(02)73960-X. [DOI] [PMC free article] [PubMed] [Google Scholar]
- 45.Kass I, Arkin IT. How pH Opens a H+ Channel: The Gating Mmechanism of Influenza A M2. Structure. 2005;13(12):1789–1798. doi: 10.1016/j.str.2005.08.022. [DOI] [PubMed] [Google Scholar]
- 46.Wu YJ, Voth GA. A Computational Study of the Closed and Open States of the Influenza A M2 Proton Channel. Biophys J. 2005;89(4):2402–2411. doi: 10.1529/biophysj.105.066647. [DOI] [PMC free article] [PubMed] [Google Scholar]
- 47.Jorgensen WL, Chandrasekhar J, Madura JD, Impey RW, Klein ML. Comparison of Simple Potential Functions for Simulating Liquid Water. J Chem Phys. 1983;79(2):926–935. [Google Scholar]
- 48.Humphrey W, Dalke A, Schulten K. VMD: Visual Molecular Dynamics. J Mol Graphics. 1996;14(1):33–38. doi: 10.1016/0263-7855(96)00018-5. [DOI] [PubMed] [Google Scholar]
- 49.Black G, Daily J, Didier B, Elsethagen T, Feller D, Gracio D, Hackler M, Havre S, Jones D, Jurrus E, et al. ECCE, A Problem Solving Environment for Computational Chemistry, Software Version 4.5.1. Richland, Washington 99352-0999, USA: Pacific Northwest National Laboratory; 2007. [Google Scholar]
- 50.Kendall RA, Apra E, Bernholdt DE, Bylaska EJ, Dupuis M, Fann GI, Harrison RJ, Ju JL, Nichols JA, Nieplocha J, et al. High Performance Computational Chemistry: An Overview of NWChem a Distributed Parallel Application. Comput Phys Commun. 2000;128(1–2):260–283. [Google Scholar]
- 51.Bylaska EJ, de Jong WA, Kowalski K, Straatsma TP, Valiev M, Wang D, Aprà E, Windus TL, Hirata S, Hackler MT, et al. NWChem, A Computational Chemistry Package for Parallel Computers, Version 5.0. Richland, Washington 99352-0999, USA: Pacific Northwest National Laboratory; 2006. [Google Scholar]
- 52.Jorgensen WL, Gao J. Monte Carlo Simulations of the Hydration of Ammonium and Carboxylate Ions. J Phys Chem. 1986;90(10):2174–2182. [Google Scholar]
- 53.Chiu SW, Clark M, Balaji V, Subramaniam S, Scott HL, Jakobsson E. Incorporation of Surface Tension into Molecular Dynamics Simulation of an Interface: A Fluid Phase Lipid Bilayer Membrane. Biophys J. 1995;69(4):1230–1245. doi: 10.1016/S0006-3495(95)80005-6. [DOI] [PMC free article] [PubMed] [Google Scholar]
- 54.Zhang Y, Feller SE, Brooks RW, Pastor RW. Computer Simulation of Liquid/Liquid Interfaces. I. Theory and Application to Octane/Water. J Chem Phys. 1995;103(23):10252–10266. [Google Scholar]
- 55.Feller SE, Zhang Y, Pastor RW. Computer Simulation of Liquid/Liquid Interfaces. II. Surface Tension-Area Dependence of a Bilayer and Monolayer. J Chem Phys. 1995;103(23):10267–10276. [Google Scholar]
- 56.Feller SE, Pastor RW. Constant Surface Tension Simulations of Lipid Bilayers: The Sensitivity of Surface Areas and Compressibilities. J Chem Phys. 1999;111(3):1281–1287. [Google Scholar]
- 57.Koenig BW, Strey HH, Gawrisch K. Membrane Lateral Compressibility Determined by NMR and X-ray Diffraction: Effect of Acyl Chain Polyunsaturation. Biophys J. 1997;73 (4):1954–1966. doi: 10.1016/S0006-3495(97)78226-2. [DOI] [PMC free article] [PubMed] [Google Scholar]
- 58.Takaoka Y, Pasenkiewicz-Gierula M, Miyagawa H, Kitamura K, Tamura Y, Kusumi A. Molecular Dynamics Generation of Nonarbitrary Membrane Models Reveals Lipid Orientational Correlations. Biophys J. 2000;79(6):3118–3138. doi: 10.1016/S0006-3495(00)76546-5. [DOI] [PMC free article] [PubMed] [Google Scholar]
- 59.Högberg CJ, Lyubartsev AP. A Molecular Dynamics Investigation of the Influence of Hydration and Temperature on Structural and Dynamical Properties of a Dimyristoylphos-phatidylcholine Bilayer. J Phys Chem B. 2006;110(29):14326–14336. doi: 10.1021/jp0614796. [DOI] [PubMed] [Google Scholar]
- 60.Petrache HI, Tristram-Nagle S, Harries D, Kučerka N, Nagle JF, Parsegian VA. Swelling of Phospholipids by Monovalent Salt. J Lipid Res. 2006;47(2):302–309. doi: 10.1194/jlr.M500401-JLR200. [DOI] [PMC free article] [PubMed] [Google Scholar]
- 61.Israelachvili JN. Intermolecular and Surface Forces. San Diego, CA, USA: Academic Press; 1992. [Google Scholar]
- 62.Errington JR, Kofke DA. Calculation of Surface Tension via Area Sampling. J Chem Phys. 2007;127(17):174709. doi: 10.1063/1.2795698. [DOI] [PubMed] [Google Scholar]
- 63.Feller SE, Pastor RW. On Simulating Lipid Bilayers with an Applied Surface Tension: Periodic Boundary Conditions and Undulations. Biophys J. 1996;71(3):1350–1355. doi: 10.1016/S0006-3495(96)79337-2. [DOI] [PMC free article] [PubMed] [Google Scholar]
- 64.Sankararamakrishnan R, Weinstein H. Surface Tension Parameterization in Molecular Dynamics Simulations of a Phospholipid-bilayer Membrane: Calibration and Effects. J Phys Chem B. 2004;108(31):11802–11811. [Google Scholar]
- 65.Woolf TB, Roux B. Structure, Energetics, and Dynamics of Lipid-Protein Interactions: A Molecular Dynamics Study of the Gramicidin A Channel in a DMPC Bilayer. Proteins. 1996;24(1):92–114. doi: 10.1002/(SICI)1097-0134(199601)24:1<92::AID-PROT7>3.0.CO;2-Q. [DOI] [PubMed] [Google Scholar]
- 66.Townsley LE, Tucker WA, Sham S, Hinton JF. Structures of Gramicidins A, B, and C Incorporated into Sodium Dodecyl Sulfate Micelles. Biochemistry. 2001;40(39):11676–11686. doi: 10.1021/bi010942w. [DOI] [PubMed] [Google Scholar]
- 67.Chiu SW, Subramaniam S, Jakobsson E. Simulation Study of a Gramicidin/Lipid Bilayer System in Excess Water and Lipid. I. Structure of the Molecular Complex. Biophys J. 1999;76 (4):1929–1938. doi: 10.1016/S0006-3495(99)77352-2. [DOI] [PMC free article] [PubMed] [Google Scholar]
- 68.Harroun TA, Heller WT, Weiss TM, Yang L, Huang HW. Experimental Evidence for Hydrophobic Matching and Membrane-Mediated Interactions in Lipid Bilayers Containing Gramicidin. Biophys J. 1999;76(2):937–945. doi: 10.1016/S0006-3495(99)77257-7. [DOI] [PMC free article] [PubMed] [Google Scholar]
- 69.Ku cerka N, Liu Y, Chu N, Petrache HI, Tristram-Nagle S, Nagle JF. Structure of Fully Hydrated Fluid Phase DMPC and DLPC Lipid Bilayers Using X-ray Scattering from Oriented Multilamellar Arrays and from Unilamellar Vesicles. Biophys J. 2005;88(1):2626–2637. doi: 10.1529/biophysj.104.056606. [DOI] [PMC free article] [PubMed] [Google Scholar]
- 70.Allen TW, Baştuğ T, Kuyucak S, Chung SH. Gramicidin A Channel as a Test Ground for Molecular Dynamics Force Fields. Biophys J. 2003;84(4):2159–2168. doi: 10.1016/S0006-3495(03)75022-X. [DOI] [PMC free article] [PubMed] [Google Scholar]
- 71.Phillips JC, Braun R, Wang W, Gumbart J, Tajkhorshid E, Villa E, Chipot C, Skeel RD, Kalé L, Schulten K. Scalable Molecular Dynamics with NAMD. J Comput Chem. 2005;26(16):1781–1802. doi: 10.1002/jcc.20289. [DOI] [PMC free article] [PubMed] [Google Scholar]
- 72.MacKerell AD, Jr, Bashford D, Bellott RL, Dunbrack RL, Jr, Evanseck JD, Field MJ, Fischer S, Gao J, Guo H, Ha S, et al. All-Atom Empirical Potential for Molecular Modeling and Dynamics Studies of Proteins. J Phys Chem B. 1998;102(18):3586–3616. doi: 10.1021/jp973084f. [DOI] [PubMed] [Google Scholar]
- 73.MacKerell AD, Jr, Feig M, Brooks CL., III Extending the Treatment of Backbone Energetics in Protein Force Fields: Limitations of Gas-Phase Quantum Mechanics in Reproducing Protein Conformational Distributions in Molecular Dynamics Simulations. J Comput Chem. 2004;25(11):1400–1415. doi: 10.1002/jcc.20065. [DOI] [PubMed] [Google Scholar]
- 74.MacKerell AD, Jr, Feig M, Brooks CL., III Improved Treatment of the Protein Back- bone in Empirical Force Fields. J Am Chem Soc. 2004;126(3):698–699. doi: 10.1021/ja036959e. [DOI] [PubMed] [Google Scholar]
- 75.Beglov D, Benoît R. Finite Representation of an Infinite Bulk System: Solvent Boundary Potential for Computer Simulations. J Chem Phys. 1994;100(12):9050–9063. [Google Scholar]
- 76.Schlenkrich M, Brickmann J, MacKerell AD, Jr, Karplus M. An Empirical Potential Energy Function for Phospholipids: Criteria for Parameter Optimization and Applications. In: Merz KM, Roux B, editors. Biological Membranes: A Molecular Perspective from Computation and Experiment. Boston, MA: Birkhäuser; 1996. pp. 31–81. [Google Scholar]
- 77.Feller SE, MacKerell AD., Jr An Improved Empirical Potential Energy Function for Molecular Simulations of Phospholipids. J Phys Chem B. 2000;104(31):7510–7515. [Google Scholar]
- 78.Steinbach PJ, Brooks BR. New Spherical-Cutoff Methods for Long-Range Forces in Macromolecular Simulation. J Comput Chem. 1994;15(7):667–683. [Google Scholar]
- 79.Martyna GJ, Tobias DJ, Klein ML. Constant Pressure Molecular Dynamics Algo- rithms. J Chem Phys. 1994;101(5):4177–4189. [Google Scholar]
- 80.Feller SE, Zhang Y, Pastor RW, Brooks BR. Constant Pressure Molecular Dynamics Simulation: The Langevin Piston Method. J Chem Phys. 1995;103(11):4613–4621. [Google Scholar]
- 81.Welch BB, Jones K, Hobbs J. Practical Programming in Tcl and Tk. 4. Upper Saddle River, NJ: Prentice Hall PTR; 2003. [Google Scholar]
- 82.Lovell SC, Word JM, Richardson JS, Richardson DC. The Penultimate Rotamer Library. Proteins. 2000;40(3):389–408. [PubMed] [Google Scholar]
- 83.Adams PD, Arkin IT, Engelman DM, Brünger AT. Computational Searching and Mutagenesis Suggest a Structure for the Pentameric Transmembrane Domain of Phospholamban. Nat Struct Mol Biol. 1995;2(2):154–162. doi: 10.1038/nsb0295-154. [DOI] [PubMed] [Google Scholar]
- 84.Ben-Tal N, Honig B. Helix-Helix Interactions in Lipid Bilayers. Biophys J. 1996;71 (6):3046–3050. doi: 10.1016/S0006-3495(96)79498-5. [DOI] [PMC free article] [PubMed] [Google Scholar]
- 85.Mustafa M, Busath DD. The Gramicidin Channel Ion Permeation Free-Energy Profile: Direct and Indirect Effects of CHARMM Force Field Improvements. Interdiscip Sci Comput Life Sci. 2008 doi: 10.1007/s12539-009-0025-3. In press. [DOI] [PMC free article] [PubMed] [Google Scholar]
- 86.Roux B. Statistical Mechanical Equilibrium Theory of Selective Ion Channels. Biophys J. 1999;77(1):139–153. doi: 10.1016/S0006-3495(99)76878-5. [DOI] [PMC free article] [PubMed] [Google Scholar]
- 87.Allen TW, Andersen OS, Roux B. Energetics of Ion Conduction through the Gramicidin Channel. Proc Natl Acad Sci USA. 2004;101(1):117–122. doi: 10.1073/pnas.2635314100. [DOI] [PMC free article] [PubMed] [Google Scholar]
- 88.Allen TW, Andersen OS, Roux B. Molecular Dynamics — Potential of Mean Force Cal- culations as a Tool for Understanding Ion Permeation and Selectivity in Narrow Channels. Biophys Chem. 2006;124(3):251–267. doi: 10.1016/j.bpc.2006.04.015. [DOI] [PubMed] [Google Scholar]
- 89.Allen TW, Andersen OS, Roux B. Ion Permeation through a Narrow Channel: Using Gramicidin to Ascertain All-Atom Molecular Dynamics Potential of Mean Force Methodology and Biomolecular Force Fields. Biophys J. 2006;90(10):3447–3468. doi: 10.1529/biophysj.105.077073. [DOI] [PMC free article] [PubMed] [Google Scholar]
- 90.Kato M, Warshel A. Through the Channel and around the Channel: Validating and Comparing Microscopic Approaches for the Evaluation of Free Energy Profiles for Ion Penetration through Ion Channels. J Phys Chem B. 2005;109(41):19516–19522. doi: 10.1021/jp053208l. [DOI] [PMC free article] [PubMed] [Google Scholar]
- 91.Warshel A, Sharma PK, Kato M, Parson WW. Modeling Electrostatic Effects in Pro- teins. Biochim Biophys Acta Proteins Proteomics. 2006;1764(11):1647–1676. doi: 10.1016/j.bbapap.2006.08.007. [DOI] [PubMed] [Google Scholar]
- 92.Roux B. The Calculation of the Potential of Mean Force Using Computer Simulations. Comput Phys Commun. 1995;91(1–3):275–282. [Google Scholar]
- 93.Grossfield A. An Implementation of WHAM: The weighted histogram analysis method. Available from: http://membrane.urmc.rochester.edu/
- 94.Kumar S, Rosenberg JM, Bouzida D, Swendsen RH, Kollman PA. The Weighted Histogram Analysis Method for Free-Energy Calculations on Biomolecules. I. The Method. J Comput Chem. 1992;13(8):1011–1021. [Google Scholar]
- 95.Souaille M, Roux B. Extension to the Weighted Histogram Analysis Method: Combining Umbrella Sampling with Free Energy Calculations. Comput Phys Commun. 2001;135(1):40–57. [Google Scholar]
- 96.Trzesniak D, Kunz APE, van Gunsteren WF. A Comparison of Methods to Compute the Potential of Mean Force. Chem Phys Chem. 2007;8(1):162–169. doi: 10.1002/cphc.200600527. [DOI] [PubMed] [Google Scholar]
- 97.Burden RL, Faires JD. Numerical Analysis. 7. Pacific Grove, CA: Brooks Cole; 2001. [Google Scholar]
- 98.Petrache HI, Dodd SW, Brown MF. Area per Lipid and Acyl Length Distributions in Fluid Phosphatidylcholines Determined by 2H NMR Spectroscopy. Biophys J. 2000;79 (6):3172–3192. doi: 10.1016/S0006-3495(00)76551-9. [DOI] [PMC free article] [PubMed] [Google Scholar]
- 99.Otten D, Brown MF, Beyer K. Softening of Membrane Bilayers by Detergents Eluci- dated by Deuterium NMR Spectroscopy. J Phys Chem B. 2000;104(51):12119–12129. [Google Scholar]
- 100.Aussenac F, Laguerre M, Schmitter JM, Dufourc EJ. Detailed Structure and Dynamics of Bicelle Phospholipids Using Selectively Deuterated and Perdeuterated Labels. 2H NMR and Molecular Mechanics Study. Langmuir. 2003;19(25):10468–10479. [Google Scholar]
- 101.Stouffer AL, Acharya R, Salom D, Levine AS, Costanzo LD, Soto CS, Tereshko V, Nanda V, Stayrook SF, DeGrado W. Structural Basis for the Function and Inhibition of an Influenza Virus Proton Channel. Nature. 2008;451(7178):596–600. doi: 10.1038/nature06528. [DOI] [PMC free article] [PubMed] [Google Scholar]
- 102.Hu J, Asbury T, Achuthan S, Li C, Bertram R, Quine JR, Fu R, Cross TA. Backbone Structure of the Amantadine-Blocked Trans-Membrane Domain M2 Proton Channel from Influenza A Virus. Biophys J. 2007;92(12):4335–4343. doi: 10.1529/biophysj.106.090183. [DOI] [PMC free article] [PubMed] [Google Scholar]
- 103.Schnell JR, Chou JJ. Structure and Mechanism of the M2 Proton Channel of Influenza A Virus. Nature. 2008;451(7178):591–595. doi: 10.1038/nature06531. [DOI] [PMC free article] [PubMed] [Google Scholar]
- 104.Tian C, Gao PF, Pinto LH, Lamb RA, Cross TA. Initial Structural and Dynamic Characterization of the M2 Protein Transmembrane and Amphipathic Helices in Lipid Bilayers. Protein Sci. 2003;12(11):2597–2605. doi: 10.1110/ps.03168503. [DOI] [PMC free article] [PubMed] [Google Scholar]
- 105.Hu J, Fu R, Nishimura K, Zhang L, Zhou HX, Busath DD, Vijayvergiya V, Cross TA. Histidines, Heart of the Hydrogen Ion Channel from Influenza A Virus: Toward an Understanding of Conductance and Proton Selectivity. Proc Natl Acad Sci USA. 2006;103(18):6865–6870. doi: 10.1073/pnas.0601944103. [DOI] [PMC free article] [PubMed] [Google Scholar]
- 106.Edwards S, Corry B, Kuyucak S, Chung SH. Continuum Electrostatics Fails to Describe Ion Permeation in the Gramicidin Channel. Biophys J. 2002;83(3):1348–1360. doi: 10.1016/S0006-3495(02)73905-2. [DOI] [PMC free article] [PubMed] [Google Scholar]