

Abstract
A serendipitous observation led to this study of V1 activity rebounds, that occur well after stimulus offset, and their relationship to visual aftereffects. We found that when a focal visual stimulus and background were simultaneously turned off, there was strong delayed rebounding activity (distinct from any off response). The neural rebound started 350 - 500 ms after stimulus offset and its magnitude and duration were correlated with the prior visual response of the cell. In human psychophysical experiments we found a delayed aftereffect that may be a perceptual correlate of the activity rebound. Both the rebound activity and the perceptual aftereffect disappeared if the stimulus bar and background were not extinguished together. The aftereffect was not seen when the bar and background offsets were presented to different eyes, suggesting an early neural (monocular) basis for the aftereffect. However, the magnitude of the activity rebound varied with the spatial scale of the background even though background size had little effect on the visual response. It thus appeared that rebound magnitude was determined by an integration area more consistent with visual cortex than retina. Overall we find a strong correlation between rebound activity and the perceived aftereffect. In addition to providing a possible explanation and neural correlate of a visual aftereffect, rebounding activity may provide new insight into the dynamics of cortical circuitry.
Keywords: aftereffect, afterimage, off response, temporal context, background offset, visual perception, V1, macaque monkey
Introduction
Most studies of visual processing focus on the dependence of neural activity on spatial aspects of visual stimuli. There have been relatively fewer studies of temporal response patterns and their correlation with visual perception. The subject of the present study is neural activity that occurs after a stimulus is extinguished and its possible connection to the perception of an aftereffect. The basic finding reported here came about through serendipity. In a previous study of macaque area V1 (Huang & Paradiso, 2005), we sought to examine neural activity in more natural situations by recording responses to optimal bar stimuli when they were presented simultaneously with a change in the background (simulating the effect of a saccade). In a typical trial, a bar was presented simultaneously with a change from black to gray background. When the bar was turned off, the gray background also reverted to black. Some cells gave an off response and, regardless, after about 100 ms the activity of all cells was reduced to a low level. To our surprise, we frequently observed a rebound in which neural activity rapidly increased starting 350 - 500 ms after stimulus offset. This activity rebound was distinct from any off response.
We are not aware of any previous report of such rebounding activity in V1 (or in any other brain area). The present physiological experiments quantify the effect and characterize factors influencing the activity rebound. In psychophysical experiments we test whether there is any perceptual correlate of rebounding activity; we find a visual aftereffect that occurs under similar conditions. The results have implications for both the perception of aftereffects and the nature of V1 circuitry.
Methods
Physiology: General
Our neurophysiological methods have been described in detail previously (Huang & Paradiso 2005) and are briefly summarized here. Experiments were performed on two female macaque monkeys (Macaca mulatta), weighing 5.0~6.3 kg. Before recording, each monkey was surgically implanted with a head post and a recording chamber overlaying the operculum of area V1. All procedures were approved by Brown University’s institutional animal care and use committee and were in accordance with the National Institutes of Health Guide for the Care and Use of Laboratory Animals.
During recording, animals performed a fixation task. The eye position of the monkey was required to remain within a square fixation window, 0.7~1.0° wide, centered on a small fixation spot. Eye position was measured at 60 Hz using an infrared video system (ISCAN Inc.) with spatial resolution of 0.2°~0.3°. The animal was required to hold fixation for 300 ms, after which a visual stimulus was presented on the screen for 550 to 600 ms. The monkey was required to continue holding fixation for 1000 or 1500 ms after stimulus offset. We also analyzed data collected for an experiment that used slightly different timing. In that experiment, which yielded 105 recorded neurons, monkeys were only required to maintain fixation for 500 ms after stimulus offset. In all experimental paradigms, the monkeys were free to move their eyes around during the inter-trial interval, which was about 1.5 seconds.
Extracellular potentials were recorded using insulated tungsten microelectrodes (Frederick Haer Co.). Action potentials were discriminated with a template-based software system (Alpha-Omega Inc.). The RF was defined as the minimum response field and its properties were determined initially with a computer-generated bar of light, whose parameters were varied manually. The RFs of the V1 neurons were located in the lower contralateral visual field with eccentricities of 3~6°. The sizes of the RFs were usually within the range of 0.6~1.2°.
Physiology: Visual stimuli
The experimental room was dimly illuminated. Visual stimuli were presented on a 27 inch video monitor, which subtended 33×25° at the viewing distance of 93 cm. The monitor was driven by a Number Nine Corporation graphics board with 640×480 pixel resolution at a refresh rate of 60 Hz. The standard visual stimulus was a bar of light (18.1 cd/m2) presented on a uniform gray background (8.6 cd/m2) that covered the whole video monitor. The length of the stimulus bar was sized to the RF and the width was 0.15°. Orientation selectivity was assessed by presenting the bar in 30° steps spanning 180°. Sensitivity to contrast was studied by varying the luminance of the stimulus bar. At stimulus offset, the stimulus bar was turned off and the gray background simultaneously changed to black (0.02 cd/m2) (Figure 1A).
Figure 1.

Overview of the physiological experiment. A. The visual stimulus was a bar of light presented on a uniform gray background. The bar was turned off simultaneously with a change from gray to black background. B. Raster plot and PSTH from a representative V1 neuron. The top of this panel shows the animal’s fixation period. In the raster plot below, each short bar represents a spike. Spikes are aligned relative to stimulus offset (time zero). The small red square at the beginning of each trial indicates the stimulus onset time. The raster plot and PSTH show that after stimulus offset, this neuron gave a transient off response lasting for about 150 ms, followed by a period with low activity and then a strong activity rebound starting around 450 ms and lasting for about 600 ms.
A few variants of the basic visual stimulus were also used. First, we varied the size of the uniform background. Presented as a circular disk centered on the RF, the background covered a range from 2.6° to 15.5° across (Figure 5). Second, we manipulated the background offset and luminance. In the principle experimental condition, the background changed from gray to black. In other control conditions, the background was either fixed gray (Figure 6B) or black (Figure 6D).
Figure 5.

Rebound activity depends on background size. A. The gray background varied in size from 2.6° to 15.5°. B. Averaged normalized PSTHs of 26 neurons as background size varied. To avoid excessive clutter, responses to only 4 of the 5 background sizes are shown. C. The mean firing rates of the visual responses were calculated 0 to 500 ms after stimulus onset (red symbols) and the mean rebound activities were calculated 500 to 1000 ms after stimulus offset (black symbols). With a diameter of 2.6°, rebound activity was significantly weaker than with larger disk diameters (indicated by the asterisk, see text), but visual responses did not differ. Mean spontaneous activity across the 26 neurons is indicated by the dash line.
Figure 6.

Importance of background offset in rebound activity. A. and C. show for 2 neurons that when the stimulus bar was switched off simultaneously with the background, clear rebound activity was observed. B. When the stimulus bar was turned off but the background remained gray, rebound activity was much weaker or absent (same neuron as A). D. When the background was static black, the visual response was stronger than with the gray background (C), but there was little, if any, rebound activity around 500 ms after stimulus offset (same neuron as C).
Physiology: Data analysis
Data analyses included all the neurons tested in each experiment paradigm. Post-stimulus time histograms (PSTHs) with a bin width of 10 ms were constructed and smoothed using a Savitzky-Golay (SG) filter with a second degree underlying polynomial and a window size of 5 bins. The SG filter (also known as a digital smoothing polynomial filter) is a least squares moving average that preserves features better than simple adjacent bin averaging. To obtain an averaged PSTH across the neuronal population, the raw PSTH for each neuron was normalized to its maximum firing rate and the normalized responses of all neurons were averaged and then smoothed.
The average visual response was computed 0 to 500 ms after stimulus onset and the post-off-response (i.e. after the usual OFF response) was computed 500 to 1000 ms after stimulus offset. To compare response magnitudes between two stimulus conditions, a nonparametric Wilcoxon signed rank test was used when the sample size was relatively small (N ≤ 50), and a paired student t-test was used when the sample size was greater than 50. In either case, P < 0.05 was considered to be significant.
Human Psychophysics
For the study of visual aftereffects in humans, three naïve subjects and one of the authors, all with normal or corrected-to-normal vision, participated in psychophysical experiments. The subject’s head was lightly restrained in a chin cup and forehead rest.
Visual stimuli were displayed on a 22” CRT display (1280×1024 pixel resolution) with a refresh rate of 60 Hz. Stimuli were created with Psychtoolbox (Brainard, 1997; Pelli, 1997) running in Matlab. A small (0.023 deg diameter) red central fixation spot (3 cd/m2) was presented on a full-screen black background (0.0 cd/m2). After 300 ms the background changed from black to gray (6 cd/m2). Simultaneously with the background change, a white bar (110 cd/m2) was presented 1.8 deg to the right and 1.9 deg below the fixation point. After 550 ms the bar was turned off and the background reverted to black.
Subjects were instructed to look for an aftereffect of the bar and if one appeared, gauge its onset. To measure the timing of the aftereffect, we displayed a comparison spot (0.023 deg diameter, 0.8 cd/m2) 1.8 deg to the left and 1.9 deg below the fixation point. The onset of the comparison spot was randomized in 50 ms increments over the range of 0 - 700 ms relative to the offset of the bar. Subjects were asked to press the left arrow key if an aftereffect appeared before the comparison spot, the right arrow key if an aftereffect appeared after the comparison spot, and make no response if no aftereffect was seen (this was uncommon after training).
The intertrial interval was 750 ms. In each block of trials, subjects saw each of the 15 randomized comparison spot onset times, 5 times. Each subject performed 3 blocks of trials separated by rest times of variable length (225 total trials). All blocks were performed in a single session and the subjects stayed adapted to the experimental room light level.
For each observer and for each onset time of the comparison spot, we computed the percentage of responses that a subject said the aftereffect appeared later than the comparison spot. Error bars show the standard error of the mean across the 3 blocks of trials.
Results
We recorded from isolated neurons in the primary visual cortex of two awake macaque monkeys. The visual stimulus was a bar of light presented on a uniform gray background with a luminance of 8.6 cd/m2. The stimulus bar had the neuron’s preferred orientation and was centered in its receptive field (RF). At stimulus offset, the stimulus bar was turned off simultaneously with a change from gray to black background (0.02 cd/m2) (Figure 1A). Figure 1B shows a raster plot and post-stimulus time histogram (PSTH) for a typical V1 neuron. In the raster plot, each short bar represents an action potential. Action potentials are aligned relative to the stimulus offset (time zero). The small red square at the beginning of each trial indicates the stimulus onset time. After stimulus offset (the gray vertical line), this neuron showed a transient off response lasting for ~150 ms, followed by a period with low activity; starting about 450 ms after stimulus offset there was a strong long-lasting rebound of activity.
To quantify the rebound, we had monkeys maintain fixation for 1000 or 1500 ms after stimulus offset (1500 ms in this example). Across the population of neurons studied, we found that the rebound activity started in the range of 350~500 ms after stimulus offset and typically lasted for about 600 ms.
Correlation between rebound activity and stimulus features
To examine the relationship between the visual response and rebound activity, we varied stimulus contrast and orientation. We first found that the magnitude of the rebound activity correlated with the contrast between the stimulus bar and the gray background. As contrast increased (by varying bar luminance), the magnitude of the visual response was higher and so was the rebound activity (Figure 2). Figure 2A shows the averaged normalized PSTHs from a population of 27 neurons. The magnitude and duration of the rebound activity increased as the contrast increased. At contrast levels of 0.77 and 0.84, an additional early “rebound” was found about 200 ms after stimulus offset. Figure 2B shows the averaged firing rates of the visual responses calculated from 0 to 500 ms after stimulus onset (red) and the rebound activity calculated from 500 to 1000 ms after stimulus offset (black). It appears that the magnitude of the rebound activity follows that of the visual response. It is interesting to note that somewhat higher contrast was required for rebound activity than for the initial visual response. For example, at a contrast of 0.37 there was a visual response, but activity in the rebound-time interval was not different from baseline (Wilcoxon signed rank test, P = 0.21).
Figure 2.

Effect of stimulus contrast on neural activity. A. Averaged normalized PSTHs of 27 neurons in response to a stimulus bar with different luminance contrasts. The magnitude and duration of the rebound activity increased as contrast increased. At contrast levels of 0.77 and 0.84, an additional early activity peak was found about 200 ms after stimulus offset. Responses are aligned at stimulus offset. B. Mean visual responses calculated 0 to 500 ms after stimulus onset (red symbols) and mean rebound activity calculated 500 to 1000 ms after stimulus offset (black symbols). Both visual responses and rebound activity increased with contrast. Mean spontaneous activity across the 27 neurons is indicated by the dashed line.
We found that the rebound activity also correlated with stimulus bar orientation. The orientation tuning curves from four V1 neurons are shown in Figure 3. The red curve is based on the visual response and the black curve is based on rebound activity. For three of these four neurons, sensitivity to orientation in the rebound activity was similar to orientation tuning in the visual response; the fourth neuron showed somewhat different orientation sensitivity in rebound and visual activity. Figure 4 shows, for 58 neurons, the frequency distribution of the absolute difference between the preferred orientations calculated based on the visual response and the rebound activity. The distribution has a peak close to 0 degree and declines in frequency as the difference between the preferred orientations increases from 0 to 90°. This result indicates that the orientation preferences based on visual and rebound activity are generally similar with some mismatches.
Figure 3.

Effect of stimulus orientation on visual response and rebound activity. Red curves show orientation tuning functions for four V1 neurons based on the visual response 0 - 500 ms after stimulus onset. Black curves show the dependence of rebound activity (500-1000 ms after stimulus offset) on stimulus orientation. Error bars show standard errors.
Figure 4.
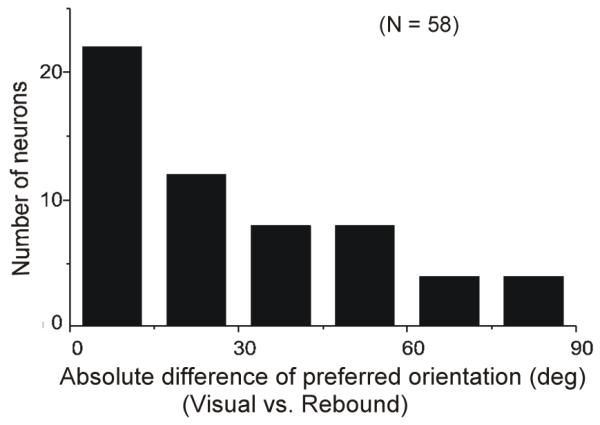
Correlation between preferred orientations in rebound activity (500-1000 ms after stimulus offset) and visual response (0-500 ms after stimulus onset). Most neurons showed similar orientation sensitivity in the two epochs.
In both the contrast and orientation manipulations, the rebound activity correlates well with stimulus contrast and orientation, apparently reflecting the strength of the visual response.
Rebound activity depends on background size
The apparent dependence of rebound strength on the magnitude of the preceding visual response suggests that the rebound could originate anywhere in the visual pathway from retina to V1. However, we have found that the rebound depends on the size of the background at a scale that suggests a post-retinal contribution. Instead of using a full-screen background changing from gray to black, we used a gray disk surrounding the stimulus bar and turned this disk to black at bar offset. The region beyond the disk was always black. We varied the gray disk size from 2.6° to 15.5° in diameter (Figure 5A). With a diameter of 2.6° (black line in Figure 5B), the rebound activity was significantly weaker than with larger disk diameters (Wilcoxon signed rank test, P = 0.01), but the visual response was not significantly different (Wilcoxon signed rank test, P = 0.44). Both the visual response and the rebound activity were not significantly affected by increases in background disk size beyond 5.9° (Figure 5C).
Rebound activity and background offset
We found that the occurrence and the strength of the rebound activity were critically dependent on the background offset. Figure 6A and B show results from a representative neuron. When the stimulus bar was switched off simultaneously with a background offset, clear rebound activity was observed (Figure 6A). However, when the stimulus bar was turned off without a background offset (the background was kept at the same luminance level as before the stimulus bar offset), the rebound activity was much weaker or absent (Figure 6B). We observed this correlation between the rebound activity and the background offset in 16 of 16 neurons studied with long (> 1s) fixation after stimulus offset. In a larger sample of 105 neurons collected when fixation was only required for 500 ms after stimulus offset, it was also clear that rebound activity was dependent on the background offset. The rebound activity was found when there was a background offset (Figure 7, black curve) and was absent when the background was kept unchanged (Figure 7, gray curve). Prior to the beginning of rebound activity, the response with background offset also appeared suppressed compared with no background offset (Figure 7).
Figure 7.
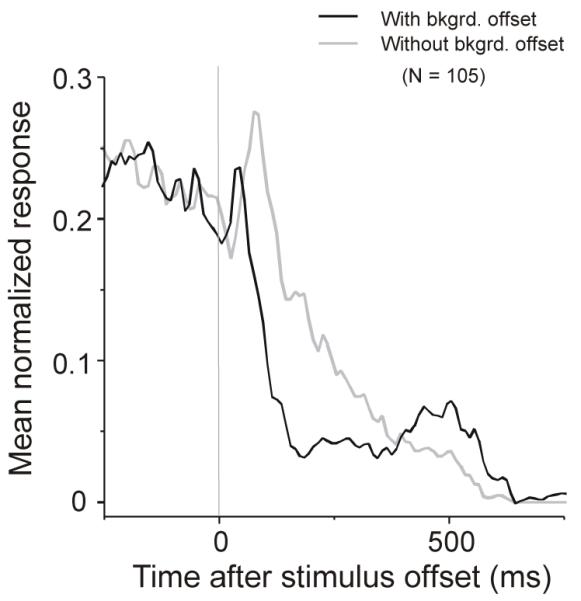
Averaged normalized activity of 105 neurons to offset of an optimally oriented bar with and without background offset. Rebound activity was found with background offset (black curve) but not when the background was static gray (gray curve). Prior to the beginning of the rebound activity, the response with the background offset appeared suppressed compared to the response without background offset. This data set of 105 neurons was collected when fixation was only required for 500 ms after stimulus offset.
One possible reason why there is rebound activity when the background changes from gray to black, but not when it stays gray, is temporal contrast. In the gray-to-black situation, the white bar makes a high contrast transition to black. However, the white bar is followed by a lower contrast transition to gray if the background does not change. To determine whether a difference in temporal contrast underlies the activity difference between Figure 6A and B, we included a control condition in which the temporal contrast was high but the background did not change (i.e. the background was always black). Figure 6C shows the response of a neuron in the standard gray-to-black condition and Figure 6D shows the response of the same cell when the background is static black (the temporal contrast of bar offset was the same as that when there was a gray-to-black background change in Figure 6C). When the stimulus bar was shown on a black background, the visual response was much stronger than with the gray background. This is consistent with the higher contrast in the black background condition. However, with the black background, there was little if any rebound activity around 500 ms (Figure 6D). There was short-delayed rebound activity with the black background, which we typically observed when the stimulus bar contrast was higher than 75% (Figure 2A). These findings were consistent across 26 neurons tested with the stimulus bar presented on a black background. Therefore, when there was no background offset, the disappearance of the long-delayed rebound activity cannot be explained by reduced temporal contrast at stimulus bar offset. We conclude from Figures 6 and 7 that background offset is critical for the occurrence of the rebound activity. However, background change alone was not sufficient: without a stimulus bar (zero contrast condition shown in Figure 2), no rebound activity was found.
The effect of background offset step size
We have shown that rebound activity is much more pronounced when the background changes from 8.6 to 0.02 cd/m2 than when the background is fixed at 8.6 cd/m2. In a subset of 16 neurons we varied the size of the offset step by setting background luminance to different levels at stimulus bar offset. Figure 8 shows that little or no rebound activity was observed when background luminance was changed from 8.6 to 4.8 or 2.6 cd/m2, or kept fixed at 8.6 cd/m2. Consistent with the result shown in Figure 7, the neuronal activity shortly after the stimulus offset was weaker (e.g. dip in red curve around 200 ms), as the decrement step of the background luminance change was larger (Figure 8). For 8 neurons we also tried increases (8.6 cd/m2 to 19.0 or 37.9 cd/m2) rather than decreases in background luminance at stimulus bar offset. No rebound activity was found with these background luminance increases (data not shown).
Figure 8.
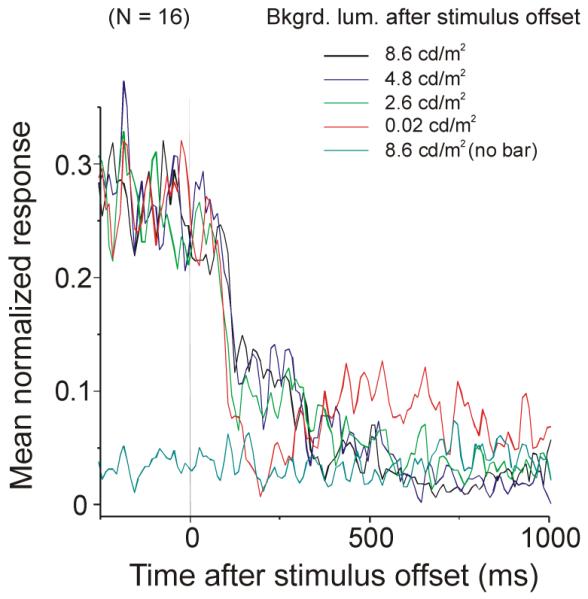
Rebound activity and background offset step size. Averaged normalized PSTHs of 16 neurons with different background offset step sizes. Rebound activity is pronounced when the background changes from 8.6 to 0.02 cd/m2 (red curve). Little or no rebound activity was observed when background luminance was changed from 8.6 to 4.8 or 2.6 cd/m2, or kept fixed at 8.6 cd/m2.
Human aftereffects
Curious as to possible perceptual consequences or correlates of the rebound activity in V1, we had human subjects perform a psychophysical experiment. We tested specifically for an aftereffect under the conditions and with the temporal parameters of the rebound activity we observed in macaque V1. Using stimuli similar to those used in the physiology lab, human subjects saw a white bar on a gray background for 550 ms. The bar and gray background were simultaneously extinguished leaving the screen black. Using a comparison technique (see Methods), subjects estimated the onset time of a visual aftereffect, if one was seen. Subjects generally saw an aftereffect that was first perceived when the bar was turned off. They were instructed to ignore this immediate aftereffect and wait to see if a delayed aftereffect appeared. Although all subjects reported to see the aftereffect, there were inter-subject differences: for some subjects, practice was required to see this effect, which was weaker than the common and immediate aftereffect; for other subjects, the aftereffect was easy to see. With practice, a delayed aftereffect was consistently reported by all subjects and experiments were begun to quantify the timing of the aftereffect.
Subjects performed a 2AFC task and reported whether the aftereffect occurred earlier or later than a comparison spot that appeared after the stimulus offset at a range of randomized delays. In the initial experiments, binocular viewing was used. Figure 9 summarizes data for 4 subjects. The abscissa shows the times at which the comparison spot appeared after the bar stimulus was turned off. The ordinate shows the percentage of responses in which the subject reported an aftereffect occurred after the comparison spot appeared. At short comparison spot onset times (less than 100 ms), the subjects reported that the aftereffect appeared later than the comparison spot - the “later responses” are near 100%. At long comparison spot onset times (longer than 500 ms), the subjects reported that the aftereffect appeared earlier than the comparison spot - the “later responses” are near 0%; The average data cross the 50% “later” response line (i.e. half responses “earlier” and half “later”) at an onset time of 300 ms. This indicates that, on average, the aftereffect appears at the same time as a spot displayed 300 ms after stimulus offset.
Figure 9.

Timing of a delayed aftereffect in humans. Subjects indicated whether the aftereffect, perceived with simultaneous bar and background offset, appeared before or after a comparison spot presented at different times. When the comparison spot was presented shortly after stimulus offset, subjects reported that the aftereffect was seen later than the comparison spot (left side of graph). At 300 ms after stimulus offset, 50% of the subjects’ responses said the aftereffect was earlier or later than the comparison spot. The data are averaged over 4 subjects and error bars show standard errors.
In a follow-up experiment, we used dichoptic rather than binocular viewing. We reasoned that if the aftereffect originated early in the visual pathway, before binocular integration, it should only occur if the stimuli were presented to the same eye. To investigate this point, the experiment was repeated, largely with the same parameters as the binocular version. The setup was altered so that separate left eye and right eye displays appeared on the two sides of the CRT. A mirror haploscope was used for dichoptic presentation. Three conditions were randomly interleaved: in one condition, the gray background and white bar were presented to both eyes (same as binocular experiment); in the second and third conditions, the gray background was presented to one eye (left or right) and the white bar on a black background to the other eye. We do not show data from the dichoptic experiment because subjects never saw a delayed aftereffect unless the gray background and white background were shown to the same eye (i.e. the standard binocular situation).
Discussion
We have observed a form of rebounding activity in V1 associated with stimulus offset, which to our knowledge has not been previously reported. After a white bar stimulus is turned off, V1 activity rapidly declines. But starting 350-500 ms after offset, the activity rapidly increases, remaining elevated for about 600 ms. To observe the rebound it was essential that the gray background behind the white bar was turned off with the bar. We have not yet examined how critical the temporal alignment is of bar and background offset, but the rebound was not seen if the background was static gray or black. With a simultaneous background offset, the rebound activity only occurred when the stimulus bar contrast was greater than a minimum value (Michelson contrast threshold at ~0.4). This contrast threshold is lower than the high stimulus contrast typically used in the literature to evoke long-lasting afterimages. Variations of stimulus contrast and orientation indicate that the magnitude and duration of the activity rebound correlate with the strength of the preceding visual response.
In psychophysics experiments, we tested whether human subjects saw any delayed aftereffect following the stimulus offset. Under similar stimulus conditions, subjects reported seeing a delayed aftereffect that began about 300 ms after bar offset, in approximate agreement with the macaque physiology. Just as in the physiological experiments, if the background change did not occur with bar offset, no aftereffect was observed. Our physiology and psychophysics results suggest a neural correlate of a new delayed aftereffect.
Neural dynamics after stimulus offset
Whereas neural activity in visual cortex after stimulus onset has been studied extensively, neural activity after stimulus offset received relatively little attention. Of course, it has been recognized since early physiological studies of the retina and cortex that neurons sometimes give off responses. But an off response generally refers to activity immediately after stimulus offset. Our physiological results demonstrate the existence of rich neural dynamics well after the off response and a period of quiescence.
In a sense, the effect we have observed after stimulus offset is consistent with previous findings from our lab examining activity after stimulus onset. We have found that V1 response patterns to a bar stimulus are fundamentally altered by background changes in luminance or texture (Huang and Paradiso, 2005). In particular, it appears that background changes and bar onset produce transient inhibition that delays the response of some V1 neurons and splits the response of others into two peaks. A role for inhibition is consistent with earlier intracellular studies showing that electrical stimulation of the visual afferents produce a stereotypical pattern of immediate excitation followed by powerful inhibition and eventually a return to excitation (Douglas & Martin, 1991). In the present study, we again observed a significant effect on the V1 response when a stimulus and background change occurred simultaneously. The simultaneous offset of a bar stimulus and a uniform background caused activity suppression followed by a stereotyped activity rebound (Figure 7).
Possible mechanisms of the rebound activity
The neural mechanisms of the rebound activity are currently unclear. However, both the physiological and psychophysical data provide clues. We found that rebound activity is sensitive to the size of the gray background area in the range of 3 - 5° (gray patch diameter). Moreover, the level of suppression prior to the activity rebound (e.g. 0 - 500 ms in Figure 5B) is influenced by the size of the gray background up to 15.5° (the largest size used). These spatial scales are much greater than retinal ganglion cell receptive fields in monkeys (Hubel & Wiesel, 1960; De Monasterio & Gouras, 1975), which have centers ranging from 0.06 - 0.5° at eccentricities of 3 - 6° (as in our experiments). While conceivably there might be center-surround retinal or thalamic interactions over a spatial scale of several degrees associated with rebound activity, the spatial range of cortical interactions seems more appropriate.
Several lines of evidence suggest that the delayed aftereffect and activity rebounds may originate prior to V1. If the delayed visual aftereffect is related to the activity rebound found in V1, it is important that the aftereffect disappears when the gray background offset and white bar offset occur in different eyes. Evidently, the bar-background interaction occurs at a monocular stage of visual processing, likely prior to V1. Perhaps the spatial scale of interactions seen physiologically demonstrates further response modulation by V1 circuitry.
In studying backward masking in cat lateral geniculate nucleus (LGN), Schiller (1968) noted that, in response to an intense stimulus, some ON-center LGN neurons show “after-discharges” shortly after stimulus offset, followed by a relatively silent period and then another bout of delayed “after-discharges” (bottom panel of Figure 1 in Schiller 1968). The delayed “after-discharges” appear about 500 ms after the end of the initial “after-discharges”. Though the activity-quiescence-activity pattern observed in LGN is reminiscent of our V1 data, it is not clear that the delayed “after-discharges” observed in LGN correlate with stimulus parameters or depend on simultaneous background offset as in V1.
Following a visual stimulus, some LGN neurons show suppression lasting 200~500 ms and a short excitatory burst (rebound) (Nelson, 1991). Two types of suppression in LGN have been distinguished (Nelson, 1991): “paired-pulse suppression” and “offset suppression”. Paired-pulse suppression refers to a suppression of the response to a subsequent visual stimulus following a visual stimulus and it usually lasts less than 200 ms and is more pronounced for large stimuli. Offset suppression is a suppression of spontaneous activity following a visual stimulus, it usually lasts for 500 ms or more, and it does not appear to depend on surround stimulation. The size dependency of the V1 rebound activity we observed seems to be consistent with the paired-pulse suppression in LGN; however, the latency of the rebound activity in V1 appears to be consistent with the offset suppression in LGN. It is conceivable that the rebound activity found in V1 may be due to further integration of the different types of suppressive and rebounding signals in LGN, but it might be something altogether different. Orientation sensitivity in the V1 activity rebound supports the speculation that V1 circuitry is involved in shaping the activity rebound. Future recordings from cortical afferents with our experimental paradigm will help to identify the origin and the transformation of the signals that contribute to the activity rebound.
Functional implications
The rather peculiar phenomenon of a delayed aftereffect following the offset of a visual scene may occur in our daily life. In some situations, local and global stimuli are simultaneously extinguished. For instance, when room lights are turned off at night, some of the authors have noted that, after a brief darkening of the whole visual field, they sometimes perceive a reappearance of the salient features in the previous visual scene. Another scenario in which a delayed aftereffect may occur is when we close our eyelids during blinks. The whole visual scene darkens during the blink, which resembles the simultaneous stimulus and background offset. Some of the authors have noted an aftereffect while eyes are quickly closed. A visual aftereffect during blinks might serve to temporarily preserve a memory trace of the previous visual scene and extend the visual processing time of a briefly viewed visual image.
Abnormal persistence or recurrence of visual images after stimulus offset can occur in a pathological condition called palinopsia (Bender, Feldman & Sobin, 1968; Meadows & Munro, 1977). The mechanisms of palinopsia are unclear but there are suggestions that it may have a cortical origin in occipito-temproal cortex (Norton & Corbett, 2000) or in parietal cortical projections to the occipital cortex (Santhouse et al., 2002). Studying neural dynamics after stimulus offset and the neural signals that contribute to visual aftereffects may offer insights for understanding vision in normal, as well as in diseased states. Our paradigm of using a simultaneous background and center stimulus offset offers an opportunity to look into the rich neural dynamics following the removal of visual stimuli.
Acknowledgments
This research was supported by the National Eye Institute and the NSF CRCNS program. The authors wish to thank Aaron Gregoire, Ben Liotta, and Amber Pierce for technical assistance.
Footnotes
Commercial relationships: none.
Contributor Information
Xin Huang, Department of Neuroscience, Brown University Providence, RI, USA.
Samuel Levine, Department of Neuroscience, Brown University Providence, RI, USA.
Michael A. Paradiso, Department of Neuroscience, Brown University Providence, RI, USA
References
- Bender MB, Feldman M, Sobin AJ. Palinopsia. Brain. 1968;91(2):321–338. doi: 10.1093/brain/91.2.321. [DOI] [PubMed] [Google Scholar]
- Brainard DH. The Psychophysics Toolbox. Spat Vis. 1997;10(4):433–436. [PubMed] [Google Scholar]
- De Monasterio FM, Gouras P. Functional properties of ganglion cells of the rhesus monkey retina. J Physiol. 1975;251(1):167–195. doi: 10.1113/jphysiol.1975.sp011086. [DOI] [PMC free article] [PubMed] [Google Scholar]
- Douglas RJ, Martin KA. A functional microcircuit for cat visual cortex. J Physiol. 1991;440:735–769. doi: 10.1113/jphysiol.1991.sp018733. [DOI] [PMC free article] [PubMed] [Google Scholar]
- Huang X, Paradiso MA. Background changes delay information represented in macaque V1 neurons. J Neurophysiol. 2005;94(6):4314–4330. doi: 10.1152/jn.01309.2004. [DOI] [PubMed] [Google Scholar]
- Hubel DH, Wiesel TN. Receptive fields of optic nerve fibres in the spider monkey. J Physiol. 1960;154:572–580. doi: 10.1113/jphysiol.1960.sp006596. [DOI] [PMC free article] [PubMed] [Google Scholar]
- Meadows JC, Munro SS. Palinopsia. J Neurol Neurosurg Psychiatry. 1977;40(1):5–8. doi: 10.1136/jnnp.40.1.5. [DOI] [PMC free article] [PubMed] [Google Scholar]
- Nelson SB. Temporal interactions in the cat visual system. II. Suppressive and facilitatory effects in the lateral geniculate nucleus. J Neurosci. 1991;11(2):357–368. doi: 10.1523/JNEUROSCI.11-02-00357.1991. [DOI] [PMC free article] [PubMed] [Google Scholar]
- Norton JW, Corbett JJ. Visual perceptual abnormalities: hallucinations and illusions. Semin Neurol. 2000;20(1):111–121. doi: 10.1055/s-2000-6837. [DOI] [PubMed] [Google Scholar]
- Pelli DG. The VideoToolbox software for visual psychophysics: transforming numbers into movies. Spat Vis. 1997;10(4):437–442. [PubMed] [Google Scholar]
- Santhouse AM, Ffytche DH, Howard RJ, Williams SC, Stewart AL, Rooney M, et al. The functional significance of perinatal corpus callosum damage: an fMRI study in young adults. Brain. 2002;125(Pt 8):1782–1792. doi: 10.1093/brain/awf174. [DOI] [PubMed] [Google Scholar]
- Schiller PH. Single unit analysis of backward visual masking and metacontrast in the cat lateral geniculate nucleus. Vision Res. 1968;8(7):855–866. doi: 10.1016/0042-6989(68)90135-1. [DOI] [PubMed] [Google Scholar]