

Abstract
Angiotensin II plays an important role in the regulation of blood pressure, body salt and fluid balance, and urine concentration. Mice with deletion of the AT1a receptor develop polyuria and urine concentration defects. We studied the mechanisms of these urine concentration defects by treating wild-type and AT1a-knockout mice with arginine vasopressin (AVP) for 2 weeks, controlling their water intake, or giving them an osmotic diuretic (sucrose) in order to determine whether central or nephrogenic mechanisms were involved. Under basal conditions, AT1a-knockout mice were hypotensive, had lower plasma AVP, and excreted more urine with a markedly reduced osmolality compared with wild-type mice. However, basal glomerular filtration rates were similar in both strains of mice. We isolated total lysate and membrane proteins from the inner medulla of wild-type and mutant mouse kidneys, and found that the amounts of aquaporin 2 (AQP2), adenylyl cyclases III and V/VI, and phosphorylated MAP kinases ERK 1/2 proteins were all reduced in the inner medulla of the knockout mice. Infusion of AVP raised plasma levels and blood pressure proportionally in both strains, but polyuria persisted and urine osmolality remained significantly lower in the knockout mice. Although AVP increased urine osmolality slightly in water-deprived knockout mice, this was well below the basal osmolality of wild-type mice. The diuretic response to the hyperosmotic sucrose was also impaired in the knockout mice. Neither AVP nor water rationing restored the levels of the inner medullary signaling proteins and membrane AQP2 proteins in the knockout mice. We suggest that AT1a receptor deletion causes polyuria and urine concentration defects by decreasing basal AVP release and impairing AVP-induced receptor signaling in the inner medulla.
Keywords: angiotensin II, arginine vasopressin, inner medulla, kidney, osmolality, receptor signal transduction
An important role of angiotensin II (Ang II) in the physiological regulation of blood pressure, body salt and fluid balance, and urine concentration is now well-recognized in mice with genetic deletion of one of the major components of the renin—angiotensin system. Elimination of genes encoding renin, angiotensinogen,1,2 angiotensin I-converting enzyme, which coverts Ang I to biologically active Ang II,3 or entire AT1 receptors4 leads to the development of hypotension, structural abnormalities in the renal papilla, and polyuria with reduced urine osmolality. Structural defects in the papilla of the inner medulla (IM) are thought to be the major contributing factors to polyuria and reduced urine osmolality in these animals.1,3,4 Surprisingly, the deletion of AT1a receptors alone in mice did not result in structural abnormalities in the renal papilla.5,6 Yet AT1a-knockout (KO) mice still excrete two to fourfold more urine with a significantly reduced osmolality than wild-type (WT) mice.5,6 These abnormal phenotypes strongly suggest functional, rather than structural, defects in urine concentrating mechanisms in AT1a-KO mice.
Although polyuria with reduced urine osmolality has been reported in AT1a-KO mice, the mechanisms responsible for these defects have not been investigated earlier. Urine concentration in the IM of the kidney, collecting ducts by implication, is regulated by both central and renal mechanisms; namely (1) release of arginine vasopressin ([Arg8]-AVP) from the hypothalamic neurohypophyseal tract;7 (2) water intake regulated by central thirst mechanisms;8 (3) integrity of inner medullary structures; (4) expression of type 2 receptors (V2) in collecting ducts;9 and (5) responses of collecting ducts to AVP-activated V2 receptor signaling.10,11 Ang II, through the activation of AT1a and AT1b receptor signaling, plays an important role in regulating AVP release from the hypothalamic neurohypophyseal tract and cross-talks with V2 receptor signaling in the collecting ducts.7,8,12 Thus, the development of polyuria with markedly reduced urine osmolality in AT1a-KO mice may be because of central defects in AVP release (central diabetes insipidus), thirst mechanisms (primary polydipsia), or to renal tubular defects in concentrating urine (nephrogenic diabetes insipidus).
This study tested the hypothesis that the development of polyuria and urine concentration defects in AT1a-KO mice is due to the deletion of the AT1a receptors and their signaling transductions that regulate basal [Arg8]-AVP release and V2 receptor signaling (A-cyclase (AC)-III and AC-V/VI), and the expression of membrane aquaporin 2 (AQP2) proteins in the IM of the kidney.
RESULTS
Systemic and renal responses to [Arg8]-AVP infusion or 24-h water ration in WT and AT1a-KO mice
Table 1 shows that basal systolic pressure and plasma [Arg8]-AVP were significantly lower in AT1a-KO than in WT mice (P<0.01). Infusion of [Arg8]-AVP for 2 weeks increased the systolic pressure proportionally in both strains (P<0.01 vs controls). Plasma [Arg8]-AVP levels were also increased similarly by [Arg8]-AVP infusion in both strains (P<0.01 vs controls). 24-h water ration did not alter plasma [Arg8]-AVP in WT, but it increased plasma AVP levels in AT1a-KO mice (P<0.01). Under the same condition that all mice had free access to water, basal 24-h water intake and urine excretion was >3 times higher in AT1a-KO than in WT mice (P<0.01). [Arg8]-AVP infusion reduced 24-h urine and sodium excretion in both strains (P<0.01), but it did not restore these responses in AT1a-KO mice compared with those of WT mice. 24-h water ration failed to restore 24-h urine and electrolyte responses in AT1a-KO mice to the levels of WT mice.
Table 1.
Basal 24-h water intake and renal excretory indexes and their responses to 2-week [Arg8]-AVP infusion or 24-h water ration in wild-type (WT) and AT1a-KO mice
| WT |
AT1a-KO |
|||||
|---|---|---|---|---|---|---|
| Parameters | Control | [Arg8]-AVP | 24-h water ration | Control | [Arg8]-AVP | 24-h water ration |
| Body wt. (g) | 23.8±0.5 | 21.4±0.5 | 23.5±1.0 | 24.7±0.9 | 22.4±0.4 | 22.2±1.0 |
| SBP (mm Hg) | 122±6 | 149±5** | 118±8 | 94±5 | 123±8**†† | 90±6†† |
| Plasma AVP (pmol/l) | 115.3±18.4 | 215.8±36.2** | 113.7±11.6 | 38.1±12.9## | 129.1±12.8**†† | 81.2±11.9**†† |
| Kidney wt. (g) | 0.35±0.03 | 0.34±0.02 | 0.34±0.02 | 0.27±0.02## | 0.27±0.02†† | 0.26±0.02†† |
| Kidney to body wt. ratio (x 100) | 1.26±0.06 | 1.49±0.04** | 1.31±0.03 | 1.13±0.06# | 1.20±0.08†† | 1.17±0.07†† |
| Water intake (ml/24 h) | 3.8±0.2 | 2.8±0.2** | 4.0±0.2 | 10.7±1.3## | 6.5±0.8*†† | 4.0±0.2 |
| Urine output (ml/24 h) | 1.51±0.10 | 0.62±0.08** | 1.56±0.11 | 5.33±0.73## | 1.93±0.64**† | 3.58±0.45†† |
| UNaV (μmol/24 h) | 224.4±6.3 | 170.7±8.6* | 208.3±10.5 | 273.9±6.5# | 102.8±7.0**† | 151.6±18.2† |
| UKV (μmol/24 h) | 491.6±13.3 | 387.8±18.3 | 466.2±20.3 | 506.2±9.6 | 210.1±14.2**†† | 367.5±21.3† |
[Arg8]-AVP, arginine vasopressin; KO, knockout; SBP, systolic blood pressure; UNaV, urinary sodium excretion; UKV, urinary potassium excretion; wt., weight.
Values are means±s.e.
P<0.05
P<0.01 vs their WT or AT1a-KO controls.
P<0.05
P<0.01 vs WT controls.
P<0.05
P<0.01 vs the corresponding group of WT mice treated with [Arg8]-AVP or with 24-h water ration.
Basal glomerular filtration rate and inner medullary structures of WT and AT1a-KO mice
Basal glomerular filtration rates (GFR), as determined by the fluorescein isothiocyanate-inulin clearance technique,13 were not significantly different in conscious age and body weight-matched male WT and AT1a-KO mice (Table 2). There were also no striking differences in inner medullary structures between WT and AT1a-KO mice at low-power microscopic visualization (Figure 1). No papillary malformation, atrophy or fibrosis was observed in AT1a-KO mice. Total inner medullary proteins, as normalized to their kidney weights, were comparable between WT and AT1a-KO mice (Table 2).
Table 2.
Basal glomerular filtration rate (GFR), total kidney weights and inner medullary proteins, and the innermedullary-protein-to-kidney-weight ratio in age and body weight—matched male wild-type (WT) and AT1a-KO mice
| Parameter | WT | AT1a-KO |
|---|---|---|
| GFR (μl/min) | 134.9±40.9 | 130.6±17.2 |
| Total kidney wt. (mg) | 350±20 | 270±25* |
| Total inner medullar proteins (mg) | 12.6±0.5 | 9.9±0.4* |
| Inner medulla protein/kidney wt. ratio, (x 100) | 3.6±0.3 | 3.7±0.5 |
FITC, fluorescein isothiocyanate; GFR, Glomerular filtration rate, KO, knockout; wt., weight.
Glomerular filtration rate was determined in conscious wild-type and AT1a-KO mice using the FITC-labeled inulin method.13
P<0.05 vs wild-type mice, unpaired t-test.
Figure 1. Anatomical and low-power microscopic visualization of cortical and inner medullary structures of WT and AT1a-knockout (KO) mice.

(a) A representative midline cross section of a WT kidney. (b) A representative midline cross section of an AT1a-KO kidney. (c) A representative low-power micrograph of a WT kidney showing the papilla tip of the inner medulla. (d) A representative low-power micrograph of an AT1a-KO kidney showing the papilla tip of the inner medulla. Kidney sections were stained with hematoxylin and eosin. WT, wild type.
Effects of [Arg8]-AVP infusion or 24-h water ration on plasma and urine osmolality
Basal plasma osmolality was not statistically different (WT: 323±11 vs AT1a-KO: 315±7 mOsm per kg H2O; NS) (Figure 2). However, urine osmolality was markedly reduced in AT1a-KO mice (WT: 2227±95 vs AT1a-KO: 1004±137 mOsm per kg H2O; P<0.01). In response to [Arg8]-AVP infusion for 2 weeks, WT mice maintained plasma osmolality at the control level (326±14 mOsm per kg H2O, NS). By contrast, plasma osmolality was decreased in AT1a-KO mice (288±12 mOsm per kg H2O; P<0.01 vs controls) (Figure 2). Although urine osmolality was increased by [Arg8]-AVP infusion in both strains, it remained remarkably reduced in AT1a-KO mice (WT: 3937±268 vs AT1a-KO: 1893±349 mOsm per kg H2O; P<0.01) (Figure 2). 24-h water ration increased plasma osmolality in AT1a-KO mice (338±10 mOsm per kg H2O, P<0.05 vs controls), but it did not restore urine osmolality to the WT level (WT: 2044±86 vs AT1a-KO: 948±148 mOsm per kg H2O, P<0.01).
Figure 2. Basal plasma and urine osmolality and their responses to 2-week infusion of arginine vasopressin ([Arg8]-AVP) or 24-h water ration (WR) in wild-type (WT) and AT1a-KO mice.

*P<0.05 or **P<0.01 vs respective WT or AT1a-KO controls; +P<0.05 or ++P<0.01 vs WT controls, [Arg8]-AVP-treated, or 24-h water-rationed WT mice. AVP, arginine vasopressin.
Urine osmolality responses to acute [Arg8]-AVP administration in water-deprived WT and AT1a-KO mice
Water deprivation (WD) for 16 h significantly reduced urine excretion in both WT (basal: 1.4±0.2 ml vs WD: 0.6±0.1 ml, P<0.01) and AT1a-KO mice (basal: 4.8±0.8 ml vs WD: 2.1±0.3 ml, P<0.01). Figure 3 shows that urine osmolality was markedly increased in WT (basal: 1767±183 mOsm per kg H2O vs WD: 3049±275 mOsm per kg H2O, P<0.01), but not in AT1a-KO mice (basal: 976±71 mOsm per kg H2O vs WD: 1195±101 mOsm per kg H2O, NS). Subsequent administration of [Arg8]-AVP did not significantly increase urine osmolality in WT mice (AVP: 3539±309 mOsm per kg H2O, NS vs WD). Although [Arg8]-AVP induced a 16% increase in urine osmolality in water-deprived AT1a-KO mice (AVP: 1391±168 mOsm per kg H2O), the increase was not statistically different from that induced by WD. However, AVP did increase the urine osmolality significantly above the basal level in AT1a-KO mice (Figure 3).
Figure 3. Urine osmolality responses to acute administration of arginine vasopressin ([Arg8]-AVP) in water-deprived wild-type (WT) (n=6) and AT1a-KO mice (n=9).
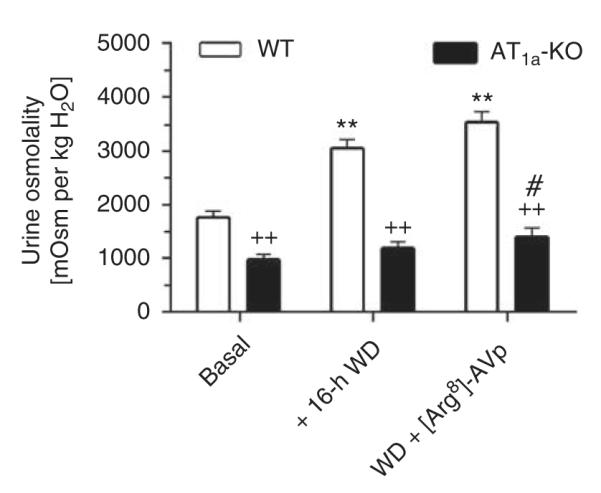
All mice were water-deprived for 16 h before [Arg8]-AVP was administered (100 ng per mouse, i.p.). **P<0.01 vs WT basal values. ++P<0.01 vs corresponding WT values. #P<0.05 vs basal values in AT1a-KO mice. WD, water deprivation.
[125I]-V2 receptor binding in the IM
[125I]-V2 receptor binding in the IM was increased in the IM of AT1a-KO mice (WT: 139±8 dpm/mm2 vs AT1a-KO: 170±6 dpm/mm2; P<0.05) (Figure 4). Infusion of [Arg8]-AVP for 2 weeks decreased V2 receptor binding similarly in the IM of WT and AT1a-KO mice (WT: 88±7 vs AT1a-KO: 72±6 dpm/mm2, NS) (Figure 4).
Figure 4. Specific [125I]-V2 receptor binding in the inner medulla (IM) of wild-type (WT) and AT1a-KO mice, as determined by quantitative in vitro autoradiography.

(a) A representative [125I]-V2 receptor autoradiograph in a control WT kidney. (b) A representative [125I]-V2 receptor autoradiograph in an AT1a-KO kidney. (c) A representative [125I]-V2 receptor autoradiograph in an AVP-infused WT kidney. (d) A representative [125I]-V2 receptor autoradiograph in an AVP-infused AT1a-KO kidney. **P<0.01 vs their respective WT or AT1a-KO mice controls. ++P<0.01 vs WT controls. AVP, arginine vasopressin.
Effects of [Arg8]-AVP infusion or 24-h water ration on lysate and membrane AQP2 proteins in the IM
Under basal conditions, lysate AQP2 proteins in the IM of AT1a-KO mice were <30% of WT mice (WT: 0.72±0.08 vs AT1a-KO: 0.21±0.05 AQP2/Actin ratio, P<0.01) (Figure 5). [Arg8]-AVP significantly increased lysate AQP2 proteins in both strains (WT: 1.56±0.23 vs AT1a-KO: 1.33±0.16 AQP2/Actin ratio, P<0.01 vs controls). However, 24-h water ration did not restore lysate AQP2 protein levels in AT1a-KO mice to those of WT mice (WT: 1.33±0.21 vs AT1a-KO: 0.82±0.25 AQP2/Actin ratio, P<0.01) (Figure 5). Figure 6 further shows that [Arg8]-AVP increased inner medullary membrane AQP2 proteins by ~62% in WT mice (control: 0.53±0.06 vs [Arg8]-AVP: 0.86±0.08 AQP2/Actin ratio, P<0.01), but by only 10% in AT1a-KO mice (control: 0.18±0.05 vs [Arg8]-AVP: 0.20±0.04 AQP2/Actin ratio, NS). The 24-h water ration had no significant effect on inner medullary membrane AQP2 proteins in AT1a-KO mice (Figure 6).
Figure 5. Semiquantitative immunoblots of lysate aquaporin 2 (AQP2) proteins in wild-type (WT) and AT1a-KO mice under basal conditions or after 2-week infusion of arginine vasopressin ([Arg8]-AVP) or 24-h water ration (WR).
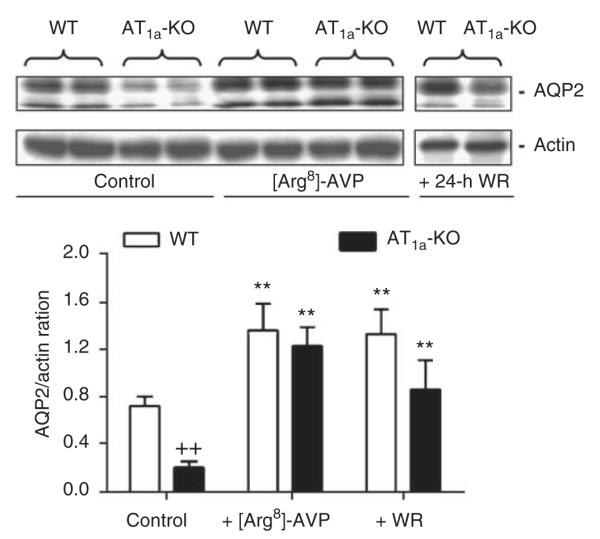
Immunoblots of actin in the same membrane was used as an index of equal loading. **P<0.01 vs respective WT or AT1a-KO controls; ++P<0.01 vs WT controls.
Figure 6. Semiquantitative immunoblots of membrane aquaporin 2 (AQP2) proteins in wild-type (WT) and AT1a-KO mice under basal conditions or after 2-week infusion of arginine vasopressin ([Arg8]-AVP) or 24-h water ration (WR).
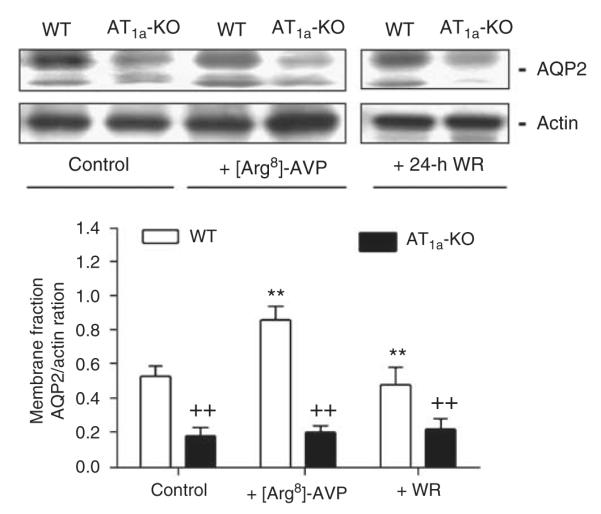
**P<0.01 vs respective WT or AT1a-KO controls; ++P<0.01 vs WT controls or WT mice treated with [Arg8]-AVP or 24-h water ration.
Effects of [Arg8]-AVP infusion or 24-h water ration on AC-III and AC-V/IV proteins in the IM
Basal AC-III proteins were 61% lower in AT1a-KO than in the WT mice (WT: 0.46±0.08 vs 0.18±0.06 AC-III/Actin ratio, P<0.01) (Figure 7). [Arg8]-AVP increased AC-III proteins by 60% in WT mice (AVP: 0.82±0.10 AC-III/Actin ratio; P<0.01 vs control), but had no effect on the AC-III proteins in AT1a-KO mice (AVP: 0.26±0.08 AC-III/Actin ratio; NS vs control). 24-h water ration failed to increase AC-III proteins in AT1a-KO mice to the WT level (WT; 0.72±0.08 vs AT1a-KO: 0.22±0.08 AC-III/Actin ratio, P<0.01). Figure 8 further shows that basal AC-V/VI proteins were threefold higher in the IM of WT than in the AT1a-KO kidneys (WT: 0.53±0.06 vs AT1a-KO: 0.16±0.03 AC V/VI/Actin ratio, P<0.01). Again, [Arg8]-AVP or 24-h water ration did not restore AC-V/VI protein expression in AT1a-KO mice to the level of WT mice (WT: 0.56±0.08 vs AT1a-KO: 0.20±0.08 AC-V/VI/ Actin ratio, P<0.01) (Figure 8).
Figure 7. Semiquantitative immunoblots of A-cyclase-III proteins in wild-type (WT) and AT1a-KO mice under basal conditions or after 2-week infusion of arginine vasopressin ([Arg8]-AVP) or 24-h water ration (WR).

**P<0.01 vs WT controls; ++P<0.01 vs respective WT controls, or WT mice treated with [Arg8]-AVP or 24-h water ration.
Figure 8. Semiquantitative immunoblots of A-cyclase-V/VI proteins in wild-type (WT) and AT1a-KO mice under basal conditions or after 2-week infusion of arginine vasopressin ([Arg8]-AVP) or 24-h water ration (WR).
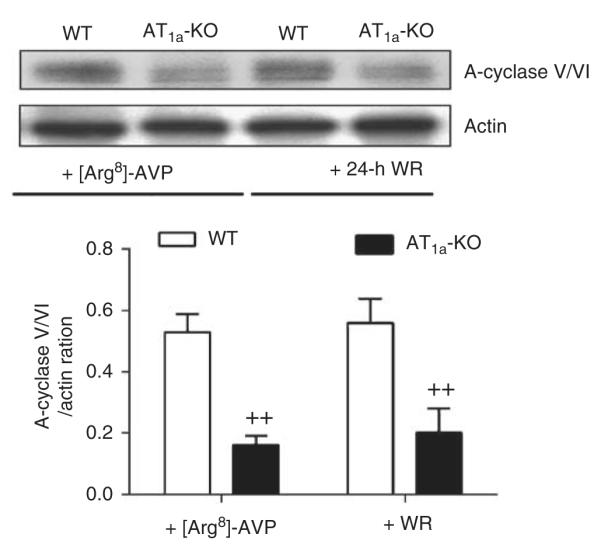
++P<0.01 vs WT mice treated with [Arg8]-AVP or with 24-h water ration.
Effects of [Arg8]-AVP infusion or 24-h water ration on activation of MAP kinases ERK 1/2 in the IM
Basal level of phosphorylated extracellular signal-regulated kinase (p-ERK) 1/2 proteins in the IM was 80% lower in AT1a-KO than in WT mice (Figure 9). [Arg8]-AVP increased p-ERK 1/2 proteins by 89% in WT mice (control: 0.89±0.10 vs [Arg8]-AVP: 1.68±0.23 p-ERK/t-ERK (total ERK) 1/2 ratio; P<0.01), but it had no effect on the p-ERK 1/2 proteins in AT1a-KO mice (control: 0.18±0.08 vs [Arg8]-AVP: 0.25±0.06 p-ERK/t-ERK 1/2 ratio; NS). 24-h water ration did not increase the levels of p-ERK 1/2 in the IM of AT1a-KO mice (WT: 1.06±0.12 vs AT1a-KO: 0.33±0.08 p-ERK/t-ERK 1/2 ratio; P<0.01).
Figure 9. Semiquantitative immunoblots of phosphorylated MAP kinases ERK 1/2 proteins (p-ERK 1/2) in wild-type (WT) and AT1a-KO mice under basal conditions or after 2-week infusion of arginine vasopressin ([Arg8]-AVP) or 24-h water ration (WR).
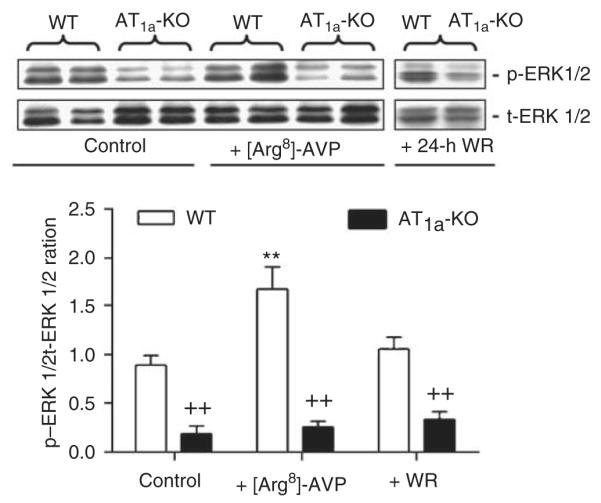
**P<0.01 vs WT controls; ++P<0.01 vs respective WT controls or WT mice treated with [Arg8]-AVP or 24-h water ration. t-ERK, total extracellular signal-regulated kinase.
Effects of 5-day water ration on 24-h urine excretion, urine osmolality, and inner medullary lysate and membrane AQP2 proteins
Similar to the responses to 24-h water ration in AT1a-KO mice, the 5-day water ration protocol also failed to restore 24-h urine excretion, urine osmolality, and inner medullary lysate and membrane AQP2 and AC-III proteins to the levels of WT mice (Figure 10).
Figure 10. 24-h urine excretion, urine osmolality, and inner medullary aquaporin 2 (AQP2) and A-cyclase (AC)-III protein responses to the 5-day water ration in wild-type (WT) and AT1a-KO mice.
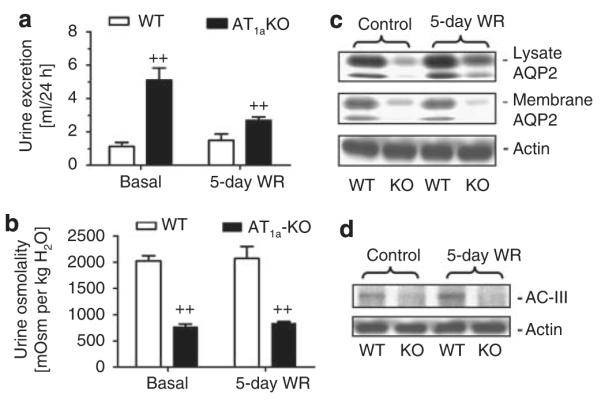
(a) Response of 24 h urine excretion. (b) Response of urine osmolality. (c) Response of inner medullary lysate and membrane AQP2 protein expression. (d) Response of inner medullary AC-III protein expression. ++P<0.01 vs WT mice either under basal or during the water ration period.
Effects of 24-h treatment with 10% sucrose on urine excretion, plasma and urine osmolality, inner medullary AQP2 and AC-III protein expression
Although WT and AT1a-KO mice drank similar amounts of sucrose solution (13.1 vs 14.1 ml/24 h; NS), the osmotic agent induced a greater osmotic diuresis in WT mice than in AT1a-KO mice (Figure 11). 24-h urine excretion was increased by fivefolds in WT mice (1.3±0.3 vs 6.5±1.3 ml/24 h, P<0.01), but by only by onefold in AT1a-KO mice (4.5±0.3 vs 8.1±1.0 ml/24 h, P<0.01) (Figure 11a). Plasma osmolality was not significantly altered in WT (323±3 vs 317±4 mOsm per kg H2O, NS) or in AT1a-KO mice (324±3 vs 318±3 mOsm per kg H2O, NS). Urine osmolality was sharply decreased in WT mice from 2379±95 mOsm per kg H2O to 417±68 mOsm per kg H2O (P<0.01) and in AT1a-KO mice from 828±71 to 326±31 mOsm per kg H2O (P<0.01), respectively (Figure 11b). Sucrose treatment increased the inner medullary AQP2 proteins from 0.70±0.05 to 1.72±0.10 AQP2/Actin ratio in WT mice (P<0.01), but only from 0.23±0.03 to 0.30±0.05 AQP2/ Actin ratio in AT1a-KO mice (Figure 11c). Likewise, AC-III expression was increased by sucrose in WT mice (0.16±0.03 vs 0.38±0.08 AC-III/Actin ratio, P<0.01), but not in AT1a-KO mice (0.03±0.02 vs 0.06±0.03 AC-III/Actin ratio, NS) (Figure 11d). Osmotic responses to 2 week’s sucrose treatment in WT or AT1a-KO mice were similar to their 24-h treatment, and therefore were not shown here.
Figure 11. 24-h urine excretion, urine osmolality, and inner medullary aquaporin 2 (AQP2) and A-cyclase (AC)-III protein responses to the osmotic agent (10% sucrose in drinking solution for 24 h) in wild-type (WT) and AT1a-KO mice.
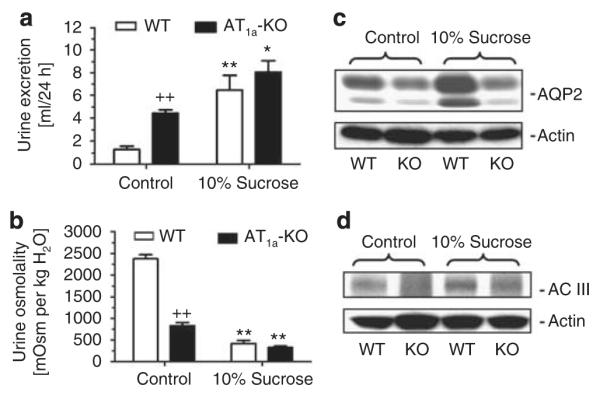
(a) Response of 24 h urine excretion. (b) Response of urine osmolality. (c) Response of inner medullary lysate AQP2 protein expression. (d) Response of inner medullary AC-III protein expression. *P<0.05 or **P<0.01 vs WT or AT1a-KO controls. ++P<0.01 vs WT controls.
DISCUSSION
This study shows that AT1a-KO mice developed polydipsia, polyuria, and urine concentration defects, which were associated with a significantly reduced basal circulating [Arg8]-AVP levels, urine osmolality, lysate and membrane AQP2 proteins, AC-III, AC-V/VI and phosphorylated mitogen-activated protein kinase (MAP) kinases ERK 1/2 signaling proteins in the IM. Our results suggest that central polydipsia is unlikely the major cause of polyuria and urine concentration defects in AT1a-KO mice, because the same 24-h or 5-day water ration to restrict excessive drinking in AT1a-KO mice to the WT levels did not normalize 24-h urine excretion, urine osmolality, and inner medullary AQP2 and V2 receptor signaling proteins to the WT levels. Neither osmotic diuresis because of markedly increased GFR and solute washout nor inner medullary structural abnormalities seemed to contribute substantially to the urine concentration defects in AT1a-KO mice. By contrast, partial [Arg8]-AVP deficiency and functional defects in AT1a receptor-regulated V2 receptor signaling in the IM because of the deletion of AT1a receptors may have played a critical role in the development of polyuria and urine concentration defects in these mice.
It is well documented that deletion of angiotensinogen, ACE, or AT1 receptors (AT1a and AT1b) in mice is associated with a hypoplastic papilla in the renal medulla and polyuria with markedly diluted urine.1-4 In this study, we first reasoned whether AT1a-KO mice developed similar structural abnormalities or atrophy in the IM, which may explain the development of polyuria and severely diluted urine in these mice. Oliverio et al.6 earlier showed that deletion of AT1a receptors alone in mice developed polyuria with a reduced urine osmolality. Further magnetic resonance imaging of renal cortical and medullary structures of WT and AT1a-KO mice found no apparent structural differences between these animals.6 Furthermore, deletion of AT1b receptors alone in mice also does not alter blood pressure and any renal structure or function.14 In this study, we did not observe apparent structural abnormalities in the papilla of AT1a-KO mice at low-power and microscopic levels (Figure 1), or significant differences in inner medullary weights and proteins relative to their kidney weights (Table 2). These results suggest that polyuria and urine concentrating defects in AT1a-KO mice is unlikely due to structural defects in the IM.
We next investigated whether the development of polyuria and urine concentrating defects in AT1a-KO mice may be caused by central polydipsia or defects in central thirst mechanisms,8 because AT1a-KO mice drank three-times more water than WT controls (Table 1).15,16 Central polydipsia is a compulsive drinking disorder and unrestricted water intake alone may lead to polyuria and reduce urine osmolality. However, if central polydipsia is the primary cause, water restriction and AVP treatment in these mice are expected to correct polyuria and restore urine osmolality to WT levels. In this study, both acute 24-h and 5-day water ration failed to normalize polyuria and urine concentration defects in AT1a-KO mice. Nevertheless, we recognize that 5 days of controlled water intake in this study may not be of sufficient duration to reverse a urine concentrating defect because of lifelong central polydipsia in AT1a-KO mice. The alternative explanation may be that AT1a-KO mice have hypotension, which stimulates thirst leading to polydipsia and reduced urine osmolality. However, hypotension, polyuria and lower urine osmolality are expected to stimulate AVP release to correct these defects in these mice.7,8 Thus, central polydipsia or defects in central thirst mechanisms may not play major roles in the development of polyuria and urine concentration phenotypes in AT1a-KO mice.
In an attempt to exclude the possibility that polyuria and urine concentration defects in AT1a-KO mice may result from an osmotic diuresis due to markedly increased GFR, and therefore solute and fluid delivery from proximal tubules, we first measured basal GFR in conscious WT and AT1a-KO mice using the fluorescein isothiocyanate-inulin clearance method.13 As basal GFR values were comparable in conscious age and body weight-matched male WT and AT1a-KO mice, increased filtered load may be excluded as a major contributing factor for polyuria and low urine osmolality in the latter mice (Table 2). Furthermore, we treated WT and AT1a-KO mice with the osmotic agent (10% sucrose) acutely for 24 h or chronically for 2 weeks to induce osmotic diuresis.17 It was expected that the osmotic agent markedly increases solute and fluid delivery from proximal tubules, impairs medullary osmotic equilibrium and interstitial tonicity, and induces solute washout. As expected, WT mice responded to the osmotic agent by markedly increasing urine excretion and maximally decreasing urine osmolality by fivefolds, and increasing AQP2 and AC-III proteins in the IM (Figure 11). Similar osmotic diuretic responses occurred with sucrose treatment for 2 weeks (not shown), and have been shown in normal and uncontrolled diabetic rats.18,19 However, osmotic diuretic responses and the decreases in urine osmolality by sucrose treatment were markedly impaired in AT1a-KO mice. Osmotic diuresis did not increase the inner medullary AQP2 and AC-III signaling proteins in AT1a-KO mice. These different polyuric responses to an osmotic agent between WT and AT1a-KO mice suggest that osmotic diuresis also unlikely contributes to the development of polyuria and urine concentration defects in AT1a-KO mice.
[Arg8]-AVP is the major antidiuretic hormone, and its synthesis and release are physiologically regulated by Ang II through the AT1a and AT1b receptors in the paraventricular nucleus and pituitary glands.7,8,20 Genetic deletion of AT1a receptors may cause partial central diabetes insipidus as a result of partial [Arg8]-AVP deficiency. In this study, the basal circulating [Arg8]-AVP levels in AT1a-KO mice were <50% of WT mice (Table 1), in spite of polyuria and a markedly reduced urine osmolality (Figure 2). This is in contrast with earlier studies that reported that serum [Arg8]-AVP levels in AT1a-KO mice were not different from, lower or higher than, those of WT mice.6,21,22 Oliverio et al.6 found that serum [Arg8]-AVP levels tended to be higher in AT1a-KO mice, and yet these mice still responded to 1-desamino-8-D-arginine vasopressin, although to a smaller extent. The reasons underlying these differences in serum [Arg8]-AVP levels in AT1a-KO mice are not clear. However, the genotype of AT1a-KO mice used in this study is unlikely the cause for these differences, because our mice were bred from the same colony, and all AT1a-KO mice were confirmed by genotyping before experiment and by [125I]-Ang II autoradiography showing the lack of AT1 receptor binding in the kidney.15,16 Instead, the differences are probably because of the specificity and sensitivity of radioimmunoassay vs enzyme-linked immunosorbent assay used, the ways how blood samples were collected and prepared, and the number of blood samples assayed between studies.6,21,22 Our finding that basal serum [Arg8]-AVP levels were lower in AT1a-KO mice is not entirely surprising, because both AT1a and AT1b receptors are expressed in the paraventricular nucleus and pituitary glands.20-22 Indeed, our interpretation is also consistent with the observations that both control or water-deprived AT1a-KO mice still partially responded to acute or long-term [Arg8]-AVP administration by attenuating polyuria and/or increasing urine osmolality above their basal levels, albeit to much less extents than WT mice (Figures 2 and 3).
However, partial [Arg8]-AVP deficiency (or partial central diabetes insipidus) cannot fully explain polyuria and urine concentration defects in AT1a-KO mice. We reasoned that if [Arg8]-AVP deficiency is the sole factor responsible for these defects in AT1a-KO mice, replacement of [Arg8]-AVP acutely or for 2 weeks would normalize urine excretion, urine osmolality, and V2 receptor signaling proteins to those of WT mice. Although a lower basal [Arg8]-AVP level may partly explain increased basal 24-h urine excretion (Table 1), reduced basal urine osmolality (Figures 2 and 3), and decreased basal lysate (Figure 5) and membrane AQP-2 (Figure 6), AC-III (Figure 7) and AC-V/VI (Figure 8), and p-ERK 1/2 proteins (Figure 9) in AT1a-KO mice, infusion of [Arg8]-AVP for 2 weeks did not completely normalize polyuria, urine concentrating ability and V2 receptor signaling proteins in the IM of AT1a-KO mice. The impaired responses to [Arg8]-AVP were also unlikely due to a decrease in V2 receptor numbers in the IM of AT1a-KO mice, because specific [125I]-V2 receptor binding in the IM was slightly upregulated in AT1a-KO mice (Figure 4), probably due to a decrease in basal [Arg8]-AVP levels (Table 1).23,24
Although [Arg8]-AVP and water ration increased lysate AQP2 proteins in the IM of AT1a-KO mice, they had no significant effects on membrane AQP2 proteins, AC-III and AC-V/VI, or p-ERK 1/2 proteins in the IM of the AT1a-KO mice. This suggests that the defects in AQP2 trafficking to the membranes, rather than the defects in AQP2 biosynthesis, contribute to the development of polyuria and urine concentration defects in the AT1a-KO mice. It is well-recognized that in collecting tubules, [Arg8]-AVP binds V2 receptors and activates AC-III and AC-V/VI, leading to an increase in intracellular cAMP levels.25,26 cAMP activates protein kinase A and MAP kinase ERK 1/2, which in turn induce phosphorylation of AQP2 proteins and its membrane insertion.26-28 V2 receptor-mediated activation of adenylyl cyclases and cAMP production plays an important role in the translocation of AQP2 proteins from intracellular vesicles to apical membranes of principal cells of medullary collecting ducts.
These results suggest that AT1a receptor signaling is required for the regulation of V2 receptor-mediated water transport and urine concentration in the IM. How Ang II through the AT1a receptors and AVP through the V2 receptors interact to regulate water transport in the IM remains to be determined. A dual Ang II/AVP receptor sharing similar transmembrane and binding domains, Gs protein-activation motifs and endocytosis-promoting sequences has been proposed,29 but it has not been confirmed by others. Klingler et al.30 showed that Ang II potentiated AVP-dependent cAMP accumulation in CHO cells cotransfected with AT1a and V2 receptors. In NaCl-restricted rats, Kwon et al.31 showed that blockade of AT1 receptor signaling with candesartan was associated with decreased urine concentration and AQP2 expression during 1-desamino-8-D-arginine vasopressin infusion. Kwon’s group further showed that in primary cultured inner medullary collecting duct cells, Ang II and 1-desamino-8-D-arginine vasopressin both increased phosphorylation of AQP2 proteins and trafficking of AQP2 proteins to the cell membranes.28 Thus, our results are consistent with above-mentioned studies, and confirm that AT1a receptor signaling is necessary for AVP-induced expression of membrane AQP2, AC-III, and AC-V/VI, and regulation of urine concentration.
MATERIALS AND METHODS
Animals
A total of 10 groups of wild-type (C57BL/6J) and AT1a-KO mice (Agtr1a-/-) were used in this study (n=6 to 12 per group, unless specified elsewhere). AT1a-KO mice were genotyped before the experiment and confirmed at the end of studies for the lack of AT1 receptor binding in the kidney.15,16
Inner medullary structures in WT and AT1a-KO mice
Frozen sections (6 μm) of WT and AT1a-KO kidneys were stained with hematoxylin and eosin for microscopic visualization. Total inner medullary proteins in WT and AT1a-KO mice were measured and normalized to the kidney weight for comparisons.
Effects of [Arg8]-AVP on urine concentration in WT and AT1a-KO mice
To determine the role of partial central diabetes insipidus in the development of urine concentrating defects in AT1a-KO mice, an osmotic minipump (Model 2002, Alza Corp., Mountain View, CA, USA) was implanted intraperitoneally in WT and AT1a-KO mice for infusion of [Arg8]-AVP for 2 weeks (100 ng/h).7,15,16,32 Control WT and AT1a-KO mice were not treated with [Arg8]-AVP. Furthermore, one group of WT and AT1a-KO mice were deprived of water for 16 h before they were treated with exogenous [Arg8]-AVP (100 ng, intraperitoneally). Urine samples were collected by bladder massage over a 3-h period after AVP treatment for measurement of urine osmolality.
Effects of acute 24-h or chronic 5-day water ration on urine concentration in WT and AT1a-KO mice
Two groups of WT and AT1a-KO mice were placed on a 24-h or 5-day water ration protocol, in which all mice had equal access to 4 ml water within a 24-h period.
Effects of administration of an osmotic agent on polyuria and urine concentration in WT and AT1a-KO mice
Two groups of WT and AT1a-KO mice were treated with the osmotic agent (10% sucrose, in drinking solution) acutely for 24 h or chronically for 2 weeks.18
Measurement of plasma [Arg8]-AVP
At the end of experiment, mice were decapitated without anesthesia and blood samples collected as described.6,21,22 Plasma [Arg8]-AVP was measured using a sensitive ELISA kit (Bachem, Torrance, CA, USA).
Measurement of plasma and urine osmolality
At the end of experiment, mice were decapitated without anesthesia and blood and urine samples collected for measurements of plasma and urine osmolality using an osmometer.4,6
Measurement of GFR
To determine whether polyuria and urine concentrating defects was because of markedly increased GFR in AT1a-KO mice, one group of WT and AT1a-KO mice were infused with 3% fluorescein isothiocyanate-labeled inulin (Sigma, St Louis, MO, USA) through an osmotic minipump for 2 weeks.13 Blood samples were collected from tail vessels weekly or by decapitation at the end of experiment, whereas 24-h urine samples were collected using metabolic cages. Plasma and urine concentrations of fluorescein isothiocyanate-labeled inulin were measured by a fluorescence plate reader.
[125I]-V2 receptor binding in the IM
Vasopressin V2 receptor binding in the kidney was visualized and quantitated using in vitro autoradiography of [125I]-V2R analog.23
Western blot analysis of lysate and membrane AQP2 proteins
Lysate and membrane AQP2 proteins were measured by western blot using a goat polyclonal antibody targeting the C-terminus of AQP2 of human origin (sc-9882; Santa Cruz, Santa Cruz, CA, USA; 1:200).28,31,33,34 Signals were detected using enhanced chemiluminescence (Amersham, Piscataway, NJ, USA), as described.35-37
Western blot analysis of AC-III and AC-V/VI proteins
The AC-III and AC-V/VI proteins in the IM of WT and AT1a-KO mice were measured by western blot using a rabbit antibody targeting the C-terminus of AC-III of mouse origin (sc-588; Santa Cruz; 1:200) or a rabbit antibody targeting the C-terminus of AC-V/VI of human origin (sc-590; Santa Cruz; 1:200).25,26
Western blot analysis of total and phosphorylated MAP kinases ERK 1/2
Total (t-ERK 1/2) and p-ERK 1/2 in the IM of WT and AT1a-KO mice were determined as described.35-37
Statistical analysis
Data are presented as means±s.e. of groups of 6–12 WT and AT1a-KO mice. One-way ANOVA (analysis of variance) was used to compare the differences between basal and after treatments in the same strain of mice, whereas unpaired Student’s t-test was used to compare the differences in the same parameters between WT and AT1a-KO mice before or after a treatment. The significance was set at P<0.05.
ACKNOWLEDGMENTS
Portions of the results in this work were presented at Renal Week 2007, American Society of Nephrology, in San Francisco, California, October 31—November 5, 2007, and published as an abstract in J Am Soc Nephrol 2007; 18: 66A.
DISCLOSURE This study was supported in part by a grant from the National Institute of Diabetes, Digestive and Kidney Diseases (5RO1DK067299) and an institutional grant from Henry Ford Health System (A10216) to Dr Zhuo.
REFERENCES
- 1.Kim HS, Krege JH, Kluckman KD, et al. Genetic control of blood pressure and the angiotensinogen locus. Proc Natl Acad Sci USA. 1995;92:2735–2739. doi: 10.1073/pnas.92.7.2735. [DOI] [PMC free article] [PubMed] [Google Scholar]
- 2.Kihara M, Umemura S, Sumida Y, et al. Genetic deficiency of angiotensinogen produces an impaired urine concentrating ability in mice. Kidney Int. 1998;53:548–555. doi: 10.1046/j.1523-1755.1998.00801.x. [DOI] [PubMed] [Google Scholar]
- 3.Esther CR, Marino EM, Howard TE, et al. The critical role of tissue angiotensin-converting enzyme as revealed by gene targeting in mice. J Clin Invest. 1997;99:2375–2385. doi: 10.1172/JCI119419. [DOI] [PMC free article] [PubMed] [Google Scholar]
- 4.Oliverio MI, Kim HS, Ito M, et al. Reduced growth, abnormal kidney structure, and type 2 (AT2) angiotensin receptor-mediated blood pressure regulation in mice lacking both AT1a and AT1b receptors for angiotensin II. Proc Natl Acad Sci USA. 1998;95:15496–15501. doi: 10.1073/pnas.95.26.15496. [DOI] [PMC free article] [PubMed] [Google Scholar]
- 5.Ito M, Oliverio MI, Mannon PJ, et al. Regulation of blood pressure by the type 1A angiotensin II receptor gene. Proc Natl Acad Sci USA. 1995;92:3521–3525. doi: 10.1073/pnas.92.8.3521. [DOI] [PMC free article] [PubMed] [Google Scholar]
- 6.Oliverio MI, Delnomdedieu M, Best CF, et al. Abnormal water metabolism in mice lacking the type 1A receptor for ANG II. Am J Physiol Renal Physiol. 2000;278:F75–F82. doi: 10.1152/ajprenal.2000.278.1.F75. [DOI] [PubMed] [Google Scholar]
- 7.Robertson GL. Regulation of vasopressin secretion. In: Seldin DW, Giebisch G, editors. The Kidney: Physiology and Pathophysiology. 2nd edn Raven Press; New York: 1992. pp. 1595–1613. [Google Scholar]
- 8.Fitzsimons JT. Angiotensin, thirst, and sodium appetite. Physiol Rev. 1998;78:583–686. doi: 10.1152/physrev.1998.78.3.583. [DOI] [PubMed] [Google Scholar]
- 9.Carmosino M, Brooks HL, Cai Q, et al. Axial heterogeneity of vasopressin-receptor subtypes along the human and mouse collecting duct. Am J Physiol Renal Physiol. 2007;292:F351–F360. doi: 10.1152/ajprenal.00049.2006. [DOI] [PubMed] [Google Scholar]
- 10.Ecelbarger CA, Chou CL, Lolait SJ, et al. Evidence for dual signaling pathways for V2 vasopressin receptor in rat inner medullary collecting duct. Am J Physiol. 1996;270:F623–F633. doi: 10.1152/ajprenal.1996.270.4.F623. [DOI] [PubMed] [Google Scholar]
- 11.Yip KP. Coupling of vasopressin-induced intracellular Ca2+ mobilization and apical exocytosis in perfused rat kidney collecting duct. J Physiol. 2002;538:891–899. doi: 10.1113/jphysiol.2001.012606. [DOI] [PMC free article] [PubMed] [Google Scholar]
- 12.Nielsen S, Frokiaer J, Marples D, et al. Aquaporins in the kidney: from molecules to medicine. Physiol Rev. 2002;82:205–244. doi: 10.1152/physrev.00024.2001. [DOI] [PubMed] [Google Scholar]
- 13.Qi Z, Whitt I, Mehta A, et al. Serial determination of glomerular filtration rate in conscious mice using FITC-inulin clearance. Am J Physiol Renal Physiol. 2004;286:F590–F596. doi: 10.1152/ajprenal.00324.2003. [DOI] [PubMed] [Google Scholar]
- 14.Chen X, Li W, Yoshida H, et al. Targeting deletion of angiotensin type 1B receptor gene in the mouse. Am J Physiol. 1997;272:F299–F304. doi: 10.1152/ajprenal.1997.272.3.F299. [DOI] [PubMed] [Google Scholar]
- 15.Li XC, Navar LG, Shao Y, et al. Genetic deletion of AT1a receptors attenuates intracellular accumulation of angiotensin II in the kidney of AT1a receptor-deficient mice. Am J Physiol Renal Physiol. 2007;293:F586–F593. doi: 10.1152/ajprenal.00489.2006. [DOI] [PMC free article] [PubMed] [Google Scholar]
- 16.Li XC, Zhuo JL. In vivo regulation of AT1a receptor-mediated intracellular uptake of [125I]-Val5-angiotensin II in the kidneys and adrenal glands of AT1a receptor-deficient mice. Am J Physiol Renal Physiol. 2008;294:F293–F302. doi: 10.1152/ajprenal.00398.2007. [DOI] [PMC free article] [PubMed] [Google Scholar]
- 17.Liu G, Daneshgari F. Temporal diabetes- and diuresis-induced remodeling of the urinary bladder in the rat. Am J Physiol Regul Integr Comp Physiol. 2006;291:R837–R843. doi: 10.1152/ajpregu.00917.2005. [DOI] [PubMed] [Google Scholar]
- 18.Kim D, Sands JM, Klein JD. Changes in renal medullary transport proteins during uncontrolled diabetes mellitus in rats. Am J Physiol Renal Physiol. 2003;285:F303–F309. doi: 10.1152/ajprenal.00438.2002. [DOI] [PubMed] [Google Scholar]
- 19.Kim D, Sands JM, Klein JD. Role of vasopressin in diabetes mellitus-induced changes in medullary transport proteins involved in urine concentration in Brattleboro rats. Am J Physiol Renal Physiol. 2004;286:F760–F766. doi: 10.1152/ajprenal.00369.2003. [DOI] [PubMed] [Google Scholar]
- 20.de Gasparo M, Catt KJ, Inagami T, et al. International union of pharmacology. XXIII. The angiotensin II receptors. Pharmacol Rev. 2000;52:415–472. [PubMed] [Google Scholar]
- 21.Morris M, Means S, Oliverio MI, et al. Enhanced central response to dehydration in mice lacking angiotensin AT1a receptors. Am J Physiol Regul Integr Comp Physiol. 2001;280:R1177–R1184. doi: 10.1152/ajpregu.2001.280.4.R1177. [DOI] [PubMed] [Google Scholar]
- 22.Morris M, Li P, Callahan MF, et al. Neuroendocrine effects of dehydration in mice lacking the angiotensin AT1a receptor. Hypertension. 1999;33:482–486. doi: 10.1161/01.hyp.33.1.482. [DOI] [PubMed] [Google Scholar]
- 23.Tian Y, Sandberg K, Murase T, et al. Vasopressin V2 receptor binding is down-regulated during renal escape from vasopressin-induced antidiuresis. Endocrinology. 2000;141:307–314. doi: 10.1210/endo.141.1.7256. [DOI] [PubMed] [Google Scholar]
- 24.Terashima Y, Kondo K, Mizuno Y, et al. Influence of acute elevation of plasma AVP level on rat vasopressin V2 receptor and aquaporin-2 mRNA expression. J Mol Endocrinol. 1998;20:281–285. doi: 10.1677/jme.0.0200281. [DOI] [PubMed] [Google Scholar]
- 25.Bek MJ, Zheng S, Xu J, et al. Differential expression of adenylyl cyclases in the rat nephron. Kidney Int. 2001;60:890–899. doi: 10.1046/j.1523-1755.2001.060003890.x. [DOI] [PubMed] [Google Scholar]
- 26.Hoffert JD, Chou CL, Fenton RA, et al. Calmodulin is required for vasopressin-stimulated increase in cyclic AMP production in inner medullary collecting duct. J Biol Chem. 2005;280:13624–13630. doi: 10.1074/jbc.M500040200. [DOI] [PMC free article] [PubMed] [Google Scholar]
- 27.Hasler U, Numes P, Bouley R, et al. Acute hypotonicity alters aquaporin-2 trafficking and induces a MAP-kinase-dependent accumulation at the plasma membrane of renal epithelial cells. J Biol Chem. 2008;283:26643–26661. doi: 10.1074/jbc.M801071200. [DOI] [PMC free article] [PubMed] [Google Scholar]
- 28.Lee YJ, Song IK, Jang KJ, et al. Increased AQP2 targeting in primary cultured IMCD cells in response to angiotensin II through AT1 receptor. Am J Physiol Renal Physiol. 2007;292:F340–F350. doi: 10.1152/ajprenal.00090.2006. [DOI] [PubMed] [Google Scholar]
- 29.Ruiz-Opazo N, Akimoto K, Herrera VL. Identification of a novel dual angiotensin II/vasopressin receptor on the basis of molecular recognition theory. Nat Med. 1995;1:1074–1081. doi: 10.1038/nm1095-1074. [DOI] [PubMed] [Google Scholar]
- 30.Klingler C, Ancellin N, Barrault MB, et al. Angiotensin II potentiates vasopressin-dependent cAMP accumulation in CHO transfected cells. Mechanisms of cross-talk between AT1A and V2 receptors. Cell Signal. 1998;10:65–74. doi: 10.1016/s0898-6568(97)00077-6. [DOI] [PubMed] [Google Scholar]
- 31.Kwon TH, Nielsen J, Knepper MA, et al. Angiotensin II AT1 receptor blockade decreases vasopressin-induced water reabsorption and AQP2 levels in NaCl-restricted rats. Am J Physiol Renal Physiol. 2005;288:F673–F684. doi: 10.1152/ajprenal.00304.2004. [DOI] [PubMed] [Google Scholar]
- 32.Brooks HL, Ageloff S, Kwon TH, et al. cDNA array identification of genes regulated in rat renal medulla in response to vasopressin infusion. Am J Physiol Renal Physiol. 2003;284:F218–F228. doi: 10.1152/ajprenal.00054.2002. [DOI] [PubMed] [Google Scholar]
- 33.Hasler U, Mordasini D, Bens M, et al. Long term regulation of aquaporin-2 expression in vasopressin-responsive renal collecting duct principal cells. J Biol Chem. 2002;277:10379–10386. doi: 10.1074/jbc.M111880200. [DOI] [PubMed] [Google Scholar]
- 34.Chou CL, Yip KP, Michea L, et al. Regulation of aquaporin-2 trafficking by vasopressin in the renal collecting duct. Roles of ryanodine-sensitive Ca2+ stores and calmodulin. J Biol Chem. 2000;275:36839–36846. doi: 10.1074/jbc.M005552200. [DOI] [PubMed] [Google Scholar]
- 35.Li XC, Zhuo JL. Selective knockdown of AT1 receptors by RNA interference inhibits Val5-Ang II endocytosis and NHE-3 expression in immortalized rabbit proximal tubule cells. Am J Physiol Cell Physiol. 2008;293:C367–C378. doi: 10.1152/ajpcell.00463.2006. [DOI] [PMC free article] [PubMed] [Google Scholar]
- 36.Li XC, Carretero OA, Shao Y, et al. Glucagon receptor-mediated extracellular signal-regulated kinase 1/2 phosphorylation in rat mesangial cells: role of protein kinase A and phospholipase C. Hypertension. 2006;47:580–585. doi: 10.1161/01.HYP.0000197946.81754.0a. [DOI] [PMC free article] [PubMed] [Google Scholar]
- 37.Li XC, Carretero OA, Zhuo JL. Cross-talk between angiotensin II and glucagon receptor signaling mediates phosphorylation of mitogen-activated protein kinase ERK1/2 in rat glomerular mesangial cells. Biochem Pharmacol. 2006;71:1711–1719. doi: 10.1016/j.bcp.2006.03.018. [DOI] [PMC free article] [PubMed] [Google Scholar]