Abstract
To determine ractopamine residues in animal food products (chicken muscle, pettitoes, pig muscle, and pig liver), we established a rapid direct competitive enzyme-linked immunosorbent assay (ELISA) using a polyclonal antibody generated from ractopamine-linker-BSA. The antibody showed high sensitivity and specificity in phosphate buffer, with an IC50 of 0.6 ng/mL, and the limit of detection was 0.04 ng/mL. The matrix effect of the samples was easily eliminated by one-step extraction with PBS, without any organic solution or clean-up procedure such as SPE or liquid-liquid extraction, making it a much more simple and rapid method than previously reported ones. The detection limit in blank samples was 0.2 μg/kg. To validate this new RAC (ractopamine hydrochloride) ELISA, a RAC-free pig liver sample spiked at three different concentrations was prepared and analyzed by HPLC and ELISA. The results showed a good correlation between the data of ELISA and HPLC (R2 > 0.95), which proves that the established ELISA is accurate enough to quantify the residue of RAC in the animal derived foods.
1. Introduction
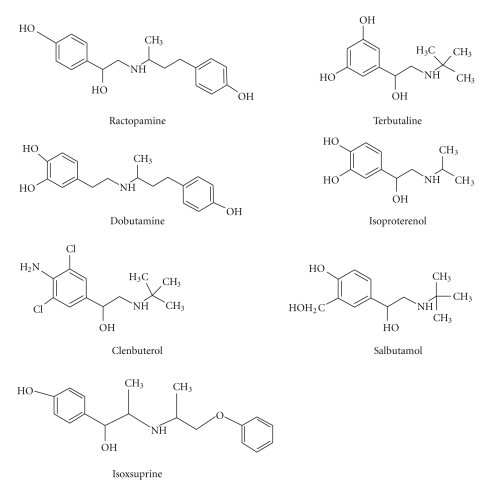
Ractopamine hydrochloride (RAC·HCl, MW 337.85, (1R*,3R*),(1R*,3S*)-4-hydroxy-R-[[[3-(4-hydroxyphenyl)-1-methylpropyl]amino]methyl]-benzenemethanol hydrochloride (Figure 1)) is a phenethanolamine member of the family of β-adrenergic agonists (β-agonists). These compounds are mainly used in human and veterinary medicine as tocolytic and bronchodilator agents [1]. They are also widely used as growth promoters in livestock production. The advantages of feeding animals with β-agonists have been reported to include the promotion of repartitioning of fat into muscles, in addition to the ability of increasing average daily weight gain, improving feed efficiency, saving on feed, and decreasing the number of days to market when higher doses are administered [2–5]. Furthermore, as a result of better feed utilization efficiency, there are positive environmental benefits for livestock producers in terms of decreased nitrogen and phosphorus excretions, and reduced amount of total animal waste [6]. However, meat products obtained from illegally treated animals with these compounds may pose potential risks linked to adverse cardiovascular and central nervous system effects [1].
Figure 1.
Structures of ractopamine and some closely related compounds.
Ractopamine, a veterinary additive drug, was approved by the US Food and Drug Administration for the use in swine production [7]. Recently, it has become more and more popular not only in pig but also in chicken and cattle production, following clenbuterol which had been the most widely used β-agonists in livestock production. Due to its potential risks for human health, ractopamine is still used in a restricted manner within a low limit of dosage when used in livestock production, in many countries. Therefore, there has been an increasing number of analytical methods reported to monitor ractopamine in animal urine, feeds, and tissues such as instrument methods like HPLC with electrochemical detection [8] and fluorescence [9], LC-MS [10, 11], and GC-MS [12]. However, these analytical approaches, which use several clean-up procedures (liquid-liquid extraction (LLE) and solid-phase extraction (SPE) using different sorbents), are quite complicated, time-consuming, and expensive. Furthermore, integral production chain systems currently demand faster onsite (farmhouses) and/or online (slaughterhouses) test systems. Immunoassays as a screening detection method can rapidly detect low amounts of residues in many samples. Shelver et al. generated both polyclonal [13] and monoclonal [14] antibodies to analyze ractopamine by ELISA. Wang et al. [15] also reported a monoclonal antibody immunoassay to determine ractopamine in swine feeds with a detection limit of 0.24 μg/g sample. However, all of these ELISA methods were mainly used for animal urine or feed samples, and complicated sample clean-up procedures (LLE and SPE) were required when animal tissues were analyzed. Therefore, these tissue- (except for urine) extraction methods combined with RAC-ELISA are too complex as routine test systems. Moreover, to the best of our knowledge, there is no report on the determination of ractopamine in chicken muscle. As a result, it is necessary to develop a more rapid, sensitive, and effective method for the determination of RAC residues in edible animal foods including chicken muscle.
2. Materials and Methods
2.1. Materials
2.1.1. Chemicals and Materials
Bovine serum albumin (BSA) was obtained from Merck (Darmstadt, Germany). Horseradish peroxidase (HRP), ovalbumin (OVA), β-Glucuronidase from Escherichia coli, and Freund's complete and incomplete adjutants were purchased from Sigma Chemical Co. (Saint Louis, Mo, USA). Reagent grade 3, 3′, 5, 5′-tetramethyl-benzidine (TMB), hydrogen peroxide, isobutyl chloroformate, butane-1, 4-diol diglycidyl ether, and other chemicals were also from Sigma. Ractopamine hydrochloride was purchased from Pure Chemical Analysis Co., Ltd (Bornew, Belgium). Protein A-Sepharose 4B was purchased from Amersham Biosciences (Uppsala, Sweden). Polystyrene 96-well microplates were from Nunc (Rockilde, Denmark), and the microplate washer was from Bio-Rad (Hercules, Calif, USA). Immunoassay absorbance was read with a Multiskan Spectrum purchased from Thermo (Labsystems, Vantaa, Finland) in the dual-wavelength mode (450–650 nm). Centrifugation was conducted by Centrifuge 5804R (Eppendorf AG, Hamburg, Germany). Double deionized water (DDW) was prepared with a Milli-Q (Millipore, Mass, USA) water purification system.
2.1.2. Solutions
Phosphate-buffered saline (1 × PBS; 38.4 mmol/L Na2HPO4·H2O, 11.5 mmol/L NaH2PO4·H2O, 154 mmol/L NaCl, pH 7.5), phosphate-buffered saline with 0.05% Tween 20 (PBST), coating buffer (CB, 50 mmol/L sodium carbonate buffer, pH 9.6), blocking buffer (0.5% skimmed milk powder in 1 × PBS), and TMB substrate solution (prepared by adding 3.3 mg TMB in 250 μL DMSO to 25 mL phosphate-citrate buffer (0.1 mol/L citric acid + 0.2 mol/L Na2HPO4; pH 4.3) containing 3.25 μL of a 30% H2O2 solution), and termination solution (2.5 mol/L H2SO4 in DDW) were used.
2.2. Methods
2.2.1. Preparation of the Immunogen and Enzyme Conjugate
The hapten RAC was coupled to BSA as the immunogen, and coupled to HRP as the enzyme tracer. The coupling agent, butane-1, 4-diol diglycidyl ether, was used for coupling RAC to proteins.
The conjugating procedure of immunogen RAC-BSA was adapted from Elliott et al. [16]. In brief, 10 mg BSA was dissolved in 0.5 mL DDW, and the pH was adjusted to 10.8 using 1.0 mol/L sodium hydroxide. Coupling agent solution (50 μL of 22 μl/L butane-1, 4-diol diglycidyl ether in DDW) was added to the BSA solution, and the mixture was incubated for 22 hours at room temperature under nitrogen atmosphere.
RAC·HCl (17 mg, 50 μmol) was added to 0.5 mL NaOH (0.5 mol/L) containing 10% dimethylformamide. The mixture was then added to the epoxy-activated BSA solution (precooled at 4°C, in the refrigerator), slowly in an ice bath, and incubated for 22 hours at room temperature under nitrogen atmosphere.
The conjugating method of RAC-HRP was similar to that of the immunogen in the first step except for the amounts of the reagents which were 5 mg enzyme HRP instead of 10 mg, and 8.5 mg RAC·HCl (25 μmol) were added to the activated HRP solution. Finally, the mixture was incubated for 40 hours at room temperature under a nitrogen atmosphere.
Both the conjugated immunogen and enzyme tracer were dialyzed against PBS for 3 days at 4°C. The conjugated immunogen was stored at −20°C, and the enzyme tracer was stored at 4°C with 0.01% thiomersal until required.
2.2.2. Preparation of the Coating Conjugate
The protein OVA was used for the preparation of the coating conjugate. The hapten RAC was coupled to the protein OVA using the method of mixed acid anhydride, as follows. RAC·HCl (17 mg, 50 μmol) and 5 mg (50 μmol) succinic anhydride were diluted in 1 mL dry pyridine. After slow stirring for 24 hours at room temperature, the mixture was blown dry with a nitrogen flow. The residue was diluted in a 2 mL mixture of DMF and 1, 4-dioxane (1 : 1), and then stirred for 10 minutes in an ice bath by adding 13 μL (about 0.05 mmol) tributylamine. After 7.2 μL (0.05 mmol) isobutyl chloroformate were added, the mixture was stirred for 1 hour at room temperature. Subsequently, the activated RAC mixture was dripped onto the precooled protein OA solution which was previously prepared with the following method [14]. OA (10 mg) was diluted in 2.5 mL phosphate buffer (0.1 mol/L). In order to avoid protein denaturation, dripping and stirring should be carried out at the same time at a low temperature, and should be finished within 30 minutes. The final mixture was stirred gently for 24 hours at room temperature, and purified using extensive dialysis against PBS buffer for 3 days at 4°C. The purified coating conjugate solution was stored at −20°C with 0.02% NaN3 until required.
2.2.3. Antibody Production
Antibodies were produced in rabbits using an immunization approach similar to that described by Wang et al. [17]. Two white rabbits were immunized by intradermal and intramuscular injections of the emulsified RAC-BSA immunogen. After 3 initial injections at 2-week intervals, booster injections were given monthly. Blood was collected from the marginal ear vein 10 days after each booster injection for antibody titer assay, and the whole blood was then collected after 6 immunizations.
The anti-RAC antiserum was centrifuged at 2000 rpm for 10 minutes (Eppendorf 5804R, Hamburg, Germany) and stored in small tubes (about 2 mL per tube) at −20°C. The titer for the specific antiserum was monitored by an indirect competitive ELISA using the immunized hapten conjugated to OVA. IgG from the antiserum was purified by Protein A-Sepharose 4B affinity chromatography. After dialyzing against PBS buffer for 3 days, the purified antibodies were stored at 4°C with 0.02% NaN3 until required.
2.2.4. Immunoassay Procedure
(a) Indirect Competitive ELISA —
Flat-bottom polystyrene microplates were coated with RAC-OA conjugates at 1 μg per well in 100 μL coating buffer, and incubated overnight at room temperature. Plates were washed 3 times with PBST using a 96PW microplate washer, and unbound active sites were blocked with 200 μL 0.5% skimmed milk powder in PBS per well for 1 hour at room temperature. After the plates were washed 3 times, 50 μL of the appropriate antiserum/antibody dilution in PBS (the other 50 μL of RAC standards in PBS were added to determine antibody specificity) were added in each well for titer determination, and incubated for 1 hour at room temperature. After 4 additional washes, the plates were incubated for 1 hour at room temperature with 100 μL peroxidase-labeled goat anti-rabbit immunoglobulins diluted 1 : 10 000 in PBS, in each well. After washing 5 times with PBST, 150 μL TMB substrate solution were added to each well to measure the HRP tracer activity. The color production of the enzymatic reaction was terminated after 30 minutes at room temperature by adding 50 μL H2SO4 (2.5 mol/L) per well. The absorbance in each well was measured with a Multiskan Spectrum in the dual-wavelength mode (450 nm for the test, and the whole plate background is subtracted with the measurement at 650 nm).
(b) Direct Competitive ELISA —
The microplate well was coated with purified antibodies in 100 μL coating buffer, and incubated overnight at room temperature. The coated plates were washed 3 times with PBST, and unbound active sites were blocked with 200 μL 0.5% skimmed milk powder in PBS for 1 hour at room temperature. After the plate was washed 4 times, 50 μL of the standard solution of RAC dissolved in PBS (or diluted sample extracts) followed by 50 μL of HRP-hapten conjugate solution diluted in PBS were added to each well, and the mixture was incubated in a shaker for 1 hour at room temperature. After washing 5 times with PBST, 150 μL of TMB substrate solution were added to each well. The color development of the enzymatic reaction was terminated after 30 minutes at room temperature by adding 50 μL H2SO4 (2.5 mol/L) per well. The absorbance was measured with a Multiskan Spectrum in the dual-wavelength mode (450 nm for the test, and the whole plate background is subtracted with the measurement at 650 nm).
(c) Optimization of the RAC ELISA Test —
Direct competitive ELISA was used to analyze the parameters of the described method such as the amount of the antibody coating, and the ionic strength and pH of the diluting buffer. Three different amounts of antibodies (0.5 μg, 1.0 μg, and 1.5 μg antibody per well) were tested. After the optimal antibody coating quantity was decided, the proper ionic strength was investigated by changing the concentration of PBS buffer ranging from 10 to 40 mmol/L. Then, under the optimal conditions, the effects of different pHs (pH = 6.0, 7.5, 8.5, 9.5) were tested.
(d) Sample Preparation —
Four different samples including chicken muscle, pig muscle, pig liver, and pettitoes were chosen to evaluate the performance of ELISA. The samples were bought from the local markets. For the spiking study, each sample was spiked by dropping with the RAC standard solution in methanol, making the samples with well-distributed different levels of RAC, the samples were thoroughly mixed and then allowed to stand at 4°C overnight. All the samples were prepared for the immunoassay using the same extraction procedure as that for pig muscle as follows. The sample (2 g) was chopped, and mixed with 10 mL PBS for 2 minutes using a Waring blender (Omni international, Marietta, Ga, USA). Then, the mixture was centrifuged for 10 minutes at 4,000 rpm (Centrifuge 5804R, Eppendorf AG, Hamburg, Germany) at room temperature. The fat layer was then discarded, and the upper liquid was transferred into a test tube, and analyzed directly by direct competitive ELISA.
2.2.5. Validation Study of ELISA by HPLC
(a) Instrumentation for HPLC Analysis —
The ELISA results were verified using an HPLC system (Shimadzu, Kyoto, Japan) equipped with a LC-20AB pump and a RF-10Axl FLD (excitation wavelength, 226 nm; emission wavelength, 305 nm). A Thermo ODS-2 HYPERSIL column (5 μm, 4.6 mm × 250 mm) was used with a mobile phase consisting of 0.087% 1-pentanesulfonic acid sodium salt in 2% glacial acetic acid solution/acetonitrile (68 : 32) at a flow rate of 1.0 mL/min. The injection volumes were 20 μL, and the separation was performed at 20–25°C.
(b) Sample Pretreatment —
Homogenized tissue sample (5 g) was extracted with acetonitrile (2 × 10 mL) and stirred for 20 minutes on a shaker (IKA, Staufen, Germany). After centrifugation (1,500 g, 4°C, 10 minutes), the supernatant was transferred into a separating funnel. The acetonitrile solution was defatted by washing with 20 mL hexane (saturated by acetonitrile) 3 times. Finally, 20 mL of saturated NaCl solution were added to eliminate emulsion formation. The acetonitrile was evaporated to dryness under reduced pressure at 50°C. The residue was redissolved in 5 mL 2% acetic acid solution, and was used for the solid-phase extraction.
(c) Sample Clean-Up —
Solid-phase extraction was carried out using the extraction cartridges packed with multiwalled carbon nanotubes under reduced pressure. The cartridges were activated with 5 mL methanol, followed by 5 mL DDW, and then equilibrated with 5 mL 2% acetic acid solution. After the sample extracts were loaded, the cartridges were washed with 5 mL 2% acetic acid solution, and sequentially eluted with 7 mL 5% ammonia in methanol. The eluted sample was dried, and redissolved in 1 mL 2% acetic acid for HPLC analysis, or redissolved in appropriate volume of PBS for ELISA analysis.
2.2.6. Deconjugation of RAC Glucuronide Metabolites
The real food sample offered by Tianjin Entry-Exit Inspection and Quarantine Bureau was extracted by PBS according to “Sample Preparation,” the extracts were divided into two aliquots, one is analysed by ELISA directly and the other is adjusted to pH 6.8 and incubated at 37°C for 10 minutes, then dropped with β-D-glucuronidase solution, deconjugated by for 60 minutes, the mixture was adjusted to pH 7.5 and analysed by ELISA.
3. Results and Discussion
3.1. Optimization of RAC ELISA
Indirect competitive ELISA was used to screen the antiserum. After the purification of the antibody and the preparation of the enzyme tracer, direct competitive ELISA was optimized. Several parameters including antibody coating quantity, ionic strength, and pH of the diluting buffer were studied in details.
The optimal quantities of the coating antibody and the enzyme conjugate required for the direct competitive ELISA were determined by checkerboard titration. They were chosen according to the lowest IC50 with an absorbance value of 0.7–1.2 for the control sample during color development. The results showed that an antibody coating quantity of 1.0 μg per well (100 μL), and an enzyme conjugate dilution factor of 30 000 were the best among all testing conditions.
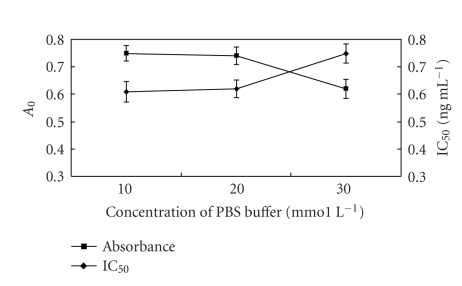
The effect of ionic strength is shown in Figure 2. The absorbance decreased, and the IC50 increased with an increasing salt concentration. It is reasonable to believe that the increased ionic strength has a detrimental effect on the interaction between the antibody and the analyte or enzyme conjugate where ionic driving forces prevail. The crystallizability of the buffer at a high salt concentration resulted in the choice of a concentration of 10 mmol/L PBS as the optimal dilution buffer.
Figure 2.
Optimization of ionic strength of the diluting buffer (n = 3).
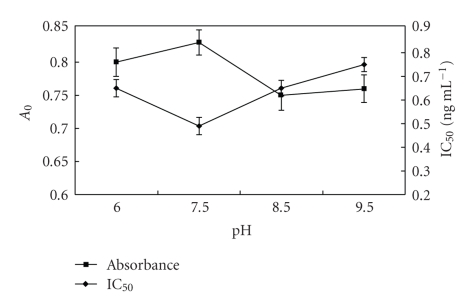
The effect of the buffer pH is shown in Figure 3. We found that the IC50 reached its minimum value at pH 7.5, that is, the immunoassay for RAC was more sensitive at pH 7.5 than at other pHs. This is because acidic and alkaline solutions likely promote the denaturation of the antibody and/or enzyme conjugate, causing changes in their spatial structures with adverse effects on the reactions between the antibody and the analyte or enzyme conjugate. Consequently, pH 7.5 was selected for further studies.
Figure 3.
Optimization of pH of the diluting buffer (n = 3).
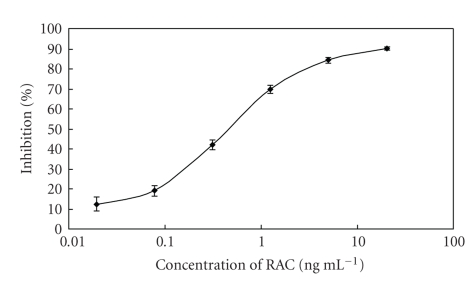
From all these results, a 10 mmol/L PBS buffer of pH 7.5 was chosen as the optimal solvent for the RAC standard (or samples) and enzyme conjugate dilutions, and 1.0 μg of antibody per well was the optimal coating amount. The standard curve of RAC is shown in Figure 4. A 6-point (stepwise dilution of the RAC standard solution) calibration curve was performed in the ELISA test, resulting in an average IC50 of 0.6 ng/mL and average IC15 of 0.04 ng/mL. These results showed that the obtained RAC antibody was much more sensitive than those reported by previous studies [13, 15].
Figure 4.
Standard curve of ractopamine in PBS buffer (n = 6).
3.2. Analytical Characteristics of RAC ELISA
3.2.1. Specificity of the RAC Antibody
Crossreactions can affect analytical results by either giving false positives or by elevating the predicted concentration of the target compound when both the target and one or more structurally similar compounds are present. Therefore, the specificity of the antibody toward a compound and its most probable crossreactants should be determined. The crossreactivity profile of the RAC antibody was determined by comparing the dose-response curves of RAC with those of 7 analogues including ractopamine, clenbuterol, salbutamol, isoproterenol, terbutaline, dobutamine, and isoxsuprine (Figure 1). All these compounds showed no cross-reactivity with the RAC antibody except for dobutamine. Wicker et al. [18] reported that if the antibody is developed against a compound with a very similar structure, crossreactivity will likely occur. In conclusion, it was reasonable that dobutamine which has a very similar structure to RAC showed 7.5% crossreactivity with RAC.
3.2.2. Precision of the ELISA Assay
The assay precision was studied by determining intra-assay and inter-assay reproducibilities. Results were obtained from 9 replicate experiments. The variations in percent inhibition in the intra-assay for 20, 5, 1.25, 0.31, 0.08, and 0.02 ng/mL RAC tested in a microplate were 0.5, 1.5, 4.6, 7.6, 16.1, and 29.6%, respectively. The inter-assay of the same material run over 6 months resulted in deviations from the means of 2.4, 4.7, 7.6, 10.1, 24.8, and 32.4%, respectively. The deviation became higher with decreasing concentration. It seemed likely that antibody sensitivity to these low concentrations was poor and so reproducibility was greatly reduced.
3.2.3. Stabilizations of the RAC Antibody and the Enzyme Conjugate
A rapid and reliable test is needed under extreme ambient temperature. Appropriate assays in accelerated trials such as the use of half-lives greater than 7 days at 37°C are predictive of 6–12 months stability at 4°C. Therefore, stability trials were carried out with RAC antibodies stored at 4°C, room temperature, and 37°C for 30 days. Similar studies were also performed with the peroxidase conjugates for 7 days. Tables 1 and 2 show the results of the stability assays for the antibodies and enzyme conjugates, respectively. There was not a striking change in the IC50 value of the RAC antibody stored at different temperatures for 30 days, and none for the enzyme conjugates stored for 7 days. Moreover, color loss was not observed for both rapid assays during the experimental period. This indicated that temperature could not easily affect the activities of the RAC antibody and enzyme conjugate. Therefore, it is reasonable to conclude that both the antibody and enzyme tracer are stable enough to be used in subsequent tests, and even to produce a RAC-ELISA test kit.
Table 1.
Stability of the RAC-antibody.
| Storage days | IC50 ± SD (ng mL−1, n = 3) | IC15 ± SD (ng mL−1, n = 3) | ||||
|---|---|---|---|---|---|---|
| 4°C | Room temperature | 37°C | 4°C | Room temperature | 37°C | |
| 1 | 0.62 ± 0.034 | 0.72 ± 0.046 | 0.75 ± 0.053 | 0.07 ± 0.004 | 0.09 ± 0.006 | 0.08 ± 0.004 |
| 3 | 0.48 ± 0.033 | 0.55 ± 0.036 | 0.61 ± 0.068 | 0.05 ± 0.005 | 0.06 ± 0.005 | 0.06 ± 0.005 |
| 5 | 0.74 ± 0.035 | 0.69 ± 0.041 | 0.77 ± 0.051 | 0.08 ± 0.006 | 0.07 ± 0.006 | 0.07 ± 0.005 |
| 7 | 0.53 ± 0.038 | 0.56 ± 0.047 | 0.65 ± 0.063 | 0.05 ± 0.004 | 0.08 ± 0.007 | 0.09 ± 0.006 |
| 30 | 0.53 ± 0.045 | 0.64 ± 0.063 | 0.61 ± 0.052 | 0.06 ± 0.007 | 0.07 ± 0.007 | 0.07 ± 0.006 |
Table 2.
Stability of the enzyme tracer.
| Storage days | IC50 ± SD (ng mL−1, n = 3) | IC15 ± SD (ng mL−1, n = 3) | ||||
|---|---|---|---|---|---|---|
| 4°C | Room temperature | 37°C | 4°C | Room temperature | 37°C | |
| 1 | 0.61 ± 0.035 | 0.54 ± 0.039 | 0.53 ± 0.042 | 0.06 ± 0.004 | 0.05 ± 0.005 | 0.05 ± 0.005 |
| 3 | 0.42 ± 0.037 | 0.47 ± 0.035 | 0.44 ± 0.044 | 0.04 ± 0.005 | 0.04 ± 0.006 | 0.04 ± 0.005 |
| 5 | 0.61 ± 0.036 | 0.58 ± 0.032 | 0.83 ± 0.046 | 0.06 ± 0.004 | 0.07 ± 0.004 | 0.08 ± 0.006 |
| 7 | 0.66 ± 0.038 | 0.53 ± 0.041 | 0.90 ± 0.052 | 0.07 ± 0.005 | 0.06 ± 0.006 | 0.10 ± 0.007 |
3.3. Matrix Effect and Their Removal
Immunoassays are a rapid and convenient analysis method for food samples as they usually do not require sample preconcentration and clean-up steps. However, ELISA methods may have high potential risks for nonspecific binding between the nontarget analytes and antibodies, and are consequently prone to matrix interferences. Chemical compounds present in samples or sample extracts such as proteins, fat, and others, might nonspecifically affect the binding of the antibody and analytes, and might also affect other aspects of the assay. These so-called “matrix effects” can reduce the sensitivity and reliability of the competitive immunoassay. Matrix effects are more pronounced in direct immunoassays where not only the specific antibodies but also the enzyme conjugate are under the influence of the sample matrix. Several methods can be used to determine matrix effects. Typically, interferences are quantified by comparing a standard curve prepared in buffer such as PBS with a calibration curve generated in the sample matrix known to be free of the analyte. If the 2 curves are superposable, the effect of the matrix is not significant, and the samples can be analyzed using the standard curve prepared in the matrix-free solution.
In the present assay, the matrix effects of our samples were analyzed using direct competitive ELISA. RAC standard curves were prepared in PBS buffer, and in dilutions of extracts of RAC-free samples to determine whether nonspecific interferences could be eliminated. In order to obtain a rapid, simple, and effective sample extraction method, several extraction solvents including methanol, ethanol, acetonitrile, and PBS buffer were tested.
Significant matrix interference was found when the sample organic solvent extracts were diluted 5 folds in PBS buffer. Further dilution of the sample organic solvent extracts in PBS buffer could not reduce matrix interference. Even the addition of fish skin gelatin (FG), skimmed milk powder, and Tween-20 to the organic solvent extracts could not reduce the nonspecific interactions, and lowered the amount of developed color in the assay. When PBS buffer was used as the extraction solvent alone without any organic solvent or enshrouding reagent, the extracts were used without any further dilution and could be analyzed directly. The standard curves prepared in RAC-free sample extract and in PBS buffer alone were superposable, and the matrix interference problem was easily resolved.
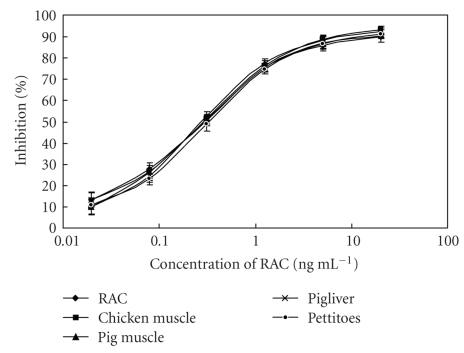
The calibration curves were created by direct competitive ELISA using blank samples spiked with 6 different concentrations of RAC. Figure 5 shows the comparison of the standard curves of RAC in extracts prepared in the 4 RAC-free samples and in PBS buffer alone. Considering the dilutions of the sample extracts, the detection limit of the assay in the blank samples was 0.2 μg/kg which was much lower than that of the maximum residue levels (MRLs) for RAC in these matrices. Thus, the loss in assay sensitivity was acceptable.
Figure 5.
Standard curves of ractopamine in PBS buffer and in 4 sample extracts (n = 3).
3.4. Recovery Study
To investigate the efficiency of the extraction method, 4 types of edible food samples were fortified with RAC at 3 different levels, and were analyzed by the established direct competitive ELISA method. Each sample was evaluated at least 3 times to verify repeatability. The results are shown in Table 3. It was found that all the recoveries of the RAC residues in these samples were less than 100%, and those in pig liver samples were little lower than those in other samples. Since the presence of water in these samples makes the amount of the whole extract bigger than that of PBS that had been added prior to extraction, the final concentration of RAC is lower than that in theory. Therefore, it is reasonable to conclude that pig liver with a higher quantity of water shows a lower recovery than those of other samples.
Table 3.
Recovery studies of 4 samples at 3 levels by ELISA.
| Samples | Fortification level | Results (n = 3) | ||
|---|---|---|---|---|
| (μg/kg) | Mean ± S.D. (μg/kg−1) | Recovery (%) | CV (%) | |
| Chicken muscle | 0.5 | 0.37 ± 0.03 | 73.33 | 8.33 |
| 2.0 | 1.41 ± 0.14 | 70.33 | 9.68 | |
| 8.0 | 6.43 ± 0.06 | 80.42 | 0.89 | |
| Pig muscle | 0.5 | 0.38 ± 0.04 | 76.73 | 10.23 |
| 2.0 | 1.41 ± 0.11 | 70.60 | 7.66 | |
| 8.0 | 5.7 ± 0.26 | 71.25 | 4.64 | |
| Pig liver | 1.0 | 0.68 ± 0.06 | 67.67 | 9.50 |
| 2.0 | 1.33 ± 0.15 | 66.67 | 11.36 | |
| 5.0 | 3.07 ± 0.20 | 61.33 | 6.59 | |
| Pettitoes | 0.5 | 0.41 ± 0.03 | 81.33 | 8.19 |
| 2.0 | 1.55 ± 0.08 | 77.33 | 5.22 | |
| 8.0 | 6.13 ± 0.45 | 76.67 | 7.42 | |
3.5. Correlation Studies between ELISA and HPLC Analysis
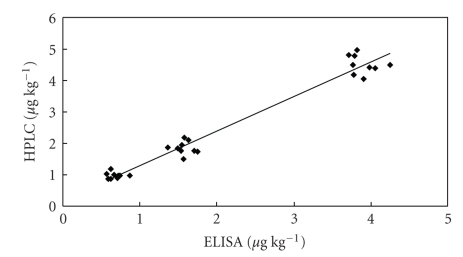
Due to its more complicated chemical component structure, pig liver was chosen as the representative sample in the validation studies. Pig liver samples were spiked with RAC at 0, 1, 2, 5 μg/kg, respectively. After sample extraction and clean-up on a solid-phase extraction column, the purified extract was analyzed by HPLC and ELISA. The analytical results obtained with the two methods for the same extract were shown in Figure 6. Good correlations were obtained for the samples (R2 = 0.9677).
Figure 6.
Correlation between ELISA and HPLC results for purified pig liver spiked with ractopamine at three levels (y = 1.097x + 0.1978, R2 = 0.9677, n = 9).
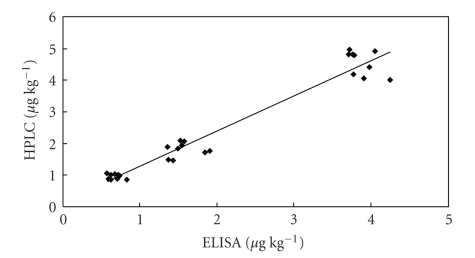
Also, the spiked pig liver was analyzed by the established ELISA with a simple extraction procedure. Figure 7 shows the correlations between the results of HPLC with more complicated extraction and clean-up procedures and ELISA with a simple extraction procedure. Despite the fact that in this case the comparison was established with samples subjected to different treatments, the results correlated well (R2 = 0.9517). These results indicate that the developed ELISA method can be used as a rapid screening method for the analysis of RAC in food samples.
Figure 7.
Correlation between ELISA and HPLC results for non-purified pig liver spiked with ractopamine at three levels (y = 1.1125x + 0.1669, R2 = 0.9517, n = 9).
3.6. Application in the Analysis of Real Food Samples
3.6.1. Deconjugation of RAC Glucuronide Metabolites
Ractopamine is converted to glucuronide metabolites by the animal to which it is administered. So, it is important to detect the RAC metabolites for a newly established ELISA. Due to the lack of RAC glucuronide metabolites, they were not involved in the cross-reactivity profile of the antibody. Before the analysis of the real food samples, β-glucuronidase was used to deconjugate the RAC glucuronide metabolites and prove indirectly if the antibody has the adequate binding of glucuronide metabolites.
Real food samples with precise RAC concentration (validated by HPLC-MS according to China national analysis standard method, GBT 22147-2008) were offered by Tianjin Entry-Exit Inspection and Quarantine Bureau (export and import samples, including pig muscle, pig liver, pettitoes). The results showed that there is no obvious difference in the RAC concentration of the sample extracts with and without enzymatic hydrolysis, so we believe that the produced RAC antibody has the ability of adequate binding with the RAC glucuronide metabolites. Theoretically speaking, PBS should be an appropriate extraction solution for both RAC and the glucuronide metabolites due to the solubility of them in PBS. So, RAC glucuronide metabolites can be analysed by the established ELISA system without deconjugation by glucuronidase.
3.6.2. Analysis of Real Food Samples
The real food samples were analysed by the established rapid ELISA system. The results were compared with the validated results (shown in Table 4).
Table 4.
Analysis results of real food samples obtained by ELISA and comparison with validated results.
| Sample | ELISA resultsa (μg/kg) (n = 3) | Validated resultsb (μg/kg) | |
|---|---|---|---|
| Pig muscle | 1 | — | — |
| 2 | — | — | |
| 3 | — | — | |
| 4 | — | — | |
| 5 | — | — | |
| 6 | |||
| 7 | 1.8 ± 0.13 | 2.3 | |
| Pig liver | 1 | — | — |
| 2 | — | — | |
| 3 | — | — | |
| 4 | 2.3 ± 0.11 | 3.3 | |
| 5 | 3.4 ± 0.12 | 3.7 | |
| 6 | 5.2 ± 0.18 | 6.1 | |
| 7 | 3.5 ± 0.19 | 4.2 | |
| 1 | — | — | |
| 2 | — | — | |
| Pettitoes | 3 | — | — |
| 4 | — | — | |
| 5 | — | — | |
| 6 | — | — | |
a, —, RAC concentration was less than LOD of the assay (0.2 μg/kg);
b, Validated results was offered by Tianjin Entry-Exit Inspection and Quarantine Bureau; —, RAC concentration was less than LOD of the assay (1.0 μg/kg).
In analysis of the 20 food samples using the direct competitive ELISA resulted in 15 samples being negative (RAC concentration was less than LOD of the assay). Although the results obtained by ELISA was lower than the validated results, they correlated well (R2 = 0.9605), indicating the precision of the ELISA analytical system and the availability of it for the analysis of real food samples.
4. Conclusions
The developed ELISA method with a high sensitivity and specificity is suitable for the routine screening detection of ractopamine residues in chicken muscle, pettitoes, pig muscle, and liver. The sample extraction method is quite simple and rapid. Although the recoveries are not very high, the detection limits (0.2 μg/kg) from the direct competitive ELISA for these samples are low enough for the levels of MRL (10 μg/kg for muscle, 90 μg/kg for liver in Japan). The stabilities of the RAC antibody and RAC enzyme tracer together with the good correlation (R2 = 0.9517) between the analytical results of HPLC and ELISA demonstrate the accuracy of the developed ELISA procedure, confirming its reliability for applications in the rapid screening of RAC in food samples.
Acknowledgments
The authors are grateful for the financial supports from the Ministry of Science and Technology of the People's Republic of China (Project no. 2006BAD27B02) and from the National Natural Science Foundation of China (Project no. 20775054).
References
- 1.Brambilla G, Cenci T, Franconi F, et al. Clinical and pharmacological profile in a clenbuterol epidemic poisoning of contaminated beef meat in Italy. Toxicology Letters. 2000;114(1–3):47–53. doi: 10.1016/s0378-4274(99)00270-2. [DOI] [PubMed] [Google Scholar]
- 2.Crome PK, McKeith FK, Carr TR, Jones DJ, Mowrey DH, Cannon JE. Effect of ractopmine on growth performance, carcass composition and cutting yields of pogs slaughtered at 107 kg and 125 kg. Journal of Animal Science. 1996;74(4):709–716. doi: 10.2527/1996.744709x. [DOI] [PubMed] [Google Scholar]
- 3.Watkins LE, Jones DJ, Mowrey DH, Anderson DB, Veenhuizen EL. The effect of various levels of ractopamine hydrochloride on the performance and carcass characteristics of finishing swine. Journal of Animal Science. 1990;68(11):3588–3595. doi: 10.2527/1990.68113588x. [DOI] [PubMed] [Google Scholar]
- 4.Engeseth NJ, Lee KO, Bergen WG, Helferich WH, Knudson BK, Merkel RA. Fatty acid profiles of lipid depots and cholesterol concentration in muscle tissue of finishing feed ractopamine. Journal of Food Science. 1992;57:1060–1062. [Google Scholar]
- 5.Xiong YL, Gower MJ, Li C, Elmore CA, Cromwell GL, Lindemann MD. Effect of dietary ractopamine on tenderness and postmortem protein degradation of pork muscle. Meat Science. 2006;73(4):600–604. doi: 10.1016/j.meatsci.2006.02.016. [DOI] [PubMed] [Google Scholar]
- 6.Moody DE, Hancock DL, Anderson DB. Farm Animal Metabolism and Nutrition: Critical Reviews. Wallingford, UK: CAB International; 2000. Phenethanolamine repartitioning agents; pp. 65–96. [Google Scholar]
- 7.FDA. New animal drugs for use in animal feeds: ractopamine hydrochloride. Federal Register. 2000;65:4111–4112. [Google Scholar]
- 8.Turberg MP, Macy TD, Lewis JJ, Coleman MR. Determination of ractopamine hydrochloride in swine, cattle, and turkey feeds by liquid chromatography with coulometric detection. Journal of AOAC International. 1994;77(4):840–847. [PubMed] [Google Scholar]
- 9.Shishani E, Chai SC, Jamokha S, Aznar G, Hoffman MK. Determination of ractopamine in animal tissues by liquid chromatography-fluorescence and liquid chromatography/tandem mass spectrometry. Analytica Chimica Acta. 2003;483(1-2):137–145. [Google Scholar]
- 10.Antignac JP, Marchand P, Le Bizec B, Andre F. Identification of ractopamine residues in tissue and urine samples at ultra-trace level using liquid chromatography-positive electrospray tandem mass spectrometry. Journal of Chromatography B. 2002;774(1):59–66. doi: 10.1016/s1570-0232(02)00205-2. [DOI] [PubMed] [Google Scholar]
- 11.Churchwell MI, Holder CL, Little D, Preece S, Smith DJ, Doerge DR. Liquid chromatography/electrospray tandem mass spectrometric analysis of incurred ractopamine residues in livestock tissues. Rapid Communications in Mass Spectrometry. 2002;16(13):1261–1265. doi: 10.1002/rcm.717. [DOI] [PubMed] [Google Scholar]
- 12.Wang JP, Li XW, Zhang W, Shen JZ. Development of immunoaffinity sample-purification for GC-MS analysis of ractopamine in swine tissue. Chromatographia. 2006;64(9-10):613–617. [Google Scholar]
- 13.Shelver WL, Smith DJ. Development of an immunoassay for the β-adrenergic agonist ractopamine. Journal of Immunoassay. 2000;21(1):1–23. doi: 10.1080/01971520009349496. [DOI] [PubMed] [Google Scholar]
- 14.Shelver WL, Smith DJ, Berry ES. Production and characterization of a monoclonal antibody against the β-adrenergic agonist ractopamine. Journal of Agricultural and Food Chemistry. 2000;48(9):4020–4026. doi: 10.1021/jf000528n. [DOI] [PubMed] [Google Scholar]
- 15.Wang JP, Zhang SX, Shen JZ. Technical note: a monoclonal antibody-based immunoassay for determination of ractopamine in swine feeds. Journal of Animal Science. 2006;84(5):1248–1251. doi: 10.2527/2006.8451248x. [DOI] [PubMed] [Google Scholar]
- 16.Elliott CT, Thompson CS, Arts CJM, et al. Screening and confirmatory determination of ractopamine residues in calves treated with growth promoting doses of the β-agonist. Analyst. 1998;123(5):1103–1107. doi: 10.1039/a708697k. [DOI] [PubMed] [Google Scholar]
- 17.Wang S, Allan RD, Skerritt JH, Kennedy IR. Development of a class-specific competitive ELISA for the benzoylphenylurea insecticides. Journal of Agricultural and Food Chemistry. 1998;46(8):3330–3338. doi: 10.1021/jf9812984. [DOI] [PubMed] [Google Scholar]
- 18.Wicker AL, Turberg MP, Coleman MR. Evaluation of ractopamine cross-reactivity in several commercially available β-agonist enzyme immunoassay kits. Analyst. 1995;120(12):2879–2881. doi: 10.1039/an9952002879. [DOI] [PubMed] [Google Scholar]


