Abstract
Osteoarthritis and avascular necrosis are common clinical entities with unknown etiologies. Recently, vascular changes have been implicated in the pathogenesis of both conditions. This review discusses the use of novel non-invasive imaging techniques, using dynamic contrast-enhanced magnetic resonance imaging, as a means of assessing bone perfusion and therefore quantifying differences seen in both osteoarthritis and avascular necrosis. We have found changes in fluid dynamics in both osteoarthritis and avascular necrosis as compared to normal bone as well as changes between osteoarthritis and avascular necrosis. Review of our human data suggest that the magnetic resonance imaging contrast dye is retained for longer periods of time, suggesting decreased perfusion out of regions of osteoarthritis and avascular necrosis. This finding was corroborated in a guinea-pig animal model of osteoarthritis. Use of such a non-invasive measure of assessing bone perfusion could be useful in the diagnosis, prevention, and treatment of not only osteoarthritis and avascular necrosis but many other entities that affect the musculoskeletal system.
Keywords: Osteoarthritis, MRI, animal model, guinea pig, subchondral, venous outflow occlusion
Introduction
The pathophysiology of osteoarthritis (OA) and avascular necrosis (AVN) remain unknown. In both cases, the late pathology of the disease is clear, but the events that lead up to ultimate joint degeneration are not well understood. Usually, the disease is not discovered until late in its course when only surgical or palliative methods are available. Early detection could allow for targeting of aspects of the disease pathophysiology and thus alter or stop the course of the disease.
Recent work has suggested that both OA and AVN may have early vascular components that change underlying bone perfusion in the affected bone and joint and thus contribute to the clinical cascade of each disease1, 2. Measuring blood flow in bone in the region of a synovial joint is difficult, particularly if it is to be done in a non-invasive manner. Invasive techniques exist, such as radioactive microsphere methods, but availability of technology for such techniques preclude their use in humans3. We have applied a technique to assess bone perfusion by non-invasive methods to study the vascular components of OA and AVN.
Dynamic Contrast Enhanced Magnetic Resonance Imaging (DCE-MRI), a technique initially utilized in brain imaging, can be employed as a way to accurately and non-invasively quantify bone perfusion in a synovial joint. This method uses a standard MRI contrast agent (Gd-DTPA) and is easily and safely performed in both laboratory animals and in humans. Changes in bone perfusion are related to bone marrow edema, a common clinical finding seen in MRI. The presence of bone marrow edema is widespread and is seen in many entities from trauma, to OA and AVN.
Numerous clinical studies have associated bone marrow edema, or bone marrow lesions as they are sometimes called, with pain, bone remodeling, and cartilage degeneration4. The causes of the marrow signal changes of edema seen on MRI and the pathologic significance of the MRI finding of bone marrow edema are uncertain5. It is thought that bone marrow edema can be a marker of altered fluid dynamics and thus could indicate changes in intra-osseous pressure as well as blood flow. Such changes in fluid dynamics are thought to drive the secretion of cytokines that contribute to the regulation of bone remodeling and cartilage degeneration. Traditional MRI is not capable of extracting such kinetic parameters as bone perfusion, but dynamic contrast-enhanced MRI (DCE-MRI) as presented here, is capable of extracting such data in a non-invasive way.
High signal intensity as seen on T2-Weighted images signifies high water content and therefore it is thought that bone marrow edema is a radiographic marker of increased intraosseous pressure and changes in blood flow. Intraosseous hypertension has been related to bone pain in several joints and elevated intraosseous pressure has been observed in osteoarthritis of the hip and knee6–8. Conventional contrast studies have demonstrated venous engorgement and stasis associated with intraosseous hypertension in OA of the hip8. Similar elevations of intraosseous pressure were found in patients with OA of the knee7. Patients without OA but with knee pain also exhibited intraosseous hypertension but patients without OA and without pain had normal intraosseous pressures. Reduction of pressure by fenestration, or core decompression, is accompanied by a reduction in pain. Osteotomy of the proximal femur reduces both intraosseous pressure and pain in patients with OA of the hip8. These observations collectively suggest that changes in fluid dynamics resulting in intraosseous hypertension are associated with bone pain and arthritis. These findings coupled with bone marrow edema as seen on traditional MRI lead us to use DCE-MRI to non-invasively assess bone perfusion.
The following manuscript describes a method to assess bone perfusion with contrast-enhanced magnetic resonance imaging in both human patients and animals. By comparing the imaging data with histological data, we demonstrate that regions of edema and decreased perfusion temporally precede and spatially co-localize with eventual cartilage degeneration, the final common pathway in both OA and AVN.
Methods
The use of contrast-enhanced MRI was evaluated in human patients and with an animal model. In both human and animal studies, DCE-MRI was utilized and techniques were similar for the two groups. Specific techniques are described in detail elsewhere and are beyond the scope of this report9. In both cases, MRI data were acquired and dynamic perfusion data were extracted using mathematical modeling based on the Brix two-compartment pharmacokinetic model10–12. In brief, the Brix two-compartment model is capable of producing perfusion parameters such as perfusion in to and out of a region of interest (such as the region of subchondral bone adjacent to an arthritic joint). The rate of perfusion into such regions is also calculated.
Human data were collected from adult patients with painful bone marrow edema associated with OA or AVN. Each patient underwent a DCE-MRI scan for conditions such as infection, synovitis, fractures, and other conditions associated with bone marrow edema. Thirteen patients carried a diagnosis of OA while 9 had AVN. The mean patient age was 52 (range = 22 – 92). Briefly, DCE-MRI was performed with a 1.5T magnet using standard clinical coils. Gd-DTPA was injected by power-injector via large bore peripheral IV at a standard concentration of 0.1 mmol per kilogram. The focus of bone marrow edema was studied with eight continuous slices, 5 mm each. During data acquisition TR was 5.5 and TE was 2.89. Data was obtained for 15-seconds after the injection initiation and was collected every 10-seconds for the ensuing 5-minutes. Neighboring areas of non-edematous bone were used as internal controls.
Human data invariably is fraught with confounding factors and longitudinal studies are difficult in humans. The Dunkin-Hartley guinea pig model is ideally suited to study the progression of OA. Considerable resemblance exists between human and Dunkin-Hartley guinea pig OA both histologically and biochemically. Additionally, just as in human OA, lesions appear preferentially on the medial aspect of the knee joint. Furthermore, the arthritis develops spontaneously without any required surgical intervention and the progression of arthritis over time has been well characterized13–15.
DCE-MRI was performed as reported elsewhere9. In brief, 4 different ages were selected (6 animals per group for a total of 24 animals) to study perfusion parameters at different stages of osteoarthritis (6, 9, 12, and 15-months); these ages were selected based on well-characterized documentation of OA development13, 16. All animals were acquired from Charles River Laboratories; central venous (jugular) catheters were surgically placed by Charles River to ensure reliable venous access for Gd-DTPA perfusion studies. Imaging studies were conducted on a 3.0 T MRI. Data were acquired via a fast multiplanar spoiled gradient echo sequence with 4 – 7 slices, and a 12.1/3.8 ms TR/TE. A fast spin-echo short tau inversion recovery (STIR) was also acquired to visualize bone marrow edema (TR = 6650 ms; TI = 180 ms; TE = 45 ms). The central line remained patent in all cases and was used to manually inject the Gd-DTPA in all cases (0.3 mmol/kg). After all imaging was completed, animals were euthanized and tibias were harvested for measurement of subchondral bone thickness and histochemistry. Specimens were de-calcified and prepared using Safranin-O / Fast Green stain.
Histologic cartilage grade was assessed by using the well-established method of Mankin17. Subchondral plate thickness was digitally measured at the central third of both the medial and the lateral tibial plateaus. All data were analyzed as mean + standard error of the mean (SEM) and significance was determined by means of parametric and non-parametric tests as was deemed appropriate based on the sample sizes and distributions.
Results
Human Data
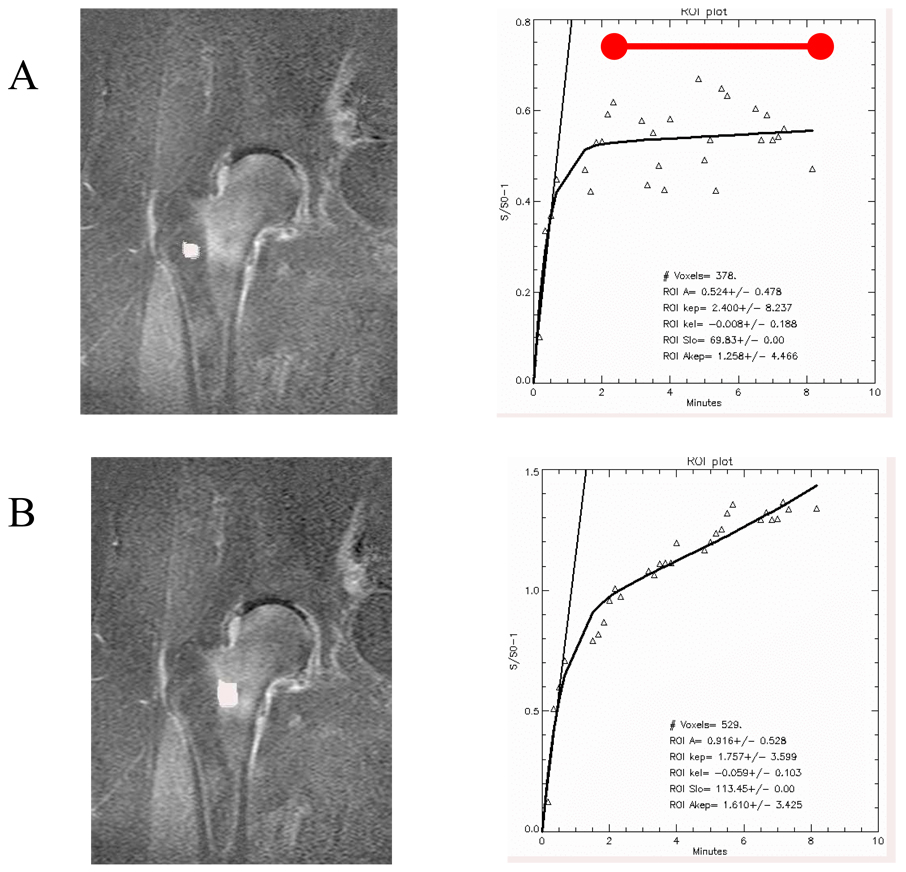
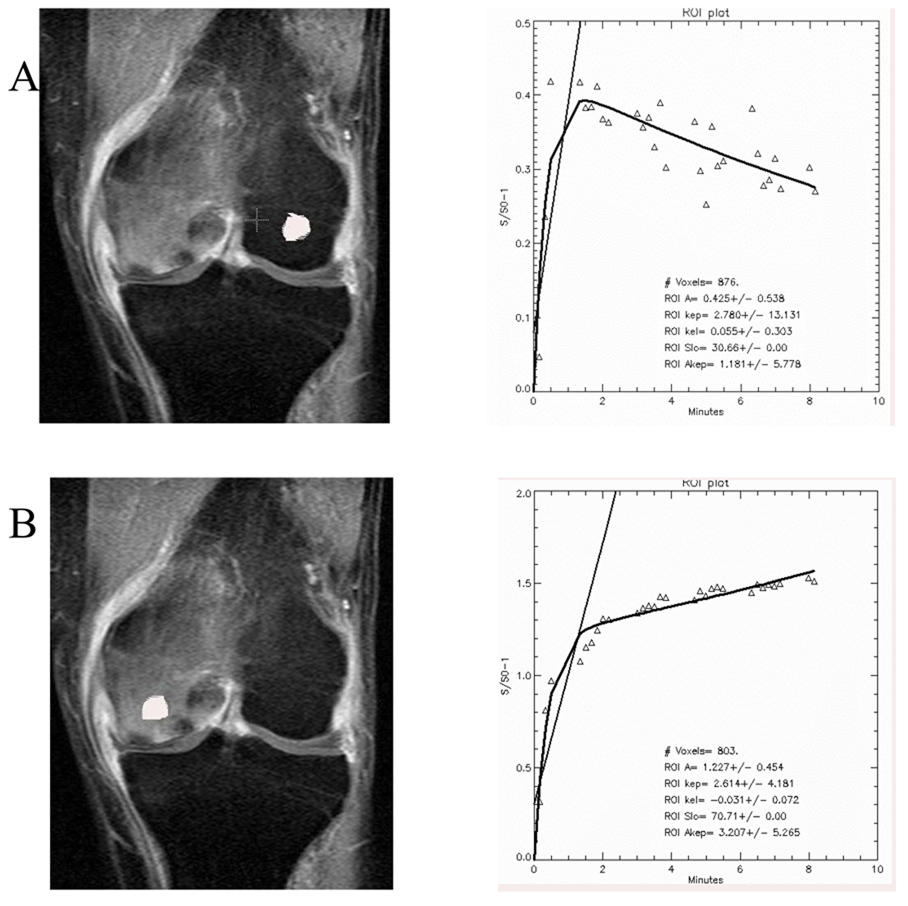
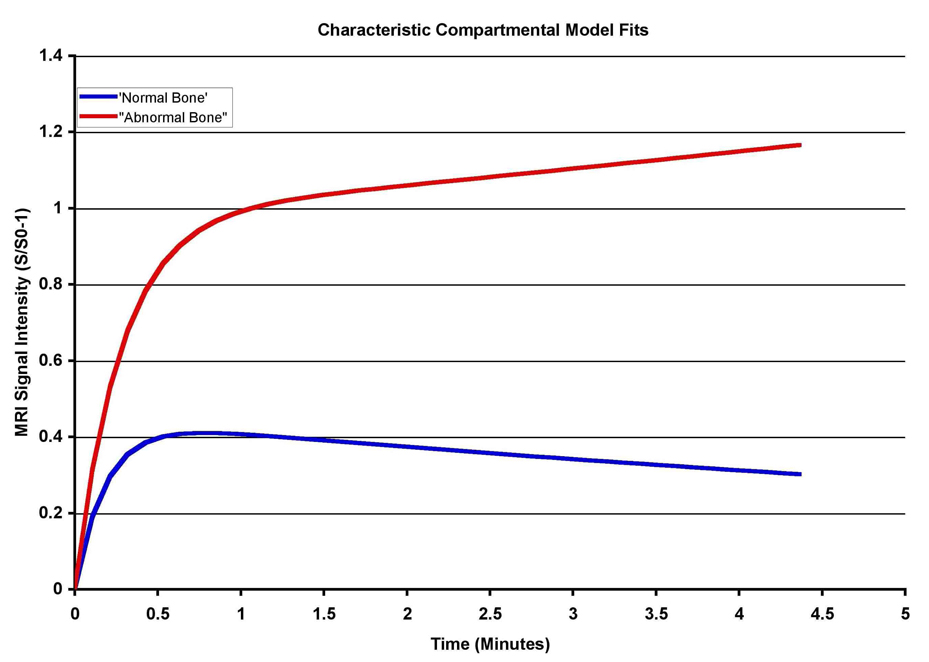
Sample regions of interest (ROIs) with associated time intensity curves (TICs) are presented in Figure 1 (hip) and Figure 2 (knee). In both of these examples, note the difference in the shape of the curve on the right-hand side of the figure, as indicated by the red bar above the data curve in Figure 1. Regions of edema are depicted here with a continued rise in value over time, whereas regions without edema show decreased values over time. The later time points on these graphs are basically the “wash-out” phase for the contrast material. Failure to “wash out” can be interpreted as stasis or outflow obstruction. Such outflow obstruction was noted to be more extreme in the knee as compared to the hip, possibly due to more contrasting anatomic regions (medial v. lateral femoral condyle or tibial plateau). Differences in morphology, infrastructure, and patterns of vascularization can also account for observed differences between the hip and the knee. Data were pooled for the entire population and pharmacokinetic modeling was used to extract quantitative parameters (Table 1). The three parameters are slope, amplitude (A), and perfusion out of the region of interest (kel). Slope and amplitude were significantly greater in bone marrow edema as compared to normal bone. Perfusion out of the region of interest was significantly lower in bone marrow edema as compared to normal bone. The fact that kel is lower in regions of bone marrow edema means that the edematous bone retains the Gd-DTPA to a greater degree and for a longer time than regions without edema, within the 5-minute scan time utilized in the experiments (Figure 3).
Figure 1.
Regions of interest and time intensity curves of normal (A) and marrow edema (B) in the human hip. Signal enhancement is observed in the proximal femur with bone marrow edema. Differences in amplitude, slope, and outflow are noted. The images are subtraction images showing enhancement at the end of the time course minus the baseline image intensity. The red bar above the data curve indicates the “wash-out” phase. (Reproduced with permission, Aaron et al., Wiley18).
Figure 2.
Regions of interest and time-intensity curves in the human knee in normal (A) and marrow edema (B) demonstrating signal enhancement with Gd-DTPA in the abnormal femoral condyle. Differences in amplitude, slope, and outflow are observed. (Reproduced with permission, Aaron et al., Wiley18).
Table 1.
Data extracted using the pharmacokinetic model (mean ± SEM). When compared to normal bone, slope was greater in subjects with bone marrow edema. Amplitude of the data (A) was also significantly greater by a factor of 2.5 in bone with marrow edema as compared to normal bone. kel, the parameter indicating perfusion out of the region of interest, showed a negative value in patients with bone marrow edema as compared to a statistically significant positive value in normal bone.
| Normal | Bone Marrow Edema | P-value | |
|---|---|---|---|
| Slope | 50 + 7.1 | 95.2 + 9.3 | 0.001 |
| A | 0.44 + 0.06 | 0.99 + 0.08 | 0.0001 |
| kel | 0.09 + 0.04 | −0.04 + 0.01 | 0.001 |
Figure 3.
Time intensity curves of populations with normal bone and bone with marrow edema drawn from the kinetic parameters in slope, A, and kel representing inflow and outflow characteristics. Resolution of signal enhancement is beginning in normal bone by 3 – 4 minutes of scan time, whereas signal enhancement continues to rise in bone with marrow edema. This is interpreted as reflecting outflow obstruction and decreased perfusion. (Reproduced with permission, Aaron et al., Wiley18).
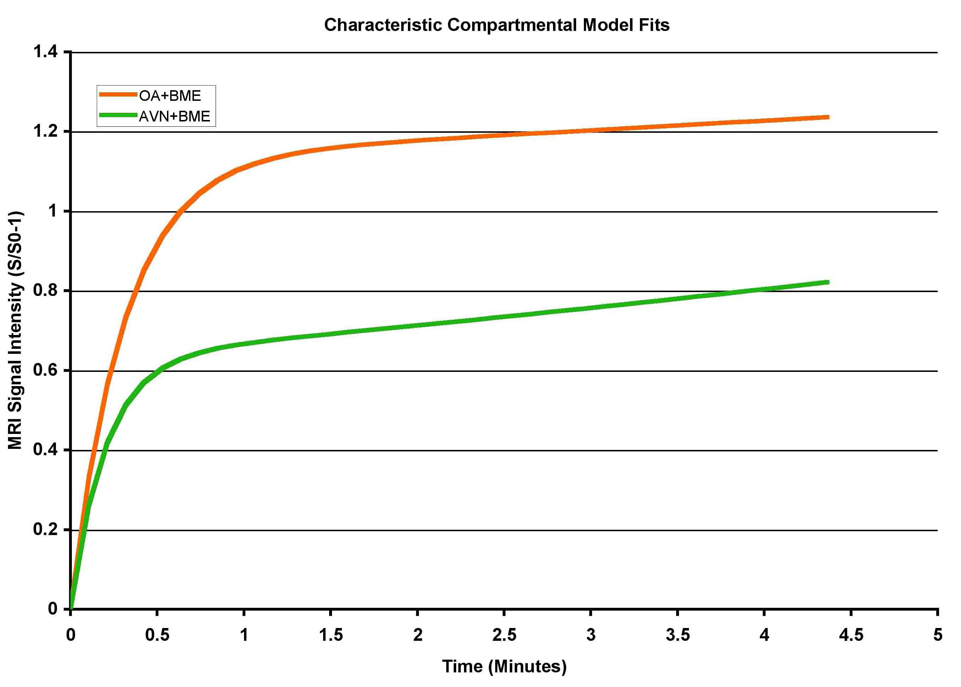
If the AVN patients are compared to the OA patients, another phenomenon is found. As seen in Figure 4, based on data from 13 OA and 9 AVN patients, decreased perfusion out of the region of interest is seen in both AVN and OA, and the initial slope is the same. However, the amplitude is much lower in AVN as compared to the OA patients. This finding suggests that one might be able to differentiate between OA and AVN by using the amplitude of the time intensity curves. Why this difference was observed is unclear and may be related to changes in capillary permeability in the regions of pathology.
Figure 4.
Time intensity curves of a population of patients with abnormal edema, separated by type of pathology (either AVN or OA). Interestingly, slope and kel are similar for both pathologies, but the amplitude is much less in AVN as compared to OA.
Guinea Pig Data
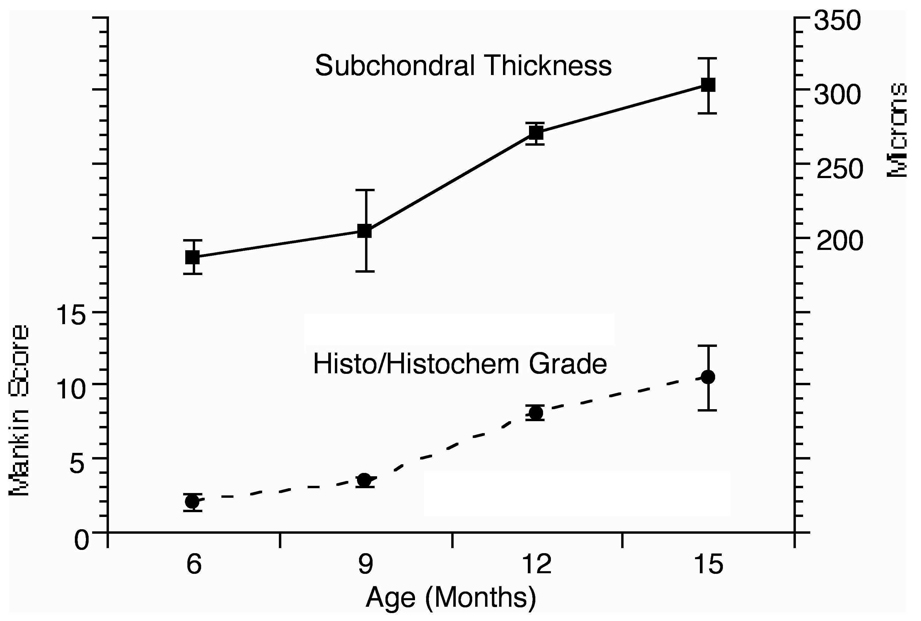
Histologic changes observed in this study were consistent with previous reports described in the literature. Figure 5 presents histologic data as well as data reporting the subchondral bone thickness. Significant changes in histology are seen between the 9-month and the 12-month time point, concomitant with an increase in subchondral plate thickness, also starting between the 9-month and 12-month time point.
Figure 5.
Progression of cartilage and bone abnormalities in the Dunkin-Hartley guinea pig model of OA. The Mankin score at 9 months was 3.3 + 0.33 compared to 8.0 + 0.48 at 12 months (p<0.001). Significant increases in medial tibial subchondral bone plate thickness are also observed between 9 and 12 months of age. The thickness at 9 months was 205 + 27.66 microns compared to 270 + 7.32 microns at 12 months (p = 0.003). (Reproduced with permission, Aaron et al., Wiley18).
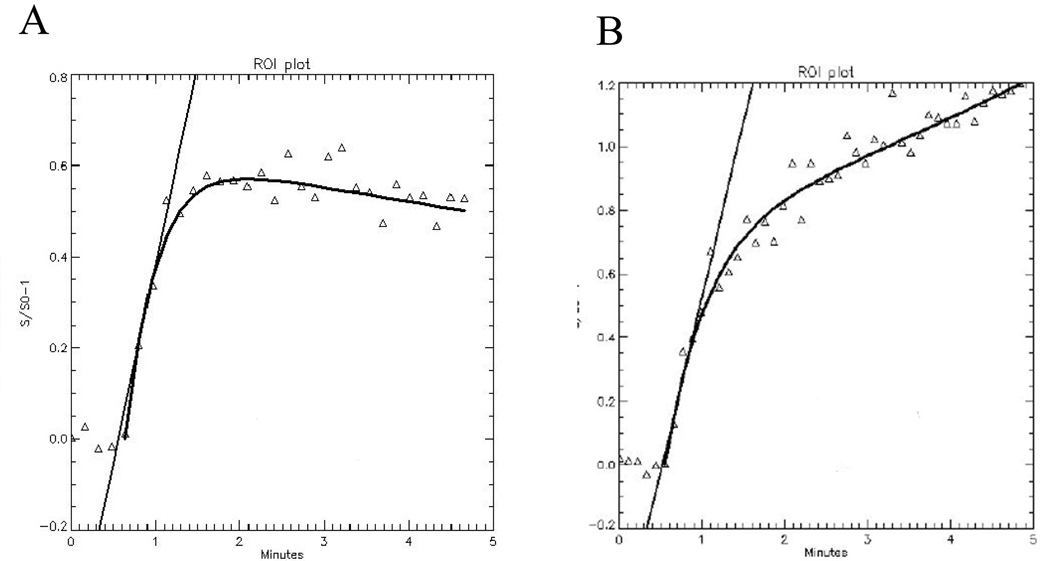
Sample time intensity curves (TICs) are presented in Figure 6. At 6-months of age, before significant OA is present, contrast dye does not collect and is seen to wash-out over the course of the scan (as evidenced by the negative slope towards the end of the TIC). At 12-months, OA has occurred. This example is taken from a region of the medial tibial plateau in a region of subchondral bone below histologically significant OA. As evidenced by the persistent positive slope, the MRI contrast dye pooled in the region of interest, a finding that could be consistent with venous outflow obstruction.
Figure 6.
Time-intensity curves from the medial tibial plateau of the guinea pig. (A) 6-months of age, before morphologic changes of OA, demonstrates normal perfusion with kel = 0.06. (B) 12-month animals with established changes of OA revealed diminished perfusion with kel = −0.11. (Reproduced with permission, Aaron et al., Wiley18).
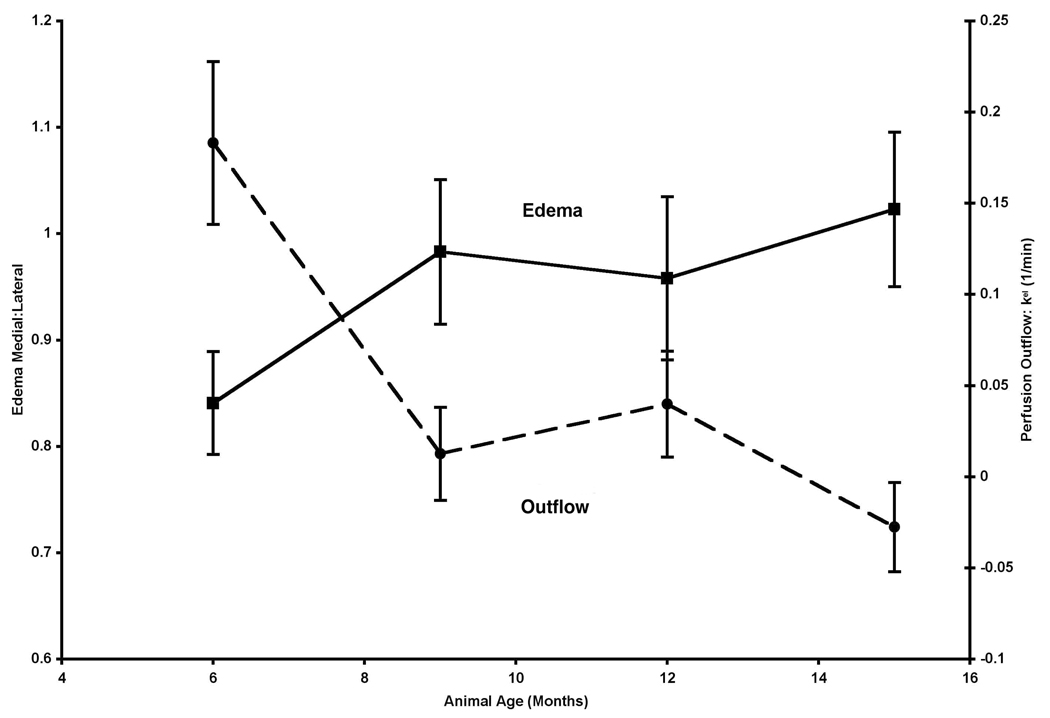
Perfusion into the tibial plateau on both the medial and the lateral sides remained constant at all time points. Figure 7 depicts outflow plotted with bone marrow edema. When these parameters are plotted together one can see that changes in perfusion between the 6-month and the 9-month time points spatially co-localize and temporally precede both changes in cartilage histology and bone remodeling in the medial tibial plateau18. These data are suggestive of both a temporal and spatial relationship of edema to the eventual medial-sided cartilage and bone lesions of OA. Edema of the medial:lateral tibial plateau increased between 6 – 9 months of age but did not reach statistical significance (p = 0.06). Post-hoc power analysis demonstrated that with the same effect sizes and variances, statistical significance would be reached with a sample size of 12.
Figure 7.
Estimation of edema of the subchondral bone is derived from STIR images of ROIs at the medial tibial plateau and adjacent lateral plateau and is expressed as voxel intensity ratio of medial:lateral trabecular bone. Edema of the medial:lateral tibial plateau increased between 6 – 9 months of age but did not reach statistical significance (p = 0.06).
Discussion
OA and AVN are common problems, both of which lead to joint degeneration, pain, and disability. Early signs of both clinical entities may manifest themselves as local changes in the fluid dynamics of the subchondral bone. While this has traditionally been difficult to assess, we present a non-invasive method of using dynamic contrast-enhanced MRI to quantify changes in fluid dynamics. Human data and guinea pig data produced similar results. Regions of bone marrow edema demonstrate changes in perfusion which may suggest venous outflow obstruction in the subchondral bone in areas of bone and cartilage pathology. Tsukamoto et al. used similar dynamic contrast-enhanced MRI techniques in a canine model and validated their findings by using radioactive microsphere methods19.
Our work with an animal model demonstrated that bone marrow edema lesions temporally precede changes in cartilage morphology and spatially localize at the site of eventual bone and cartilage lesions. Perfusion parameters extracted from our pharmacokinetic model point to outflow obstruction as the primary change in kinetic parameters. Such outflow obstruction suggests increases in intraosseous pressure which compound the problem of decreased perfusion.
Estimated intraosseous pressure values can be extracted from our pharmacokinetic data; in the human, normal intraosseous pressure is 26 + 3 mmHg whereas intraosseous pressure in OA is 43 + 4 mmHg20, 21. Estimated value, in our human studies, in regions of OA, is 45 mmHg. Increased intraosseous pressure is one of the possible causative factors responsible for pain.
This is of particular clinical interest since bone marrow edema, or bone marrow lesions are commonly reported in numerous and varied clinical entities. They may exhibit the classic edema pattern observed following an anterior cruciate ligament tear, to the chronic changes observed in end-stage OA. Such pharmacokinetic analysis may prove to be particularly useful if it is able to detect differences in perfusion characteristics in these different clinical scenarios.
The potential pathophysiologic significance of bone marrow edema is in its association with altered fluid dynamics in subchondral bone. It is the osteocytes that secrete cytokines that regulate cartilage degeneration and bone remodeling. Osteocytes have been shown to change their cytokine expression profiles in response to changes in fluid flow, intraosseous pressure, and local oxygen availability. As determined in seminal studies performed by Arnoldi, increases in intraosseous pressure and decreases in oxygen concentrations are seen in AVN and OA8. These studies were done with direct measurements in both animals and in humans and are invasive and technically difficult to perform. DCE-MRI is capable of extracting similar values using non-invasive methods.
While initial observations of hypercoagulability were made in AVN, hypercoagulability has been described in many patients with OA as well1, 2. Clinical studies have demonstrated that patients with end-stage hip arthritis exhibit a high prevalence of vascular-related co-morbidities, including ischemic heart disease and myocardial infarction, and both arterial and venous thrombi including ischemic peripheral vascular disease and deep vein thrombosis22. Data from our group also suggest an increased prevalence of thrombotic disease in patients with OA of the hip1.
In our results presented here, we observed differences in perfusion parameters in OA and AVN. Bone marrow lesions can arise from both trauma as well as OA and AVN and may manifest differences in pathophysiology and vascularity. Changes observed via DCE-MRI may well be produced due to a combination of variances in capillary permeability as well as tissue perfusion and flow. While the specific mechanisms of action are still being isolated, overall clearance of the contrast agent would appear to be decreased in both clinical and animal populations.
The ability to safely and non-invasively image perfusion in bone is a powerful tool that can be used to diagnose and to classify disorders of bone, not only limited to osteoarthritis and avascular necrosis.
Acknowledgments
Funding Support: OREF 6-41285, NIH K24 AR 02128
Footnotes
Publisher's Disclaimer: This is a PDF file of an unedited manuscript that has been accepted for publication. As a service to our customers we are providing this early version of the manuscript. The manuscript will undergo copyediting, typesetting, and review of the resulting proof before it is published in its final citable form. Please note that during the production process errors may be discovered which could affect the content, and all legal disclaimers that apply to the journal pertain.
References
- 1.Aaron RK, Ciombor DM. Pain in osteoarthritis. Med Health R I. 2004 Jul;87(7):205–209. [PubMed] [Google Scholar]
- 2.Cheras PA, Freemont AJ, Sikorski JM. Intraosseous thrombosis in ischemic necrosis of bone and osteoarthritis. Osteoarthritis Cartilage. 1993 Oct;1(4):219–232. doi: 10.1016/s1063-4584(05)80328-0. [DOI] [PubMed] [Google Scholar]
- 3.Okubo M, Kinoshita T, Yukimura T, Abe Y, Shimazu A. Experimental study of measurement of regional bone blood flow in the adult mongrel dog using radioactive microspheres. Clin Orthop Relat Res. 1979 Jan-Feb;(138):263–270. [PubMed] [Google Scholar]
- 4.Felson DT, Chaisson CE, Hill CL, et al. The association of bone marrow lesions with pain in knee osteoarthritis. Ann Intern Med. 2001 Apr 3;134(7):541–549. doi: 10.7326/0003-4819-134-7-200104030-00007. [DOI] [PubMed] [Google Scholar]
- 5.Zanetti M, Bruder E, Romero J, Hodler J. Bone marrow edema pattern in osteoarthritic knees: correlation between MR imaging and histologic findings. Radiology. 2000 Jun;215(3):835–840. doi: 10.1148/radiology.215.3.r00jn05835. [DOI] [PubMed] [Google Scholar]
- 6.Arnoldi CC. Vascular aspects of degenerative joint disorders. A synthesis. Acta Orthop Scand Suppl. 1994 Aug;261:1–82. [PubMed] [Google Scholar]
- 7.Arnoldi CC, Lemperg K, Linderholm H. Intraosseous hypertension and pain in the knee. J Bone Joint Surg Br. 1975 Aug;57(3):360–363. [PubMed] [Google Scholar]
- 8.Arnoldi CC, Linderholm H, Mussbichler H. Venous engorgement and intraosseous hypertension in osteoarthritis of the hip. J Bone Joint Surg Br. 1972 Aug;54(3):409–421. [PubMed] [Google Scholar]
- 9.Lee JH, Dyke JP, Ballon D, Aaron RK, Ciombor DM, Rosenwasser MP. Subchondral Fluid Dynamics in a Model of Osteoarthritis: Use of Dynamic Contrast-Enhanced Magnetic Resonance Imaging. Osteoarthritis Cartilage. 2008 doi: 10.1016/j.joca.2009.03.019. Submitted. [DOI] [PMC free article] [PubMed] [Google Scholar]
- 10.Hoffmann U, Brix G, Knopp MV, Hess T, Lorenz WJ. Pharmacokinetic mapping of the breast: a new method for dynamic MR mammography. Magn Reson Med. 1995 Apr;33(4):506–514. doi: 10.1002/mrm.1910330408. [DOI] [PubMed] [Google Scholar]
- 11.Brix G, Semmler W, Port R, Schad LR, Layer G, Lorenz WJ. Pharmacokinetic parameters in CNS Gd-DTPA enhanced MR imaging. J Comput Assist Tomogr. 1991 Jul-Aug;15(4):621–628. doi: 10.1097/00004728-199107000-00018. [DOI] [PubMed] [Google Scholar]
- 12.Dyke JP, Panicek DM, Healey JH, et al. Osteogenic and Ewing sarcomas: estimation of necrotic fraction during induction chemotherapy with dynamic contrast-enhanced MR imaging. Radiology. 2003 Jul;228(1):271–278. doi: 10.1148/radiol.2281011651. [DOI] [PubMed] [Google Scholar]
- 13.Bendele AM, Hulman JF. Spontaneous cartilage degeneration in guinea pigs. Arthritis Rheum. 1988 Apr;31(4):561–565. doi: 10.1002/art.1780310416. [DOI] [PubMed] [Google Scholar]
- 14.Jimenez PA, Glasson SS, Trubetskoy OV, Haimes HB. Spontaneous osteoarthritis in Dunkin Hartley guinea pigs: histologic, radiologic, and biochemical changes. Lab Anim Sci. 1997 Dec;47(6):598–601. [PubMed] [Google Scholar]
- 15.Wei L, Svensson O, Hjerpe A. Correlation of morphologic and biochemical changes in the natural history of spontaneous osteoarthrosis in guinea pigs. Arthritis Rheum. 1997 Nov;40(11):2075–2083. doi: 10.1002/art.1780401121. [DOI] [PubMed] [Google Scholar]
- 16.Watson PJ, Hall LD, Carpenter TA, Tyler JA. A magnetic resonance imaging study of joint degeneration in the guinea pig knee. Agents Actions Suppl. 1993;39:261–265. doi: 10.1007/978-3-0348-7442-7_32. [DOI] [PubMed] [Google Scholar]
- 17.Mankin HJ, Dorfman H, Lippiello L, Zarins A. Biochemical and metabolic abnormalities in articular cartilage from osteo-arthritic human hips. II. Correlation of morphology with biochemical and metabolic data. J Bone Joint Surg Am. 1971 Apr;53(3):523–537. [PubMed] [Google Scholar]
- 18.Aaron RK, Dyke JP, Ciombor DM, et al. Perfusion abnormalities in subchondral bone associated with marrow edema, osteoarthritis, and avascular necrosis. Ann N Y Acad Sci. 2007 Nov;1117:124–137. doi: 10.1196/annals.1402.069. [DOI] [PubMed] [Google Scholar]
- 19.Tsukamoto H, Kang YS, Jones LC, et al. Evaluation of marrow perfusion in the femoral head by dynamic magnetic resonance imaging. Effect of venous occlusion in a dog model. Invest Radiol. 1992 Apr;27(4):275–281. doi: 10.1097/00004424-199204000-00002. [DOI] [PMC free article] [PubMed] [Google Scholar]
- 20.Kiaer T, Pedersen NW, Kristensen KD, Starklint H. Intra-osseous pressure and oxygen tension in avascular necrosis and osteoarthritis of the hip. J Bone Joint Surg Br. 1990 Nov;72(6):1023–1030. doi: 10.1302/0301-620X.72B6.2246284. [DOI] [PubMed] [Google Scholar]
- 21.Kiaer T, Gronlund J, Sorensen KH. Subchondral pO2, pCO2, pressure, pH, and lactate in human osteoarthritis of the hip. Clin Orthop Relat Res. 1988 Apr;(229):149–155. [PubMed] [Google Scholar]
- 22.Marks R, Allegrante JP. Comorbid disease profiles of adults with end-stage hip osteoarthritis. Med Sci Monit. 2002 Apr;8(4):CR305–CR309. [PubMed] [Google Scholar]


