

Abstract
Epidemiological studies of the senses of olfaction (smell) and gustation (taste) are needed since impairments in these senses have important implications for health. Only a few attempts have been made to measure the prevalence of olfactory and gustatory or taste dysfunction and many methodological challenges remain to be addressed. These challenges differ from those faced in studies based in the clinic or research laboratory. Epidemiological studies of smell and taste represent translational research, since they can be used to understand how findings from laboratory or clinical studies apply to the general population. This paper briefly reviews existing methods for “how” to measure smell and taste dysfunction and then illustrates findings based on prior epidemiological studies to indicate “why” we wish to measure smell and taste functioning in population-based samples. Self report information collected on smell and taste loss in a national sample, the 1994–1995 Disability Sample (Phase I screening) of the National Health Interview Survey (NHIS-D), is contrasted with results provided by an exam-based measure of olfactory impairment in an epidemiological study conducted in Beaver Dam, WI. The comparison of self report and exam-based measures of smell or taste loss leads to the question of how to best define smell or taste impairment in population samples, since unlike other sensory domains (namely, vision and hearing), there are no internationally accepted standards of impairment for the chemosenses. In addition to highlighting existing epidemiological studies, the current development of an NIH Toolbox of brief exam measures is described. Through this symposium, we hope to advance the nascent field of olfactory and taste epidemiology.
Keywords: epidemiology, population studies, prevalence, olfactory impairment, taste impairment, methodological challenges, risk factors
Introduction
Epidemiology has been defined as the study of the distribution of a disease or physiological condition in human populations and of factors that influence this distribution.1 From a slightly different perspective, epidemiology can also be defined as the distribution and determinants of health-related states or events in specified populations and the application of this study to control of health problems.2 Through epidemiological studies, factors that affect health are identified and the relative strength of associations are assessed quantitatively. Epidemiology draws upon several other fields, for example, mathematics and statistics for quantitative methods, biology and medicine for understanding disease processes, and the social sciences for insights into risk factors amenable to health promotion activities or other interventions.
Epidemiological studies of the chemosensory disorders of smell and taste may contribute significantly to the improvement of the health of individuals and the population. Smell and taste loss are relatively common problems that may have a tremendous impact on a person’s quality of life. While the sensory systems of smell and taste are often grouped together clinically, each has its own unique features and potential clinical problems. The brain processes smell and taste differently, so damage to either sense can cause different types of problems, depending on the degree of dysfunction. Age-related smell and taste loss poses a significant challenge for the health care of an increasingly older population.
Unlike hearing or vision tests, the tests to measure smell and taste loss are not based upon standard, internationally-accepted procedures. Instead, the literature is full of several alternative methods for measuring smell and taste loss. Some of these tests have been used to compile information from relatively large samples of clinic patients seeking treatment for a smell or taste loss.3–5 From these clinic samples and information collected from convenience samples (student volunteers, meeting participants, etc.), it is possible to learn about potential risk factors and develop hypotheses about associations that may apply to the population generally. Unfortunately, without conducting well-designed epidemiological research studies in population-based samples, we cannot be sure whether the suspected, hypothesized associations and potential risk factors are truly contributing in a major way to the conditions (smell or taste loss) of interest.
Epidemiological studies on “representative” subjects across the lifespan are expensive and difficult to conduct. It is especially difficult to enroll subjects who are not motivated to seek treatment for a current illness or chronic condition and maintain their interest in contributing time from their schedules over a period of years. However, the contribution made by these studies to our understanding of human health in relation to chronic diseases has been immense. For example, the Framingham (MA) Heart Study that began in 1948 with funding from the National Heart Institute has supplied a wealth of information on the epidemiology of heart disease and provided researchers with many avenues for developing prevention strategies. Over time, there were opportunities to include other health measures in the Framingham Heart Study, for example, hearing threshold measurements collected in different decades. These Framingham hearing exam measures have contributed significantly to our knowledge of the epidemiology of age-related hearing loss in the United States.6,7 One goal for the future is to include measures of smell and taste loss in large-scale, multifaceted epidemiological research studies. Also, epidemiological studies primarily focused on chemosensory disorders are needed to develop and test approaches to prevent or delay declines in sensory function with aging. Together these approaches will enable us to make significant progress translating the findings from basic science and clinical studies to improvements in public health.
Clinical Research Findings
Clinical studies have shown that complete olfactory loss (anosmia) is uncommon, and that a complete loss of taste (ageusia) is rare.3–5,8–11 Individuals can often compensate for partial loss.12,13 Also, smell and taste are the only human sensory systems that have the capacity to regenerate after damage, so some recovery of function is usually possible.
Since complete loss of the ability to smell or taste is uncommon, these conditions may seem insignificant when compared to blindness and deafness. However, sufferers of anosmia or ageusia often describe their lives as being nearly unbearable since they are deprived of the many pleasant tastes and odors of daily living.10 The consequences of the more common conditions of a reduced or diminished ability to smell (hyposmia) or taste (hypogeusia) go well beyond the inconvenience of a bland meal.14 Impairment of smell or taste can result in eating spoiled or contaminated food or not being aware, through smell, of a gas leak.15
Some patients complain not of smell or taste loss but, instead, of distortions such as persistent unpleasant or painful sensations described as bad, foul, rancid, acidic, metallic, or burning. These problems may result in diagnosis of a condition known as dysgeusia (altered or abnormal tastes) or burning mouth syndrome.16,17 In addition, smell phantoms and distortions of the sense of smell (dysosmia) have been reported in patients with allergic rhinitis and other conditions.18 Such patient complaints are more common among older people and can result in major quality of life issues.19–21
Factors that have been associated with smell or taste loss include:
Sex and age – Men are more likely to experience smell loss than women; men experience more smell loss earlier in life perhaps due to occupational or environmentally hazardous exposures.22 Since age-related taste loss is less common than smell loss, taste is more robust across the age span.23
Environment – Airborne pollution and toxic odors in the workplace can permanently damage the sense of smell.24
Trauma – Frontal head injury can permanently damage the sense of smell.25,26
Disease or illness – Chronic rhinitis and allergies can adversely affect the sense of smell and reduce the appreciation of food; the effect may be short-term or permanent.27 Infections of the middle ear can damage the sense of taste.28,29
Prescription medications – Certain prescription drugs can affect taste quality perception.30
Cancer treatment – Chemotherapy and radiation treatment for head and neck cancer can damage the sense of taste.31–33
Differences in the ability to smell and taste contributes to our food choices, diet, nutrition, and may impact overall health status.34,35 Clinical studies have demonstrated that the ability to recognize some tastes is present at birth; for example, the pleasure response to sweetness and the disgust at bitterness.36 A response to salt develops during the first year of life.37 Our food preferences may be influenced by both genetic and cultural factors, and the resulting preferences may have significant associations with a variety of health risk factors, including obesity, high blood pressure, and cardiovascular disease.38–40
A genetic trait in humans (although it may be modified by external or environmental causes) is the ability or inability to taste the bitter quality of two related substances: phenylthiocarbamide (PTC) or 6-n-propylthiouracil (PROP).41–46 Tasters of PROP and especially super-tasters (those who rate PROP as being extremely bitter) have been shown to have a more intense appreciation for other tastes, such as other bitter substances, sweet, salt, and acidic (sour) tastes.47–49 Linda Bartoshuk, a discussant in the symposium, has suggested that super-tasters, tasters, and non-tasters of PROP may be described as living in different sensory worlds, with “super-tasters experiencing a neon world and non-tasters experiencing a pastel world”.50,51 People who are tasters or non-tasters, or who have a strong liking of sweet tastes, may have differing health risk profiles, including increased or decreased susceptibility to certain diseases, and preference or tolerance for tea, coffee, alcohol, or cigarettes.52–55 This is a relatively new and growing field of investigation.
Assessing and differentiating smell and taste loss
Mild smell and taste loss often goes unnoticed. Some smell loss may accompany seasonal nasal congestion or a head cold. This type of smell loss usually goes unreported and unmeasured, because people generally consider it to be a temporary and mild annoyance.
More serious smell loss can be caused by nasal obstruction that requires corrective surgery or by chronic viral infections with swelling that require special medications.56,57 These conditions are sufficiently distressing that people often seek medical attention.
Otolaryngologists, or otorhinolaryngologists, are physicians who specialize in diseases of the ear, nose, and throat, including problems affecting smell and taste. An otolaryngologist will conduct a physical examination of the nose and mouth and perform customized tests to assess the degree of any smell and/or taste loss. As part of the exam, the physician will take a personal history and ask the patient to complete a questionnaire to fully describe the problem (“self reporting”). It is very important that the physician diagnose whether the loss is due to a problem with the sense of smell, taste, or both. In many cases, patients will claim a loss of taste because food has become less enjoyable or seems bland, but testing shows that the problem actually involves the sense of smell.
This example points to a very important interaction between taste and smell: our appreciation of food flavor is a complicated mix of taste (sweet, sour, salty, bitter, umami), smell (aromas), texture (smoothness), and temperature (hot and cold) sensations felt through chewing or drinking.58 Food aromas generated by chewing activate the sense of smell by way of a special channel in the roof of the throat (retronasal olfaction). If this channel is blocked due to nasal inflammation, for example, aromas can not reach the person’s sense of smell, and a major contributor to the enjoyment of flavor is lost.
There are several different tests for smell and taste, and the choice of test may be due to convenience, ease-of-use, the nature of the loss, and cost.
Tests for the Loss of Smell
In the clinical setting in the United States, where time, cost, and insurance are critical factors, smell loss is usually assessed with a “scratch-and-sniff” test.59 This test consists of a booklet with 10–40 individual sheets that have microencapsulated beads impregnated with specific odors. The patient scratches the beads with a pencil to release the odor and then identifies the odor from a list of five choices. This type of test measures one’s ability to recognize a particular odor, but does not measure one’s sensitivity or threshold to certain smells. Once the test is completed, the number of errors is recorded and then compared against a standard number of responses by normal individuals. This type of test is relatively quick (under 30 minutes), novel, and fun. The test assumes a normal level of cognitive function, so it is not suitable for individuals with dementia and other types of neurodegenerative disease.
A more exacting test of smell function can be conducted in academic research studies or other research environments.11,60,61 In these cases, patients are recruited to participate in a series of tests in which time and convenience are secondary to a more thorough examination. These examinations can include measures of threshold sensitivity and odor identification. The test equipment is often customized and not suitable for a physician’s office. Its use requires special training.
Another recently developed method for olfactory assessment is with an “olfactometer”, an odor delivery system that allows the examiner to pass precise concentrations of a known odor to the nose of the patient.62 The patient indicates the lowest concentration that is detectable, and names the odor. In this way, the patient’s smell response profile can be determined and compared against a normal standard.
A complete clinical evaluation of smell loss includes:
Physical examination of the ears, nose, and throat
Personal history (for example, exposure to toxic chemicals or trauma)
Questionnaire (self-report)
Validated test supervised by a health care professional
Discussion of treatment options, such as surgery, antibiotics, or steroids
Tests for the Loss of Taste
The sense of taste regulates food intake and choice and is essential for life.10 Consequently, the brain organization of the sense of taste is complicated and redundant. It is very difficult to damage the taste system completely without a threat to life. Specialized taste cells are located throughout the tongue, roof of the mouth, and throat, so it is very difficult to test the entire system.
Two types of taste tests are used. The first test uses “whole mouth stimulation” or the “sip and spit” method.57 In this method, a solution of a known concentration of a sweet, salty, bitter, or sour substance is gargled and sloshed in the mouth and then discarded. The patient is asked to identify the taste substance, and the concentration can be varied to determine threshold sensitivity. It is an easy test to administer but assumes generalized taste loss. Regional damage (for example, on the front or tip of the tongue) would be masked by stimulation of the remaining taste cells elsewhere in the mouth.63
The second test uses a more localized application of taste substances. An eyedropper or other applicator system can be used to place a small amount of taste solution in a precise location on the tongue.64 Alternatively, small filter paper discs or dissolvable (edible) strips can be impregnated with a known concentration of a sweet, salty, bitter, or sour substance, and then the filter paper or strip can be placed on a specific part of the tongue or palate.65,66 The patient is asked to identify the taste substance. The concentration can be varied to determine threshold sensitivity. This test is also easy to administer. The goal is to activate major regions of taste cells to determine whether the individual suffers from partial taste deficit or damage.
A complete clinical evaluation of taste loss includes:
Physical examination of the ears, nose, and throat
Dental examination and assessment of oral hygiene
Personal history (for example, trauma to mouth, cancer, or medications)
Questionnaire (self-report)
Validated test supervised by a health care professional
Discussion of treatment options, such as proper oral hygiene or different medications
Materials and methods
The materials for this report are based on health interview or examination data from prior epidemiological studies initiated by the co-authors and a published compilation of earlier examination studies.61,67,68 The first data set was the 1994–1995 Disability Supplement (Phase I screening) to the National Health Interview Survey (NHIS-D), which consisted of a large, nationally-representative sample of the United States civilian, non-institutionalized population. Self reported losses of the senses of smell and/or taste were obtained via personal household interviews conducted by trained U.S. Census Bureau staff. The sample response rates for the NHIS core surveys were 94.1% and 93.8% in 1994 and 1995, respectively.69,70 The combined 1994–1995 Disability Supplement Phase I data set contains information on 197,588 persons (including 57,553 children), or 90.4% of the persons responding to the NHIS core survey questionnaire during these two years. The questions about problems with the sense of smell or taste were not asked of children. In addition, we have excluded proxy respondents to the NHIS, leaving a total of 81,840 adult subjects for analysis. A description of findings with respect to olfaction and taste from the first year (1994) of the NHIS-D were published previously.67
The smell questions asked in the NHIS-D were:
Do {you} now have any problems with {your} sense of smell, such as not being able to smell things or things not smelling the way they are supposed to? Answers were: Yes/No/Don’t know
Which problem do {you} have, not being able to smell things or things not smelling the way they are supposed to? Answers were: Loss of smell/Things don’t smell right/Don’t know
Is {your} loss of smell complete or partial? Answers were: Complete/Partial/Don’t know
Have {you} had problems with {your} sense of smell for at least 3 months? Answers were: Yes/No/Don’t know
The taste questions asked in the NHIS-D were:
Do {you} have a problem with {your} sense of taste, such as not being able to taste salt or sugar or with tastes in the mouth that shouldn’t be there, like bitter, salty, sour or sweet tastes? Answers were: Yes/No/Don’t know
Which problem or problems do {you} have, not being able to taste salt or sugar, tastes in the mouth that shouldn’t be there, or some other problem? Answers were: Not tasting salt/Not tasting sugar/Tastes that shouldn’t be there/Other problem
Have {you} had any of these problems with taste for at least three months? Answers were: Yes/No/Don’t know
Data from an olfactory examination (1998–2000) administered in a population-based longitudinal study of sensory aging, the Epidemiology of Hearing Loss Study (EHLS), in Beaver Dam, WI are also discussed. These data were collected using a clinical olfactory exam known as the San Diego Odor Identification Test (SDOIT).61 The figures shown in this paper are derived from tables contained in the original publication.
The third source of information analyzed is based on an exhaustive compilation of findings summarized in a review article of the world scientific literature on PTC (or PROP) taster status.68 This review lists information collected on more than 370 study samples worldwide, all published between 1934 and 1998. We have analyzed the information provided in a table in list form by calculating medians and mid-ranges (interquartile ranges) across the individual sample results shown for different nationalities or ethnic/racial groups.
For prevalence estimates and multivariable logistic regression analyses of the NHIS-D data set, we have used the SAS package of statistical programs and SUDAAN to adjust for complex sampling designs employed in this nationally-representative health survey.71,72
Results
The prevalence of self reported problems with smell only, taste only, and with both smell and taste in the U.S. in the period 1994–1995, based on the NHIS-D, is shown in Table 1. Across the adult age range, the percent with smell only problems increased five-fold from 0.94% at 18 to 24 years of age to 4.71% at 85+ years. For taste only problems, there was a 24-fold increase in percent prevalence from 0.07% to 1.70% for the youngest compared to the oldest adults. For problems with both smell and taste, there was an 11-fold increase in percent prevalence, from 0.19% to 2.06% for the youngest compared to the oldest adults.
Table 1.
Percent prevalence of problems with sense of smell only, sense of taste only, or both senses, based on respondent’s self report (no proxy responses) by demographic factors and types of problems in the NHIS–D, Phase I, 1994–1995
| Number in sample |
Problem with smell only |
Problem with taste only |
Problem with both smell and taste |
|
|---|---|---|---|---|
| n | % | % | % | |
| Total | 81,840 | 1.60 | 0.44 | 0.49 |
| Age (years) | ||||
| 18–24 | 7,105 | 0.94 | 0.07 | 0.19 |
| 25–34 | 16,825 | 0.79 | 0.12 | 0.17 |
| 35–44 | 17,769 | 1.04 | 0.31 | 0.38 |
| 45–54 | 13,102 | 1.55 | 0.46 | 0.41 |
| 55–64 | 9,781 | 2.13 | 0.71 | 0.71 |
| 65–74 | 9,961 | 2.57 | 0.72 | 0.73 |
| 75–84 | 5,808 | 3.55 | 1.05 | 1.20 |
| 85+ | 1,489 | 4.71 | 1.70 | 2.08 |
| Sex | ||||
| Female | 51,798 | 1.51 | 0.49 | 0.52 |
| Male | 30,042 | 1.75 | 0.37 | 0.43 |
| Race/ethnicity | ||||
| NH† white | 60,016 | 1.82 | 0.43 | 0.52 |
| NH† black | 10,017 | 0.86 | 0.58 | 0.48 |
| Hispanic | 9,028 | 0.72 | 0.40 | 0.25 |
| Other | 2,779 | 1.18 | 0.33 | 0.38 |
| Kind§ of problem? | ||||
| Loss of function | 81,840 | 1.37 | 0.06 | 0.08 |
| Abnormal smell/taste | 81,840 | 0.16 | 0.18 | 0.05 |
| Mixed or other | 81,840 | — | 0.19 | 0.35 |
| Unknown | 81,840 | 0.06 | 0.01 | 0.01 |
| How long lasting? | ||||
| Less than 3 months | 81,840 | 0.12 | 0.08 | 0.03 |
| Chronic (3+ months) | 81,840 | 1.44 | 0.34 | 0.41 |
| Mixed or other | — | — | 0.03 | |
| Unknown | 81,840 | 0.05 | 0.01 | 0.02 |
| How much loss? | ||||
| Partial | 81,840 | 1.07 | 0.03 | 0.02 |
| Complete¶ | 81,840 | 0.28 | 0.03 | 0.03 |
| Mixed | 81,840 | — | — | 0.03 |
| Unknown or other | 81,840 | 0.26 | 0.38 | 0.41 |
NH = non-Hispanic
For taste, loss of function means respondents said they had problems tasting sugar or salt; abnormal means “tastes that shouldn’t be there”. For respondents with both smell and taste loss of function, the criteria that applied to each one separately — smell loss and taste loss — were satisfied. Similarly, “abnormal” for those with both smell and taste loss meant that both smell and taste abnormalities were reported.
For taste, partial loss was when the respondent said they had a problem tasting one or the other, sugar or salt, but not both, while “complete” loss was the category assigned when they could not taste either sugar or salt. For respondents with both smell and taste loss, the criteria for complete loss for each one separately were satisfied.
The bottom half of Table 1 provides percent prevalences for the follow-up questions asked of subjects who reported problems with their senses of smell and/or taste. The overall prevalence of self-reported olfactory problems only (without taste problems) in the general population, ages 18 years or greater is relatively low, about 1.60%. Based on the Census estimate of 190 million civilian, non-institutionalized adults (18+ years) in 1994–1995 in the United States, the estimated number of adults with self-reported problems with their sense of smell was about 3 million (4 million, if we include respondents who reported problems with both smell and taste).
The reported rates of different types of olfactory problems (including subjects with both smell and taste problems) are shown graphically in Figure 1. The olfactory problems reported were primarily “loss” of smell function (84% or 3.4 million) compared to “things don’t smell right” (12% or 500,000) or “don’t know” (4%). Of those indicating a problem with smell loss, partial loss (75% or 2.5 million) of smell function was reported much more commonly than “complete” loss (23% or 770,000). Percent prevalences for three age groups, younger adults 18 to 44 years, middle-aged adults 45 to 64 years, and older adults 65+ years of age, are also shown in Figure 1.
Figure 1.
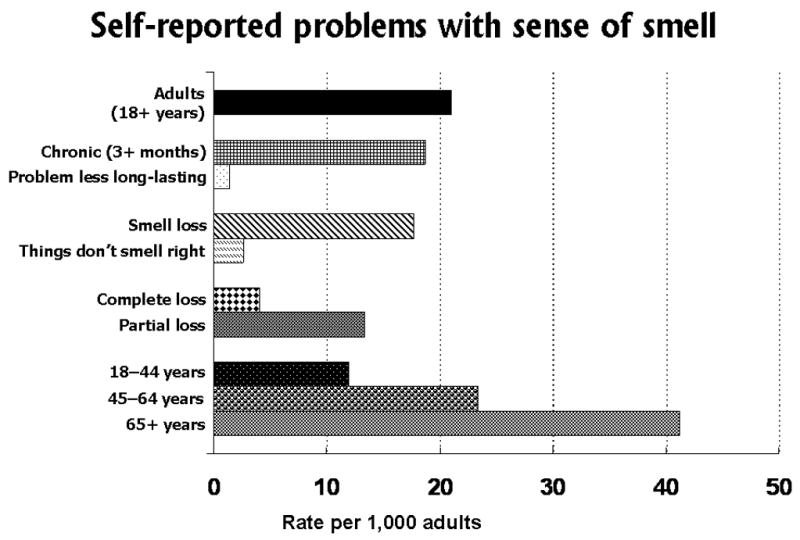
Self reported problems with sense of smell, based on questions in the U.S. National Health Interview Survey, Phase I Disability Supplement (NHIS-D), 1994–1995.
The statistical significance of age-specific increases in prevalences can be judged from Table 2, which presents odds ratios for each age and smell/taste category compared to the percent prevalence for the reference age group, 25 to 34 years. This table is restricted to subjects who reported chronic (3+ months) problems with their senses of smell and/or taste. The odds ratios are all highly significant (p ≤ 0.001) for the age group 55 to 64 years or older.
Table 2.
Odds ratio (OR) estimates of relative risk from multivariable logistic analysis of demographic and other health problems that may affect the risk of chemosensory problems (either a chronic smell problem only, a chronic taste problem only, or both chronic smell and taste problems), based on respondent’s self report (no proxy responses) in the NHIS–D, 1994–1995 (n=81,840)
| Chronic smell problem only |
Chronic taste problem only |
Chronic smell and taste problems |
|
|---|---|---|---|
| Risk factors | OR | OR | OR |
| Age (years) | |||
| 18–24 | 1.30 | 0.65 | 1.05 |
| 25–34 | 1.00 | 1.00 | 1.00 |
| 35–44 | 1.17 | 2.14 | 1.81 |
| 45–54 | 1.51 | 2.47 | 1.54 |
| 55–64 | 1.82* | 3.42* | 2.29* |
| 65–74 | 2.02* | 3.22* | 2.13* |
| 75–84 | 2.29* | 3.61* | 2.45* |
| 85+ | 2.22* | 4.06* | 2.93* |
| Sex | |||
| Female | 1.00 | 1.00 | 1.00 |
| Male | 1.22* | 0.88 | 0.90 |
| Race/ethnicity | |||
| NH† white | 1.00 | 1.00 | 1.00 |
| NH† black | 0.51* | 1.31 | 0.89 |
| Hispanic | 0.49* | 1.26 | 0.65 |
| Other | 0.87 | 1.09 | 1.10 |
| Trouble with hearing | |||
| No | 1.00 | 1.00 | 1.00 |
| Yes | 2.30* | 1.68* | 2.46* |
| Trouble with vision | |||
| No | 1.00 | 1.00 | 1.00 |
| Yes | 1.55* | 2.74* | 2.40* |
| Functional limitations | |||
| No | 1.00 | 1.00 | 1.00 |
| Yes | 2.70* | 4.47* | 4.34* |
| Depression in last year | |||
| No | 1.00 | 1.00 | 1.00 |
| Yes | 2.36* | 4.33* | 3.43* |
NH = non-Hispanic
Statistical significance:
(p ≤ 0.001)
The percent prevalences by sex (female versus male) were statistically different for chronic smell loss only, not for chronic problems with taste only or with both smell and taste. Males were more likely to report a chronic problem with smell alone (22% increased); although not significant, males were less likely (11% decreased) to report a chronic problem with taste alone or with both smell and taste. Comparisons by race/ethnicity also showed statistically significant differences for chronic smell loss only. There was a two-fold increased prevalence for non-Hispanic whites compared to either Hispanics or non-Hispanic blacks. Although not significant, the pattern was reversed for chronic problems with taste only; there was a 26% to 31% increase in reported prevalence for Hispanic and non-Hispanic blacks compared to non-Hispanic whites.
Associations with other, non-chemosensory problems are also shown in Table 2, as part of the multivariable statistical logistic model used for this analysis. Four conditions were selected for inclusion in the multivariate model: trouble with hearing, trouble with vision, any functional limitations, and depression in the past year. The associations with these variables are demonstrated by odds ratios, which remain significant after adjusting for age, sex, race/ethnicity, as well as each of the other selected conditions. The largest odds ratios, exceeding 4-fold effects, were for chronic taste problems only with any functional limitations and with depression in the past year, and for chronic smell and taste problems with any functional limitations.
In contrast to the self reported data discussed above, Figure 2 shows the age- and sex-specific percent prevalences of olfactory impairment as measured by the SDOIT in the EHLS, a population-based study of sensory loss and aging in a cohort of community-dwelling older adults in Beaver Dam, WI.61 All the examination-based prevalences shown in Figure 2 are much greater than the self reported prevalences shown in Figure 1 and were much higher than the participants in the EHLS reported.61 Men were more likely than women to have an olfactory impairment, which was also found in the NHIS-D self report data set to a lesser extent. From age 53 to 79 years of age, men had more than double the odds of olfactory impairment than women; only at ages 80+ years, did women have similar prevalence of olfactory impairment (59.4%) compared to men (69.5%).
Figure 2.
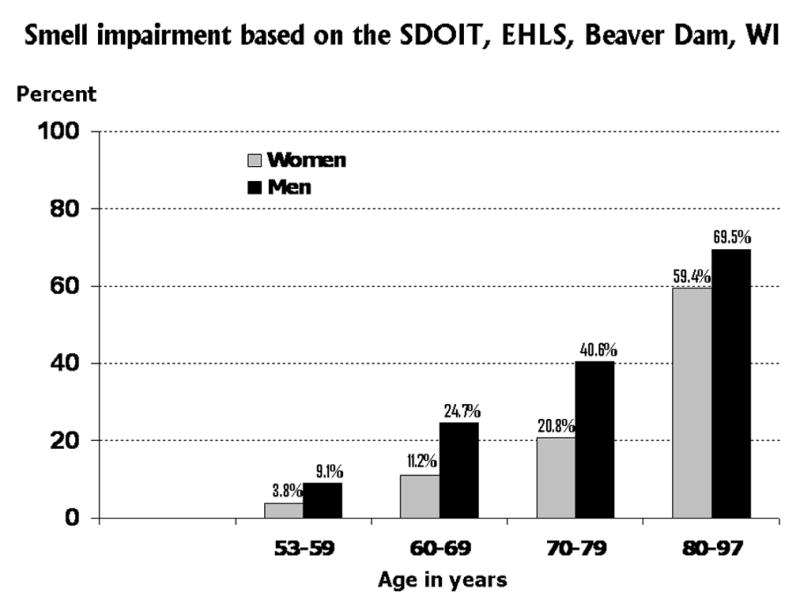
Prevalence of smell impairment based on the San Diego Odor Identification Test (SDOIT), as used in the Epidemiology of Hearing Loss Study (EHLS), a population-based study of sensory loss and aging in older adults in Beaver Dam, WI.61
The relative strength of multiple risk factors for olfactory impairment is shown using a “forest” plot73 in Figure 3, which is constructed based on a table in the Beaver Dam, WI olfaction study report.61 Adjusted odds ratio estimates (elliptical markers) and 95% confidence intervals (shaded bars extended from both ends of the ellipses) are shown for each risk factor, as estimated in a multivariate logistic regression model after elimination of factors that did not contribute to the statistical fit. The scale for the odds ratio shown on the X-axis is logarithmic and, on this scale, confidence intervals are symmetric about the odds ratio estimates. An odds ratio of 2 corresponds to a doubling of the odds of olfactory impairment, which is illustrated in the figure by subjects who had a stroke (compared to subjects with “no stroke”) and, also, by current smokers (compared to subjects who “never smoked”). Men were 2.5 times as likely to have olfactory impairment as women. The highest odds ratio of 4.4 is for subjects with epilepsy (compared to subjects who did not have epilepsy); however, the confidence interval is wide, ranging from 1.7 to 11.2. The wide confidence interval indicates that only a small number of subjects in this population sample had epilepsy.
Figure 3.
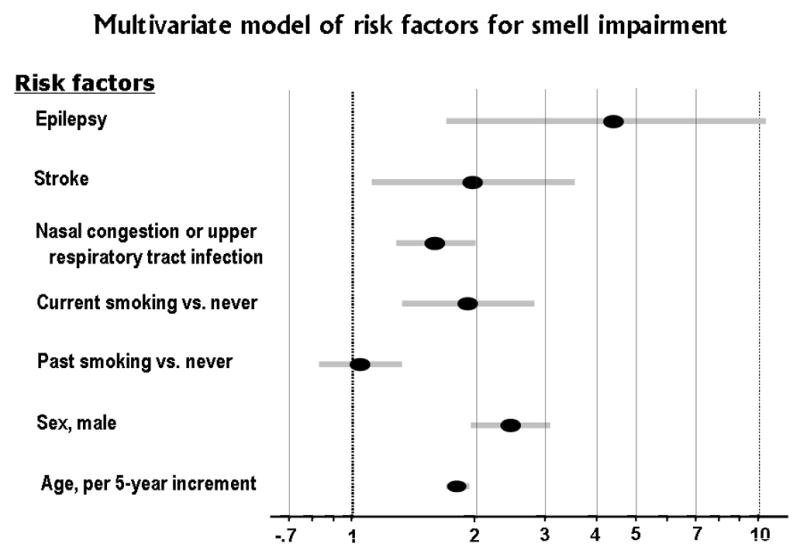
Comparison of odds ratios for selected multiple risk factors for smell impairment based on published findings from the Epidemiology of Hearing Loss Study (EHLS), a population-based study of sensory loss and aging in older adults in Beaver Dam, WI. 61 The elliptical markers indicate odds ratio estimates for the risk factors and the shaded bars on either side represent 95% confidence intervals for the odds ratio estimates. All the variables were included in the multivariate logistic regression model, which means the odds ratio of each risk factor is adjusted for the effects of the other risk factors in the model.
Nasal congestion and upper respiratory tract infection had a smaller but significant odds ratio of 1.6, and the confidence interval was narrow, 1.3 to 2.0, which reflects the fact that this condition is quite common. Common risk factors may contribute significantly to the “attributable” risk or burden of olfactory impairment, even though the relative risk (odds ratio estimate) may not be large.
The odds ratio for age, categorized by 5-year age groups, was 1.8 with a very tight confidence interval of 1.7 to 1.9. This implies a strong, continuing effect of aging on risk of olfactory impairment.
Of the potential risk factors included in the figure, only the effect of past smoking (compared to “never” smoked) was non-significant, which is evident in the figure since the 95% confidence interval crossed (overlapped) 1.0. The authors of the Beaver Dam, WI olfaction study tested for potential interactions between these risk factors, but none were found to be statistically significant.61
Similarly to the NHIS data on the self reported problems with the sense of smell (shown in Figure 1), the prevalence of self reported problems with the sense of taste are shown in Figure 4. The percent prevalence of reported taste problems (including subjects who reported problems with both smell and taste) was 0.93% (9.3 per 1,000 adults or an estimated 1.8 million persons in the United States in 1994–1995). The percent prevalence of problems with taste is less than half (44%) the prevalence of self reported smell problems. The majority of reported taste problems (86% or 1.5 million persons) were “chronic”, having persisted 3 months or longer during the past year. There was no one dominant type of reported taste problem. The prevalences of reported problems with tasting sugar, or with tasting salt, were about equal. When added together, the prevalence of these two problems combined were about the same magnitude as the report of problems with an inappropriate taste in the mouth. Somewhat more subjects responded they had some “other” taste problem. As with smell problems, the prevalence of taste problems increased with age. The highest prevalence was found for older adults, 65+ years of age, with middle-aged adults 45 to 64 years, and younger adults, 18 to 44 years, having progressively lower prevalences.
Figure 4.
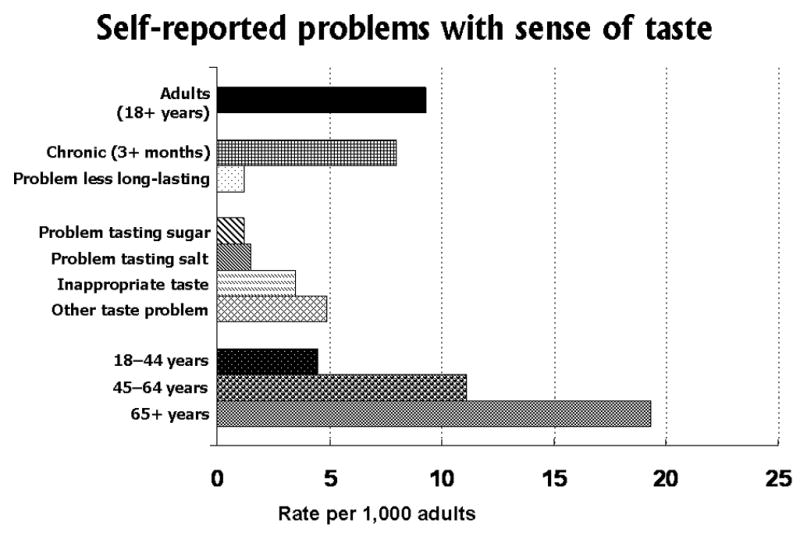
Self reported problems with the sense of taste, based on questions in the U.S. National Health Interview Survey, Phase I Disability Supplement (NHIS-D), 1994–1995.
Unfortunately, there are no published population-based studies of taste loss using examination-based measures. Therefore, it is not known how the prevalence of taste loss differs between self report and examination-based measures. This is important because self reports of taste problems are frequently found to be smell problems after clinical evaluation and testing. Another paper in this symposium will describe preliminary findings based on taste examination measures obtained from a new study of the offspring of the original cohort of older adults in Beaver Dam, WI.74
Another aspect of taste function has been widely studied in many nationalities and ethnic/racial groups around the world, the ability to taste phenylthiocarbamide (PTC). Early studies circa 1930 showed that the ability to taste PTC or a related chemical compound, 6-n-propylthiouracil (PROP), was under genetic control and was possibly a simple Mendelian trait.41–4 Subsequent linkage studies have shown the underlying genetics to be more complex, with multiple alleles on two or more chromosomes.45,46
The inability to taste PTC (percent non-tasters) varies significantly worldwide from one nationality or ethnic/racial group to another, as shown in Figure 5. The data plotted in this figure were extracted from a review article that summarized findings from tests conducted in more than 370 study samples worldwide, all published between 1934 and 1998.68 The rectangular markers or boxes represent the median percentage of PTC non-tasters across the studies listed within each group. Vertical bars indicate variability by showing the 25th to 75th percentile range (or mid-range) across studies within each group. When there were too few studies within a group to calculate the mid-range, only the median is shown. For example, among Australian Aborigines, approximately half (47.7%) are PTC non-tasters. The corresponding medians for people of European origin, including North American white, the percentages of non-tasters were 28% to 27%, respectively. Chinese, African, and Native American Indian groups all have lower percentages of non-tasters, with medians ranging from 13% to 6%.68,75 In virtually all groups tested to date, there are some people who can and some who cannot taste PTC.
Figure 5.
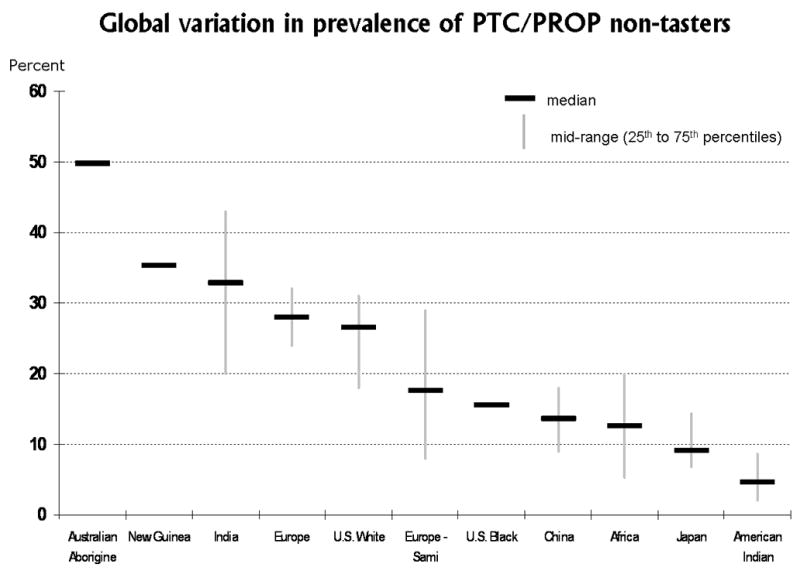
Global variation in sensitivity to the bitter taste of phenylthiocarbamide (PTC), or a related chemical compount, 6-n-propylthiouracil (PROP). The median and mid-range of percentages of non-tasters within each nationality or ethnic/racial group is plotted. The highest percentages of PTC non-tasters were reported for Australian Aborigines (plotted on the left side), while the lowest percentages of non-tasters were reported for Native American Indian groups (plotted on the right side). Data for this figure were extracted from a published table that summarized findings from tests conducted in more than 370 study samples worldwide, all published between 1934 and 1998.68
Discussion
We have described in general terms why we believe epidemiological studies of the chemosenses — the study of incidence or prevalence and risk factors for olfactory and taste loss in populations — is important both for individuals as well as for public health. We have shown risks (using odds ratios) for increased impairment for basic demographic factors and selected chronic health conditions. As with other sensory domains, age is a principal risk factor for both taste and smell impairment. Using the NHIS-D data, we have also shown statistically increased sex-specific and race/ethnicity-specific prevalences among males (smell loss) and non-Hispanic whites (smell loss).
Our results using the nationally-representative NHIS-D data were restricted to self report of any smell/taste losses, excluding information in the original dataset provided by proxy respondents (typically, by spouses when the other one was not at home or otherwise unavailable to answer the interviewer’s questions). In fact, we have analyzed the data both ways and not found major differences in the pattern of results. Nevertheless, in more recent years (since 1997) the National Health Interview Survey (NHIS) has changed the design to exclude proxy responses in the adult sample. Most questions are now directed only at the “sample” adult, not for all members in the household. We chose to present the results in this paper based only on self report given the change in the NHIS design and our concern for as precise or accurate response as possible of the adult respondent’s senses of smell and/or taste.
The epidemiologic study described in this report has revealed wide differences in percent prevalences when self report measures are compared to exam measures of smell loss. In addition to the data sets examined in this report, other published epidemiological studies from Germany and Sweden have also shown high percent prevalences of smell loss as assessed using comparable clinical olfactory examination methods.11,60
The finding of large differences between self report and exam measures is not unexpected in epidemiological studies of sensory function. Similar differences can be seen in response to questions about vision or hearing loss. For hearing loss we know something about the age-specific pattern of differences in report versus exam measures.76,77 For example, in the U.S. National Health and Nutrition Examination Survey (NHANES), which includes a household interview prior to the health examinations conducted in mobile exam centers, we can compare self report to exam measures of hearing impairment. In NHANES, reported difficulty with hearing is mentioned relatively more frequently among young adults than older adults when compared to an objective criterion based on pure-tone average hearing thresholds. People may adjust their self report of sensory (hearing, vision, or chemosensory) problems to reflect their expectations at a given age; younger subjects may have recent memory of much better hearing (or sense of smell) and readily notice and report any diminution or impairment, while older subjects may think their hearing (or sense of smell) is fine for a person of their age. The Beaver Dam study reported high specificity, 94%, of self report smell loss (i.e., a reported smell loss was nearly always confirmed by examination).61 The sensitivity of self reported smell loss for predicting examination-based impairment was unacceptably low, 20%, although somewhat better for middle-aged compared to older adults.61
With regard to taste function, researchers have been more interested in studying factors that may affect food choice, such as the differing perceptions of tastes as too bitter or too sweet, than they have been in identifying subjects with generalized taste loss. The preference for foods has broad relevance to public health concerns, unlike the presumably rare condition of ageusia. A prime example of this focus has been the study of taster status for PTC (or PROP), which was originally thought to be a simple Mendelian trait in the population. Although our understanding of the genetics and psychophysical methods for measuring PTC or PROP in populations has increased, we still do not know why this trait has been maintained in human populations. Several studies have suggested this polymorphism may influence food selection, nutritional status, thyroid metabolism, and consumption of bitter tasting beverages such as coffee or alcohol.38,47,49,78,79 The regional geographic prevalence of the PTC taster phenotype may also reflect population structure in human evolution.80 The pattern shown in Figure 5 is consistent with recent studies using Y chromosome and mitochondrial DNA population structure data to trace the geographic diffusion of human population groups over the past 100 thousand years.81,82
What will the future hold for epidemiologic studies of smell and taste? With the recent establishment of the NIH Blueprint for Neuroscience Research, a large epidemiologic project has been funded to develop an NIH Toolbox of relatively brief measures for use in assessing neurobehavioral functioning in four domains: cognition, emotion, sensation, and motor. Within the sensation domain, there are several sub domains: balance/vestibular, hearing, smell, somatosensation, taste, and vision. Each sub domain team has several expert members devising potential brief measures that will then be piloted in field tests and, subsequently, used to develop norms in the U.S. for ages 3 to 85 years in both non-Hispanic and Hispanic population groups. The ultimate goal is to provide well-documented, valid measures for use in future large epidemiological or clinical trial studies. Given the wide age range for the NIH Toolbox measures, it is clear that different measures or methodologies may have to be developed for the youngest and/or oldest subjects.
Potential uses of the NIH Toolbox measures are many. For example, The National Children’s Study, which will be launched soon in over 100 communities in the U.S., will have an expected sample size of 100,000 subjects recruited from before conception and studied until at least age 21 years. Having available well researched, age-appropriate measures of neurobehavioral functioning over the age span from 3 to 21 years will be a boon to this study. Other potential uses for the NIH Toolbox measures include their incorporation into the ongoing health examinations performed in NHANES. Beginning in 1999, NHANES began operating as a continuous survey in 2-year cycles collecting health, nutritional, and medical data on approximately 10,000 participants from birth to 85 years of age. Each two years, NHANES enrolls a nationally-representative sample using a probability sample of the population via a complex series of statistical techniques. Information is collected by direct interview, direct examination, and review of medical records of participants. It is conducted by the National Center for Health Statistics, CDC, with joint funding support for examination components provided by several components of the National Institutes of Health.
The papers in this symposium on Epidemiological Studies of Olfaction and Taste include presentations of findings from existing epidemiological studies and discussion of some of the methodological challenges of measuring smell and taste function in field studies with children and adults, including the needed tools and resources, and barriers to progress. In addition to describing existing studies, other promising approaches under development will be discussed, including the NIH Blueprint for Neuroscience Research effort to construct an NIH Toolbox of brief exam measures in the sensory domain. The goal is to improve olfactory and taste health through epidemiologic research that measures important aspects of these chemosensory functions while also assessing potential risk factors and other conditions associated with disorder or impairment.
Acknowledgments
We thank our colleagues, May Chiu, Katalin Losonczy, and Dr. Chia-Wen Ko, NIDCD Epidemiology and Biostatistics Program, for their assistance with statistical and computational analyses. We also express our appreciation to the staff of the National Center for Health Statistics (NCHS), CDC, who were responsible for conducting the 1994 and 1995 Disability Supplement to the National Health Interview Survey (NHIS-D) and, in particular, we thank Marcie Cynamon, NCHS, for her expert coordination and implementation of the questions on smell and taste in this national survey. We wish to acknowledge Dr. Jack Pearl, former Program Director, NIDCD Taste Program, an early advocate for chemosensory epidemiological research, and thank two consultants, Dr. Linda Bartoshuk, Yale University, and Dr. Claire Murphy, San Diego State University, who provided guidance on the phrasing of questions for the reporting of smell/taste loss in the NHIS-D. Support: NIH AG11099 (KJC) and NIH AG021917 (KJC).
References
- 1.Lilienfeld AM. Foundations of Epidemiology. Oxford University Press; New York, NY: 1976. [Google Scholar]
- 2.Last JM. A Dictionary of Epidemiology. 3. Oxford University Press; New York, NY: 1995. [Google Scholar]
- 3.Deems D, Doty R, Settle R, et al. Smell and taste disorders: an analysis of 750 from the University of Pennsylvania Smell and Taste Center. Arch Otolaryngol Head Neck Surg. 1991;117:519–528. doi: 10.1001/archotol.1991.01870170065015. [DOI] [PubMed] [Google Scholar]
- 4.Pribitkin E, Rosenthal MD, Cowart BJ. Prevalence and causes of severe taste loss in a chemosensory clinic population. Ann Otol Rhinol Laryngol. 2003;112(11):971–978. doi: 10.1177/000348940311201110. [DOI] [PubMed] [Google Scholar]
- 5.Harris R, Davidson TM, Murphy C, et al. Clinical evaluation and symptoms of chemosensory impairment: one thousand consecutive cases from the Nasal Dysfunction Clinic in San Diego. Am J Rhinol. 2006;20(1):101–108. [PubMed] [Google Scholar]
- 6.Mościcki EK, Elkins EF, Baum HM, McNamara PM. Hearing loss in the elderly: an epidemiologic study of the Framingham Heart Study cohort. Ear Hear. 1985;6(4):184–190. [PubMed] [Google Scholar]
- 7.Gates GA, Cooper JC, Jr, Kannel WB, Miller NJ. Hearing in the elderly: the Framingham cohort, 1983–1985. Part I. Basic audiometric test results. Ear Hear. 1990;11(4):247–256. [PubMed] [Google Scholar]
- 8.Hirth L, Abadanian D, Goedde HW. Incidence of specific anosmia in Northern Germany. Hum Hered. 1986;36(1):1–5. doi: 10.1159/000153591. [DOI] [PubMed] [Google Scholar]
- 9.Gilbert AN, Wysocki CJ. The smell survey results. Natl Geogr. 1987;172:514–525. [Google Scholar]
- 10.Cowart BJ. The Dana Foundation. Taste, Our Body’s Gustatory Gatekeeper. 2005 http://www.dana.org/news/cerebrum/detail.aspx?id=788.
- 11.Landis BN, Konnerth CG, Hummel T. A study on the frequency of olfactory dysfunction. Laryngoscope. 2004;114:1764–1769. doi: 10.1097/00005537-200410000-00017. [DOI] [PubMed] [Google Scholar]
- 12.Duncan HJ, Seiden AM. Long-term follow-up of olfactory loss secondary to head trauma and upper respiratory tract infection. Arch Otolaryngol Head Neck Surg. 1995;121:1183–1187. doi: 10.1001/archotol.1995.01890100087015. [DOI] [PubMed] [Google Scholar]
- 13.London B, Nabet B, Fisher AR, et al. Predictors of prognosis in patients with olfactory disturbance. Ann Neurol. 2008;63(2):159–166. doi: 10.1002/ana.21293. [DOI] [PubMed] [Google Scholar]
- 14.Mann NM, Lafreniere D. Anosmia and nasal sinus disease. Otolaryngol Clin North Am. 2004;37(2):289–300. doi: 10.1016/S0030-6665(03)00157-9. [DOI] [PubMed] [Google Scholar]
- 15.Santos DV, Reiter ER, DiNardo LJ, Costanzo RM. Hazardous events associated with impaired olfactory function. Arch Otolaryngol Head Neck Surg. 2004;130(3):317–319. doi: 10.1001/archotol.130.3.317. [DOI] [PubMed] [Google Scholar]
- 16.Mott AE, Grushka M, Sessle BJ. Diagnosis and management of taste disorders and burning mouth syndrome. Dent Clin North Am. 1993;37(1):33–71. [PubMed] [Google Scholar]
- 17.Bergdahl M, Bergdahl J. Burning mouth syndrome: prevalence and associated factors. J Oral Pathol Med. 1999;28(8):350–354. doi: 10.1111/j.1600-0714.1999.tb02052.x. [DOI] [PubMed] [Google Scholar]
- 18.Apter AJ, Gent JF, Frank ME. Fluctuating olfactory sensitivity and distorted odor perception in allergic rhinitis. Arch Otolaryngol Head Neck Surg. 1999;125(9):1005–1010. doi: 10.1001/archotol.125.9.1005. [DOI] [PubMed] [Google Scholar]
- 19.Thorstensson B, Hugoson A. Prevalence of some oral complaints and their relation to oral health variables in an adult Swedish population. Acta Odontol Scand. 1996;54(4):257–262. doi: 10.3109/00016359609003534. [DOI] [PubMed] [Google Scholar]
- 20.Nordin S, Brämerson A. Complaints of olfactory disorders: epidemiology, assessment and clinical implications. Curr Opin Allergy Clin Immunol. 2008;8(1):10–15. doi: 10.1097/ACI.0b013e3282f3f473. [DOI] [PubMed] [Google Scholar]
- 21.Fukunaga A, Uematsu H, Sugimoto K. Influences of aging on taste perception and oral somatic sensation. J Gerontol A Biol Sci Med Sci. 2005;60(1):109–113. doi: 10.1093/gerona/60.1.109. [DOI] [PubMed] [Google Scholar]
- 22.Corwin J, Loury M, Gilbert AN. Workplace, age, and sex as mediators of olfactory function: data from the National Geographic Smell Survey. J Gerontol B Psychol Sci Soc Sci. 1995;50(4):179–186. doi: 10.1093/geronb/50b.4.p179. [DOI] [PubMed] [Google Scholar]
- 23.Bartoshuk LM. Taste. Robust across the age span? Ann N Y Acad Sci. 1989;561:65–75. doi: 10.1111/j.1749-6632.1989.tb20970.x. [DOI] [PubMed] [Google Scholar]
- 24.Mascagni P, Consonni D, Bregante G, et al. Olfactory function in workers exposed to moderate airborne cadmium levels. Neurotoxicol. 2003;24(4–5):717–724. doi: 10.1016/S0161-813X(03)00024-X. [DOI] [PubMed] [Google Scholar]
- 25.Doty RL, Yousem DM, Pham LT, et al. Olfactory dysfunction in patients with head trauma. Arch Neurol. 1997;54:1131–1140. doi: 10.1001/archneur.1997.00550210061014. [DOI] [PubMed] [Google Scholar]
- 26.Ogawa T, Rutka J. Olfactory dysfunction in head injured workers. Acta Otolaryngol Suppl. 1999;540:50–57. doi: 10.1080/00016489950181206. [DOI] [PubMed] [Google Scholar]
- 27.Ciofalo A, Filiaci F, Romeo R, et al. Epidemiological aspects of olfactory dysfunction. Rhinology. 2006;44(1):78–82. [PubMed] [Google Scholar]
- 28.Bartoshuk LM, V, Duffy B, Reed D, Williams A. Supertasting, earaches and head injury: genetics and pathology alter our taste worlds. Neurosci Biobehav Rev. 1996;20:79–87. doi: 10.1016/0149-7634(95)00042-d. [DOI] [PubMed] [Google Scholar]
- 29.Landis BN, Beutner D, Frasnelli J, et al. Gustatory function in chronic inflammatory middle ear disease. Laryngoscope. 2005;115(6):1124–1127. doi: 10.1097/01.MLG.0000163750.72441.C3. [DOI] [PubMed] [Google Scholar]
- 30.Schiffman SS. Taste and smell losses in normal aging and disease. JAMA. 1997;278:1357–1362. [PubMed] [Google Scholar]
- 31.Bernhardson BM, Tishelman C, Rutqvist LE. Chemosensory changes experienced by patients undergoing cancer chemotherapy: a qualitative interview study. J Pain Symptom Manage. 2007;34(4):403–412. doi: 10.1016/j.jpainsymman.2006.12.010. [DOI] [PubMed] [Google Scholar]
- 32.Hutton JL, V, Baracos E, Wismer WV. Chemosensory dysfunction is a primary factor in the evolution of declining nutritional status and quality of life in patients with advanced cancer. J Pain Symptom Manage. 2007;33(2):156–165. doi: 10.1016/j.jpainsymman.2006.07.017. [DOI] [PubMed] [Google Scholar]
- 33.Schiffman SS, Sattely-Miller EA, Taylor EL, et al. Combination of flavor enhancement and chemosensory education improves nutritional status in older cancer patients. J Nutr Health Aging. 2007;11(5):439–454. [PubMed] [Google Scholar]
- 34.Keller KL, Tepper BJ. Inherited taste sensitivity to 6-n-propylthiouracil in diet and body weight in children. Obes Res. 2004;12(6):904–912. doi: 10.1038/oby.2004.110. [DOI] [PubMed] [Google Scholar]
- 35.Tepper BJ. Nutritional implications of genetic taste variation: the role of PROP sensitivity and other taste phenotypes. Annu Rev Nutr. 2008;28:367–388. doi: 10.1146/annurev.nutr.28.061807.155458. [DOI] [PubMed] [Google Scholar]
- 36.Mennella JA, Pepino MY, Reed DR. Genetic and environmental determinants of bitter perception and sweet preferences. Pediatrics. 2005;115(2):e216–222. doi: 10.1542/peds.2004-1582. [DOI] [PMC free article] [PubMed] [Google Scholar]
- 37.Beauchamp GK, Cowart BJ, Mennella JA, Marsh RR. Infant salt taste: developmental, methodological, and contextual factors. Dev Psychobiol. 1994;27(6):353–365. doi: 10.1002/dev.420270604. [DOI] [PubMed] [Google Scholar]
- 38.Tepper BJ. 6-n-Propylthiouracil: a genetic marker for taste, with implications for food preference and dietary habits. Am J Hum Genet. 1998;63:1271–1276. doi: 10.1086/302124. [DOI] [PMC free article] [PubMed] [Google Scholar]
- 39.Duffy VB. Associations between oral sensation, dietary behaviors and risk of cardiovascular disease (CVD) Appetite. 2004;43(1):5–9. doi: 10.1016/j.appet.2004.02.007. [DOI] [PubMed] [Google Scholar]
- 40.López EP, Rice C, Weddle DO, Rahill GJ. The relationship among cardiovascular risk factors, diet patterns, alcohol consumption, and ethnicity among women 50 years and older. J Am Diet Assoc. 2008;108(2):248–256. doi: 10.1016/j.jada.2007.10.043. [DOI] [PMC free article] [PubMed] [Google Scholar]
- 41.Fox AL. Six in ten ‘tasteblind’ to bitter chemical. Sci News Lett. 1931;9:249. [Google Scholar]
- 42.Blakeslee A. Genetics of sensory thresholds: taste for phenylthiocarbamide. Science. 1931;74:607. [Google Scholar]
- 43.Fox AL. The relationship between chemical constitution and taste. Proc Natl Acad Sci. 1932;18:115–120. doi: 10.1073/pnas.18.1.115. [DOI] [PMC free article] [PubMed] [Google Scholar]
- 44.Levit S, Soboleva G. Comparative intrapair correlations of fraternal twins and siblings. J Genet. 1935;30:389–396. [Google Scholar]
- 45.Reed DR, Nanthakumar E, North M, et al. Localization of a gene for bitter taste perception to human chromosome 5p15. Am J Genet. 1999;64:1478–1480. doi: 10.1086/302367. [DOI] [PMC free article] [PubMed] [Google Scholar]
- 46.Drayna D. Human taste genetics. Ann Rev Genom Hum Genet. 2005;6:217–235. doi: 10.1146/annurev.genom.6.080604.162340. [DOI] [PubMed] [Google Scholar]
- 47.Bartoshuk LM. Comparing sensory experience across individuals: recent psychophysical advances illuminate genetic variation in taste perception. Chem Senses. 2000;25:447–460. doi: 10.1093/chemse/25.4.447. [DOI] [PubMed] [Google Scholar]
- 48.Ko CW, Hoffman HJ, Lucchina LA, et al. Differential taste perceptions of intensity for the four basic taste qualities in PROP supertasters versus nontasters. Chem Senses. 2000;25(5):639–640. [Google Scholar]
- 49.Duffy VB. Variation in oral sensation: implications for diet and health. Curr Opin Gastroenterol. 2007;23(2):171–177. doi: 10.1097/MOG.0b013e3280147d50. [DOI] [PubMed] [Google Scholar]
- 50.Bartoshuk LM, V, Duffy B, Chapo AK, et al. From psychophysics to the clinic: missteps and advances. Food Qual Pref. 2004;15:617–632. [Google Scholar]
- 51.Blakeslee AF, Fox AL. Our different taste worlds. J Hered. 1932;23:97–107. [Google Scholar]
- 52.Moore M, Weiss S. Reasons for non-drinking among Israeli adolescents of four religions. Drug Alcohol Depend. 1995;38(1):45–50. doi: 10.1016/0376-8716(95)01104-7. [DOI] [PubMed] [Google Scholar]
- 53.Duffy VB, Davidson AC, Kidd JR, et al. Bitter receptor gene (TAS2R38), 6-n-propylthiouracil (PROP) bitterness and alcohol intake. Alcohol Clin Exp Res. 2004;28(11):1629–1637. doi: 10.1097/01.ALC.0000145789.55183.D4. [DOI] [PMC free article] [PubMed] [Google Scholar]
- 54.Yeomans MR, Tepper BJ, Rietzschel J, Prescott J. Human hedonic responses to sweetness: role of taste genetics and anatomy. Physiol Behav. 2007;91(2–3):264–273. doi: 10.1016/j.physbeh.2007.03.011. [DOI] [PubMed] [Google Scholar]
- 55.Pepino MY, Mennella JA. Effects of cigarette smoking and family history of alcoholism on sweet taste perception and food cravings in women. Alcohol Clin Exp Res. 2007;31(11):1891–1899. doi: 10.1111/j.1530-0277.2007.00519.x. [DOI] [PMC free article] [PubMed] [Google Scholar]
- 56.Bromley SM. Smell and taste disorders: a primary care approach. Am Fam Physician. 2000;61(2):427–436. [PubMed] [Google Scholar]
- 57.Wrobel BB, Leopold DA. Clinical assessment of patients with smell and taste disorders. Otolaryngol Clin North Am. 2004;37(6):1127–1142. doi: 10.1016/j.otc.2004.06.010. [DOI] [PMC free article] [PubMed] [Google Scholar]
- 58.Fujii M, Fukazawa K, Hashimoto Y, et al. Clinical study of flavor disturbance. Acta Otolaryngol Suppl. 2004;553:109–112. doi: 10.1080/03655230410017788. [DOI] [PubMed] [Google Scholar]
- 59.Doty RL, Shaman P, Applebaum SL, et al. Smell identification ability: changes with age. Science. 1984;226:1441–1443. doi: 10.1126/science.6505700. [DOI] [PubMed] [Google Scholar]
- 60.Brämerson A, Johansson L, Ek L, et al. Prevalence of olfactory dysfunction: the Skövde population-based study. Laryngoscope. 2004;114(4):733–737. doi: 10.1097/00005537-200404000-00026. [DOI] [PubMed] [Google Scholar]
- 61.Murphy C, Schubert CR, Cruickshanks CJ, et al. Prevalence of olfactory impairment in older adults. JAMA. 2002;288(18):2307–2312. doi: 10.1001/jama.288.18.2307. [DOI] [PubMed] [Google Scholar]
- 62.Tsukatani T, Reiter ER, Miwa T, Costanzo RM. Comparison of diagnostic findings using different olfactory test methods. Laryngoscope. 2005;115(6):1114–1117. doi: 10.1097/01.MLG.0000163754.16475.43. [DOI] [PubMed] [Google Scholar]
- 63.Nordin S, Bramerson A, Bringlöv E, et al. Substance and tongue-region specific loss in basic taste-quality identification in elderly adults. Eur Arch Otorhinolaryngol. 2007;264(3):285–289. doi: 10.1007/s00405-006-0169-9. [DOI] [PubMed] [Google Scholar]
- 64.Hebhardt P, Bagla R, Doty RL. An automated regional taste-testing system. Behav Res Methods Instruments Comput. 1999;31(3):464–469. doi: 10.3758/bf03200727. [DOI] [PubMed] [Google Scholar]
- 65.Just T, Steiner S, Strenger T, Pau HW. Changes of oral trigeminal sensitivity in patients after middle ear surgery. Laryngoscope. 2007;117(9):1636–1640. doi: 10.1097/MLG.0b013e31806dd060. [DOI] [PubMed] [Google Scholar]
- 66.Smutzer G, Lam S, Hastings L, et al. A test for measuring gustatory function. Laryngoscope. 2008;118(8):1411–1416. doi: 10.1097/MLG.0b013e31817709a0. [DOI] [PMC free article] [PubMed] [Google Scholar]
- 67.Hoffman HJ, Ishii EK, MacTurk RH. Age-related changes in the prevalence of smell/taste problems among the United States adult population. Results of the 1994 Disability Supplement to the National Health Interview Survey (NHIS) Ann N Y Acad Sci. 1998;855:716–722. doi: 10.1111/j.1749-6632.1998.tb10650.x. [DOI] [PubMed] [Google Scholar]
- 68.Guo SW, Reed DR. The genetics of phenylthiocarbamide perception. Ann Hum Biol. 2001;28(2):111–142. doi: 10.1080/03014460151056310. [DOI] [PMC free article] [PubMed] [Google Scholar]
- 69.Adams PF, Marano MA. Vital and health statistics. 193. Vol. 10. Hyattsville, MD: National Center for Health Statistics, CDC; 1995. Current estimates from the National Health Interview Survey, 1994. [PubMed] [Google Scholar]
- 70.Benson V, Marano MA. Vital and health statistics. 199. Vol. 10. Hyattsville, MD: National Center for Health Statistics, CDC; 1998. Current estimates from the National Health Interview Survey, 1995. [PubMed] [Google Scholar]
- 71.SAS Institute Inc. SAS/STAT user’s guide, version 9.1. Cary, NC: SAS Institute Inc; 2003. [Google Scholar]
- 72.Shah BV, Barnwell BG, Bieler GS, et al. Statistical methods and algorithms used in SUDAAN. Research Triangle Park, NC: Research Triangle Institute; 1996. SUDAAN technical manual. [Google Scholar]
- 73.Lewis S, Clarke M. Forest plots: trying to see the wood and the trees. BMJ. 2001;322(7300):1479–1480. doi: 10.1136/bmj.322.7300.1479. [DOI] [PMC free article] [PubMed] [Google Scholar]
- 74.Cruickshanks KJ, Schubert CR, Snyder DJ, et al. Measuring taste impairment in epidemiologic studies – the Beaver Dam Offspring Study. Presented at the International Symposium on Olfaction and Taste (ISOT 2008); San Francisco, CA. July 26.2008. [Google Scholar]
- 75.Guo SW, Shen FM, Wang YD, Zheng CJ. Threshold distributions of phenylthiocarbamide (PTC) in the Chinese population. Ann N Y Acad Sci. 1998;855:810–812. doi: 10.1111/j.1749-6632.1998.tb10664.x. [DOI] [PubMed] [Google Scholar]
- 76.Nondahl DM, Cruickshanks KJ, Wiley TL, et al. Accuracy of self-reported hearing loss. Audiol. 1998;37(5):295–301. doi: 10.3109/00206099809072983. [DOI] [PubMed] [Google Scholar]
- 77.Sindhusake D, Mitchell P, Smith W, et al. Validation of self-reported hearing loss. The Blue Mountains Hearing Study. 2001;30(6):1371–1378. doi: 10.1093/ije/30.6.1371. [DOI] [PubMed] [Google Scholar]
- 78.Bartoshuk LM, V, Duffy B, Miller IJ. PTC/PROP tasting: anatomy, psychophysics, and sex effects. Physiol Behav. 1994;56:1165–1171. doi: 10.1016/0031-9384(94)90361-1. [DOI] [PubMed] [Google Scholar]
- 79.Hayes JE, Bartoshuk LM, Kidd JR, Duffy VB. Supertasting and PROP bitterness depends on more than the TAS2R38 gene. Chem Senses. 2008;33(3):255–265. doi: 10.1093/chemse/bjm084. [DOI] [PubMed] [Google Scholar]
- 80.Wright S. Population structure in evolution. Proc Am Philos Soc. 1949;93:471–478. [PubMed] [Google Scholar]
- 81.Macaulay V, Hill C, Achilli A, et al. Single, rapid coastal settlement of Asia revealed by analysis of complete mitochondrial genomes. Science. 2005;308:1034–1036. doi: 10.1126/science.1109792. [DOI] [PubMed] [Google Scholar]
- 82.Underhill PA, Kivisild T. Use of Y chromosome and mitochondrial DNA population structure in tracing human migrations. Annu Rev Genet. 2007;41:539–564. doi: 10.1146/annurev.genet.41.110306.130407. [DOI] [PubMed] [Google Scholar]