Abstract
Poly(ether-ether-ketone) (PEEK) has been used as a load bearing orthopaedic implant material with clinical success. All of the orthpaedic applications contain stress concentrations (notches) in their design; however, little work has been done to examine the stress-strain behavior of PEEK in the presence of a notch. This work examines both the stress-strain behavior and the fracture behavior of neat PEEK in a uniaxial loaded condition, and in circumferentially grooved round bar specimens with different elastic stress concentration factors. It was found that the material shows ductile necking in the smooth condition and that this is almost completely suppressed in the notched conditions. Additionally, the deformation and fracture micromechanisms changed drastically, from one of plastic deformation and void coalescence to one dominated by crazing and brittle fast fracture. This change in mechanism was explained via Neuber's theory of stresses at a notch.
Introduction
Poly(ether-ether-ketone) (PEEK), is a semicrystalline polymer that has an approximate crystallinity of 30-35% and a Tg of 143°C [1]. PEEK is a polymer of interest to the medical community because of several attractive properties: PEEK, and its composites, are transparent to X-rays, show no artifacts created in CT images, and have shown excellent biocompatibility [1, 2]. Both carbon fiber reinforced (CFR) and hydroxyapatite (HA) filled and/or HA coated PEEK have been developed. This has the benefit that the mechanical properties of the material can be tailored by altering the composite formulation [1]. Due to their high strength, both neat (unreinforced, unfilled, uncoated) PEEK and CFR PEEK are both being used in several orthopaedic applications, including the femoral component of total hip replacements, bone anchors, and spinal implants [1]. Recently, there has been investigation into the suitability of CFR PEEK for use as an acetabular bearing surface [3].
All of the aforementioned orthopeadic PEEK-based implants contain design features that result in stress concentrations upon loading. In the field of engineering design and failure analysis, it is well known that a preponderance of failures emanate from stress concentrations such as microstructural or geometrical discontinuities (geometric stress concentrations are generically termed as notches) [4-7]. The presence of a notch alters the stress state near the notch and may increase the tendency for brittle fracture (as opposed to gross yielding) in potentially four ways: by introducing high local stresses; by creating a triaxial stress state ahead of the notch; by causing high local strain hardening; and by magnifying the strain rate locally [8]. Thus, it is of interest to know how neat PEEK behaves in the presence of a design stress concentration. There are reports in the literature on the fatigue crack propagation behavior of PEEK [9-11], and also on the stress-life (S-N) behavior in the presence of notches [12], however the authors have found no work to date that reports the monotonic tensile behavior of PEEK in the presence of a stress concentration. Therefore the objective of this study was to investigate the axial true stress-strain behavior of PEEK with and without the presence of a stress concentration.
Materials and Methods
The PEEK material used in this study was OPTIMA LT1™ (Invibio, Inc., West Conshohocken, PA), which is a neat PEEK formulation. Four tensile specimen geometries were machined and tested. The control geometry was a smooth cylindrical waisted specimen with an 8 mm diameter in the gauge region (“unnotched”). Two circumferentially U-shaped grooved specimen geometries, “Moderate” (OD=8mm, ID=6mm, notch radius=0.9mm, Kt=2.1) and “Deep” (OD=8mm, ID=6mm, notch radius=0.45mm, Kt=2.7) were tested to examine the effect of a notch and the effect of elastic stress concentration factor (Kt) on the monotonic tensile behavior. A circumferentially razor grooved dog-bone (“Razor”, OD=8mm, ID=6mm, Kt>10) was also tested, primarily to examine the effects of an extreme stress concentration (Figure 1). Prior to mechanical testing, specimens were soaked in a 37°C phosphate-buffered saline bath for 8 weeks to simulate physiological conditions.
Fig. 1.
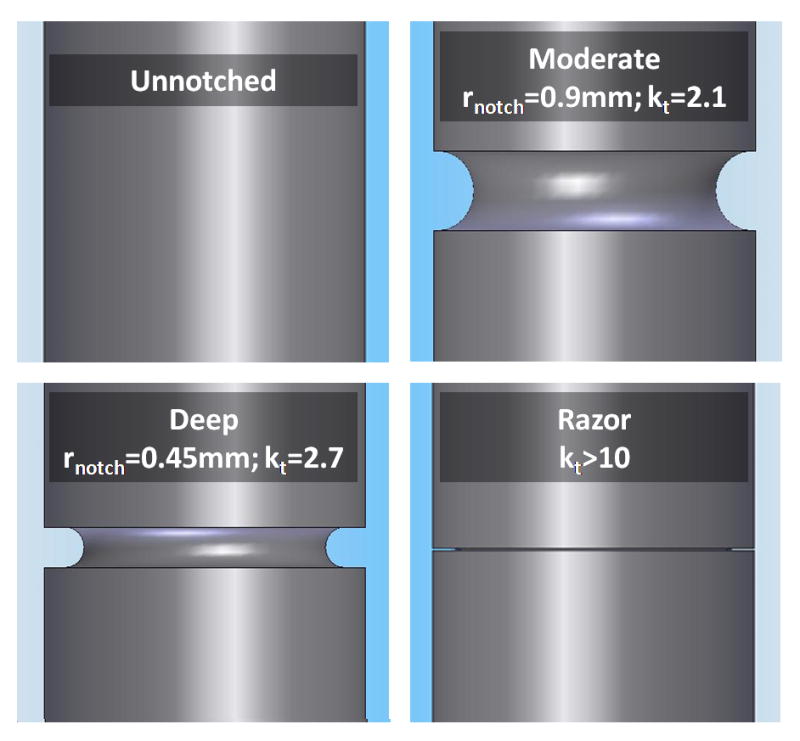
The four geometries of specimens used in the testing. All of the specimens had an outer diameter of 8mm. The notched specimens had an inner diameter of 6mm.
For all test groups, monotonic testing to failure was conducted (Instron 8511 servo-hydraulic load frame) at two displacement rates (6mm/min and 30mm/min) in air at 37°C. Six to ten specimens were tested in each of the eight geometry/rate groups. Load-time data was collected using LabView and strain data was collected for the unnotched and the U-notched geometries using non-contacting video-based methods. True axial stress-strain curves were then derived for the unnotched and U-shaped notched geometries; additionally von Mises stress-strain curves were generated for the unnotched geometry. The specific methods and assumptions used in the calculation of the true and von Mises stress-strain curves are described in the appendix.
To aid in interpreting the deformation and fracture mechanisms that occurred for the notched test specimens, estimates of the elastic stress distribution in the U-shaped notched geometries were made using Neuber's solutions for the elastic stresses in a circumferentially notched bar with a notch radius of ρ (Appendix)[13, 14]. The solutions were used to derive the distributions of the von Mises stress (σVM(r)), the hydrostatic stress (σH(r)), and the ratio of the hydrostatic stress to the von Mises stress, also known as the triaxiality ratio (TR).
Differences in the maximum axial true stress and maximum axial true strain between the unnotched and U-shaped notch geometries, and between the two rates, were tested using t-tests (α=0.5). Additionally, for the unnotched specimens, differences in axial yield stress and strain were tested between the two rates. For the razor specimens, the difference in engineering fracture stress between the two rates was tested.
To evaluate the effect of notching on deformation and fracture micromechanism, a representative fracture surface from each of the eight geometry-rate combinations was examined using scanning electron microscopy (SEM, Hitachi S-4500, Tokyo Japan) at 5kV.
Results
Significant necking occurred in the unnotched specimens with propagation of the neck sometimes extending throughout the entire gauge length (Figure 2). The load-time curve revealed that there is a dramatic decrease in the applied load once necking occurs, with the load remaining constant during propagation of the fully formed neck. At the onset of fracture, there is a slight dip in the load curve prior to complete rupture (Figure 3).
Fig. 2.
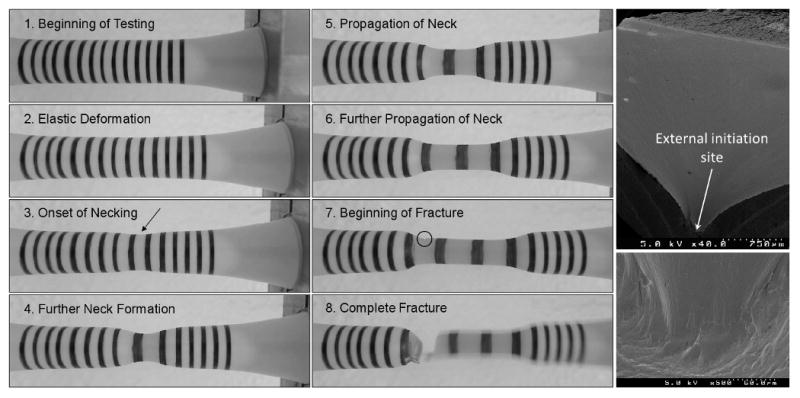
Left: The stages of deformation in an unnotched specimen. Right: SEMs of the external initation site from this specimen.
Fig. 3.
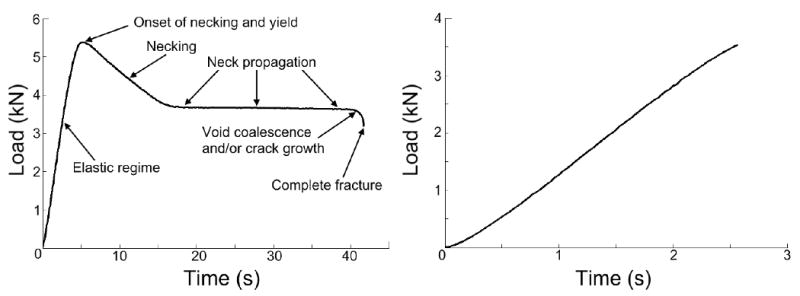
Load-time curves for an unnotched specimen (left, 6mm/min) and a deep notched specimen (right, 6mm/min).
Both the axial true and the von Mises stress-strain curves showed that there is significant strain hardening in the necking region (Figure 4). For the unnotched condition, increasing the displacement rate caused a statistically significant increase in the true axial yield stress, the true axial yield strain, the true axial maximum stress, and the true axial maximum strain (Table 1).
Fig. 4.

Axial true stress-strain (left) and von Mises stress-strain (right) curves for the unnotched geometry. The von Mises yield stress is slightly higher than the axial yield stress.
Table 1.
Mechanical properties. The von Mises yield stresses are the ones applicable to the Neuber analysis.
| Unnotched | Moderate | Deep | Razor** | |||||
|---|---|---|---|---|---|---|---|---|
| 6mm/min | 30mm/min | 6mm/min | 30mm/min | 6mm/min | 30mm/min | 6mm/min | 30mm/min | |
| True Axial Yield Stress (MPa) | 108.3±1.9 | 111. 6±2.1 | ||||||
| True Axial Yield Strain | 1.05±0.04 | 1.16±0.02 | ||||||
| Von Mises Yield Stress (MPa) | 112.2±1.9 | 116.3±2.1 | ||||||
| Von Mises Yield Strain | 1.07±0.05 | 1.17±0.03 | ||||||
| Maximum Axial True Stress (MPa) | 211.34±8.16 | 225.71±5.35 | 132.37±1.11 | 135.04±0.42 | 127.31±2.33 | 129.28±1.36 | 119.54±4.92 | 123.71±4.33 |
| Maximum Axial True Strain | 1.01±0.026 | 1.11±0.051 | 0.062±0.004 | 0.060±0.003 | 0.047±0.004 | 0.043±0.003 | ||
The stresses for the razor notched geometry are engineering stresses, NOT true stresses
The U-shaped notched geometries displayed more brittle behavior. The load-time curves showed no distinct yielding (Figure 3). There was minimal reduction in the diameter across the notch upon loading (∼2% reduction). The axial stress-strain curve showed deviation from linear behavior near failure, which indicates that the proportional limit of the specimen had been reached, and that there was some plastic behavior (Figure 5). This deviation from linearity was greater for the moderate compared to the deep notch condition.
Fig. 5.
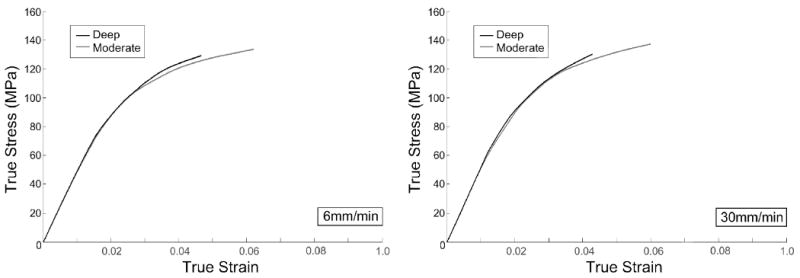
Axial true stress-strain for the moderate and the deep notched specimens at both displacement rates.
Notching caused a significant reduction in the maximum axial stress (Figure 6) with increasing severity causing a significant reduction between the two U-shaped notch geometries at each displacement rate. Increasing the displacement rate also resulted in a small but significant increase in the true axial stress at fracture in each of the U-shaped notch geometric conditions.
Fig. 6.
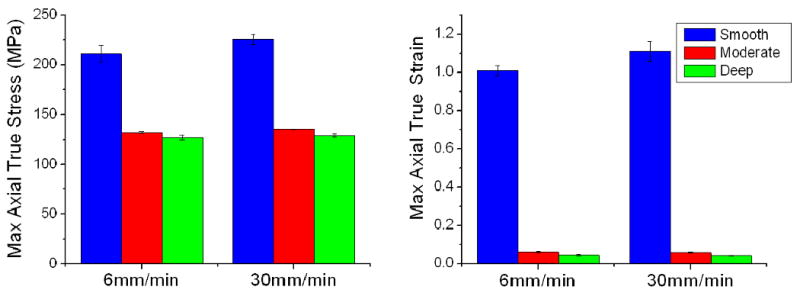
The maximum axial true stress and strain for the unnotched and the two U-shaped geometries.
The razor-notched specimens also showed a highly linear load-time curve. A significant increase in engineering fracture stress upon increase of displacement rate was also found (Table 1).
The von Mises stress distribution across the notch for both U-shaped geometric conditions (found using the Neuber stress distributions at the applied fracture stress) showed that the majority of the specimen was below the von Mises yield stress at the time of fracture (Figure 7). The distributions suggest that moderate notch condition has a larger area undergoing plastic deformation than the deep notch condition.
Fig. 7.
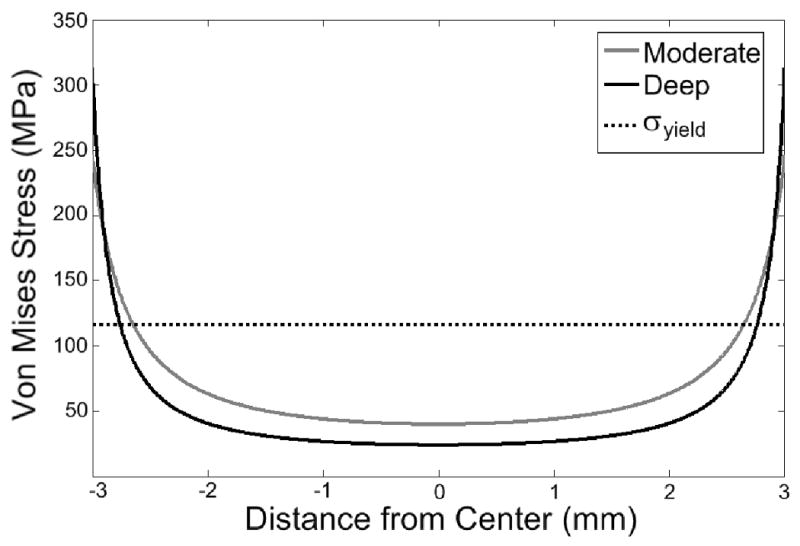
Von Mises stress distributions along the radius of the notch for the moderate and deep notches. These were found using the Neuber equations. The von Mises yield stress for the 30mm/min displacement rate is also shown. The distributions are identical for both rates, since the analysis is purely linear elastic, however, the yield stress is lower for the 6mm displacement rate.
For the unnotched test group, all the fractures were visually observed to be of the cup-cup variety. It was noted that the inner region of the fracture surface was visibly whitened for fractures with an internal initiation site; this was not true for fractures with an external initiation site. For all the unnotched specimens, it was observed that the outer rim of the fracture surface was darker than the initial specimen color.
Examination of the unnotched fracture behavior via SEM demonstrated that the fractures initiated either at the surface, or in the interior of the specimen (Figures 2 and 8). When the initiation site was internal, the mechanism of fracture initiation was void coalescence, whereas there did not appear to be void coalescence for fractures that initiated at the surface. Regardless of initiation site, initiation was followed by a region of crack growth, followed by a region of a ridged appearance, with the ridges becoming closer together as the distance from the initiation site increased. Finally, there was a transition region to a fast fracture region (Figure 8). The micromechanism of fracture was the same at both displacement rates.
Fig. 8.
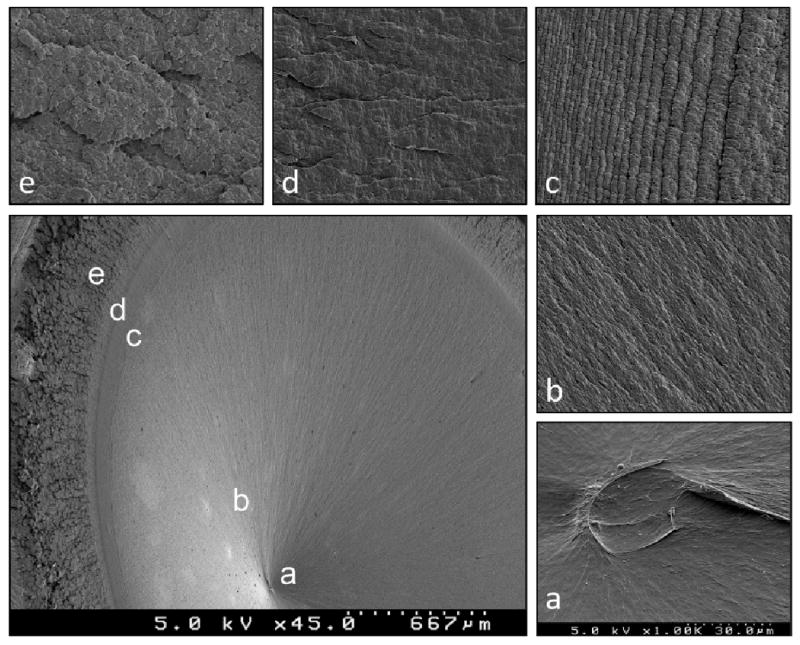
SEM fractograph of a smooth specimen (30mm/min). Zoomed in views of the labeled regions surround the main fractograph. The regions are as follows: a) critical flaw, b) slow crack growth, c) a ridged region, d) a transition region, e) fast fracture region.
The fracture micromechanism changed dramatically upon notching. In all of the notched conditions (including the razor notch condition) there were areas showing void coalescence ahead of the notch (Figures 9 and 10). The frequency of these voids increased, and the distance from the notch edge decreased, as the severity of the notch increased. This was especially evident in the razor notched specimen, which had many voids directly along its edge (Figure 11). Crack initiation occurred due to this void coalescence. As the crack proceeded inward, it left behind regions of patchwork morphology, consistent with crack growth through crazes. These “patches” became smaller and more numerous in the direction of crack advance. Finally, at a central location within the specimen, there was a region of fast fracture (Figures 9 and 10).
Fig. 9.
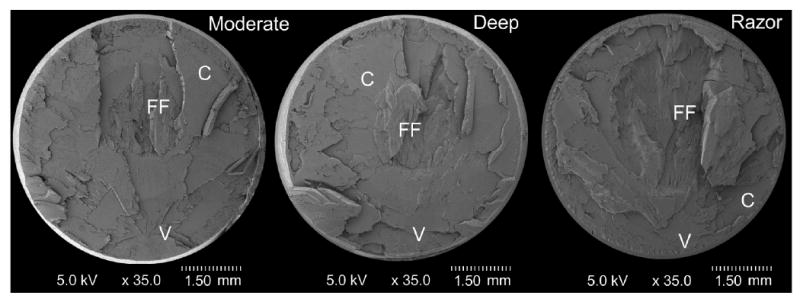
SEM fractographs for the moderate, deep, and razor geometries at the 6mm/min extenstion rate. Regions of void coalescence (V), patchwork morphology indicating fracture through crazes (C), and fast fracture (FF) are marked. Fracture initiated at the voids marked by “V.”
Fig. 10.
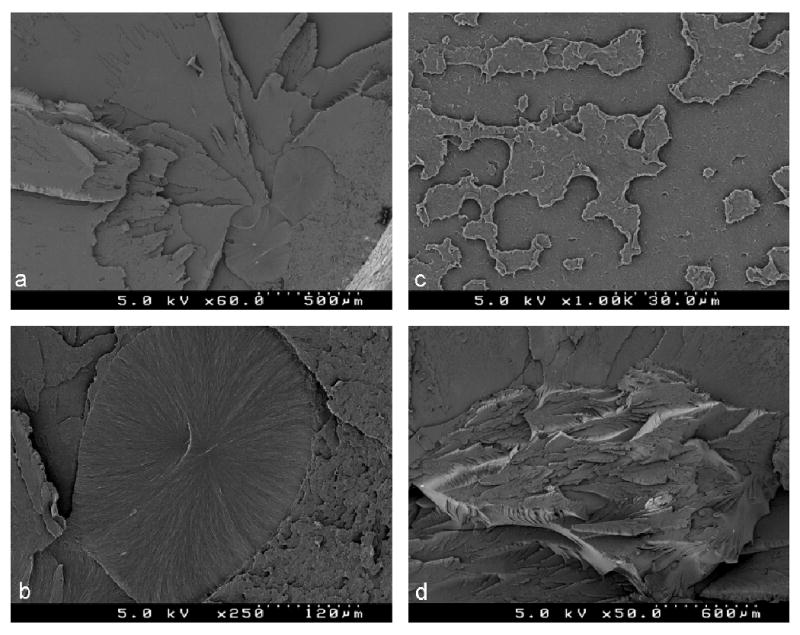
a) Fracture initiation site showing coalesced voids. b) Zoomed in view showing the ductile nature of the coalesced voids. c) The patchwork morphology indicative of crazing. d) The fast fracture region.
Fig. 11.
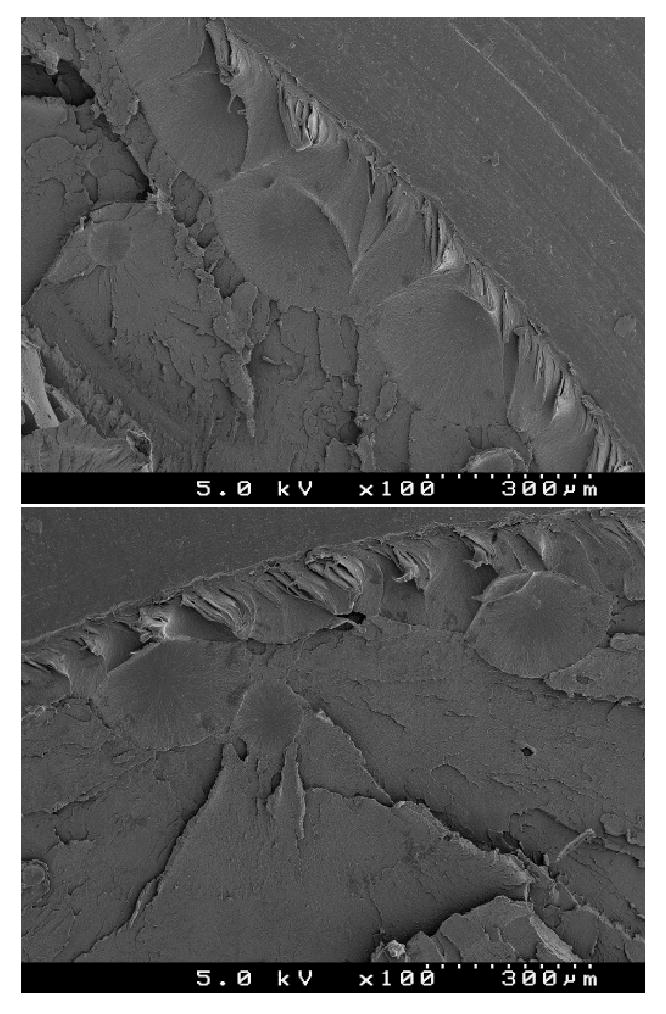
Fractographs showing the abundance of voids directly by the notch edge for the razor notched specimens.
Discussion
The mechanical behavior of PEEK changed with notching in that gross yielding was suppressed. For the notch geometries examined in this study, notching also significantly lowered the maximum axial true stress and the maximum axial true strain at fracture (35 % or more). Additionally, increasing the displacement rate caused small but significant increase in the yield stress (3.0%) and strain (10.5%) of the unnotched condition, and in the maximum axial stress (less than 7%) of all the specimen geometries. Maximum axial strain generally increased with increasing rate as well (10% or less). The fact that all of the rate effects were small in magnitude is consistent with the reported low strain rate sensitivity of PEEK [1].
Consistent with other reports for PEEK materials, the unnotched tensile specimens showed ductile behavior in the form of a stable, propagating neck [1]. For polymers that undergo necking during axial deformation, there is increased chain alignment at the surface of the neck compared to the interior [15]; this could be the reason for the observed darkening of the neck upon formation and propagation in this study. The observed whitening, such as that seen in the interior of the fracture surfaces of the unnotched specimens, is indicative of cavitation, which is a precursor to void coalescence [16]. The dip observed in the load-time curve near fracture (Figure 3) is consistent with the onset of fracture due to void coalescence and crack growth for an internally initiated failure or crack growth from an external initiation site. In support of this, a finite element analysis of void coalescence in glassy polymers predicted a similar dip behavior in the stress-strain response of the bulk polymer [17].
The dramatic change in the fracture mechanism with notching can be considered with respect to cavitation. Cavitation is related to the hydrostatic stress (σH) present in a polymer and occurs when this reaches a critical cavitation stress [18, 19]. Yielding is predominantly associated with the von Mises stress [20]. In tensile drawing of semicrystalline polymers, there is a competition between cavitation during elastic deformation and activation of crystal plasticity. Elastic cavitation occurs in semicrystalline polymers with crystals of higher resistance to the onset of plastic behavior, while plastic deformation occurs in crystals of lower plastic resistance [16]. Significant yielding occurred in the unnotched specimens in this study and plastic flow was the dominant phenomenon. However, with notching, yielding was suppressed and elastic behavior and cavitation predominated.
The Neuber stress distribution analysis indicated that, for the notched specimens, the majority of the specimen was well below the von Mises yield stress (Figure 7). The yielded zone at the notch root was therefore constrained by the unyielded material. This condition causes a triaxial plastic stress field in the yielded zone. If perfectly plastic behavior is assumed (σVM = σyield) in the yielded zone, then it has been shown that the triaxiality ratio in the plastic zone will increase toward the center of a notched round bar [15], and can be estimated by:
where x is the distance from the notch [17]. From this equation it can be deduced that the smaller the notch radius, or the greater distance from the notch (within the yielded zone) the greater the hydrostatic stress, and therefore the greater the tendency for cavitation and void coalescence [19, 21]. In notched tests of metals, it is well known that the greater the triaxiality ratio in the plastic zone the greater the void growth rate [21, 22]. This is consistent with the observation in this work that the number of voids near the notch root was greatest for the razor notched specimen (with the lowest ρ) and lowest for the moderate notched specimen geometry. It was also observed that the distance of the voids to the notch was greater with for the U-shaped notches when compared to the razor notch (Figures 9 and 11). This would be expected because, for the U-shaped notch geometries, the plastic zone is larger and, therefore, the location where the hydrostatic stress is large enough to cause cavitation would be expected to be more interior than for the razor notch geometry. Taken together this suggests that, similar to metals, the triaxiality ratio in the plastic zone plays a significant role in the void formation and coalescence behavior of notched PEEK specimens.
Crazing was not evident in the unnotched geometry condition. In contrast, crazing was observed in the notched geometry conditions. According to Gensler et al [23], the occurrence of scission crazing can occur in PEEK, particularly under plane strain conditions and highly triaxial stress states where shear yielding is suppressed. Also, the Neuber solutions show that the triaxiality ratio increases toward the center of the specimen [14] (see appendix). They also show that both the hydrostatic and von Mises stresses in the elastic (unyielded zone) are greatest toward the notch (zone II in Figure 12). However, the von Mises stress in this region is not sufficient to cause yielding, while the hydrostatic stress may be great enough to cause cavitation. Therefore, it would be expected that if crazes were to form, they would form toward the notch, where the minimum hydrostatic stress necessary to initiate cavitation was reached, but where the yield stress was not reached due to the triaxiality of the region. This explanation is supported by the fracture surface appearance of the notched geometries, which showed that the crack propagates through crazed regions leaving behind a patchwork morphology. This is consistent with work by Narisawa and Ishikawa in which they observed crazes ahead of a notch in PEEK using notched 3-point bend specimens [19].
Fig. 12.
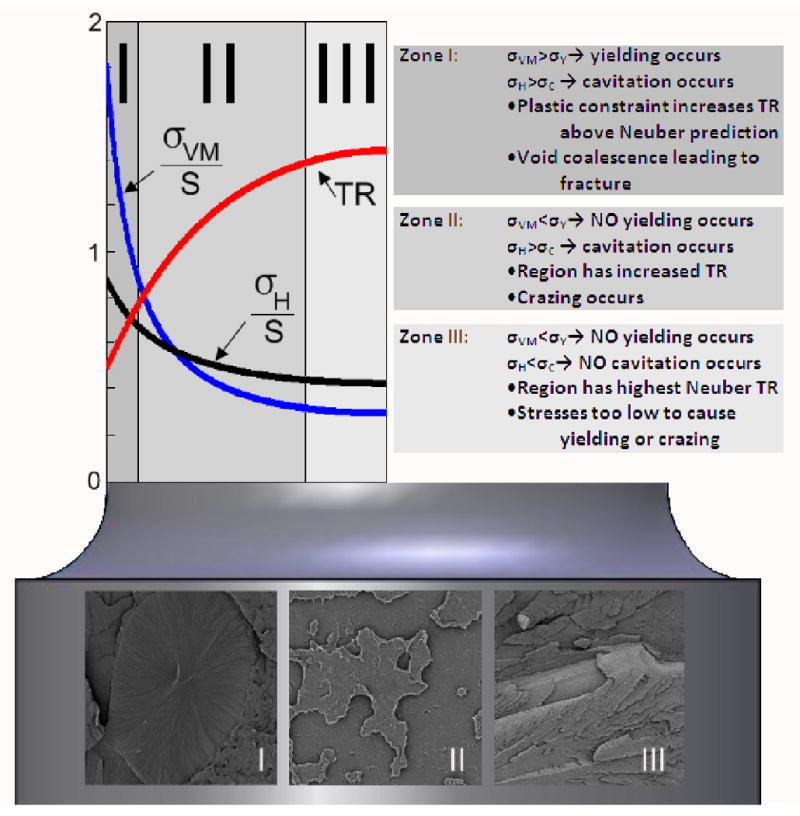
Summary of the behavior of the U-shaped notched specimens. All the plotted quantities were found using Neuber's equations. S is the nominal stress at fracture.
At the center of the specimen, the stress state is purely elastic and well below the yield stress (zone III in Figure 12). The hydrostatic stress is also at its lowest in zone III, and if it is below the minimum cavitation stress there would be no evidence of crazing. This appears to be what occurred in the notched PEEK specimens in this study. There was no evidence of crazing in the final fracture region, as the surface appears to be one of brittle fast fracture.
A limitation of this study was that, since fracture of the unnotched specimens always occurred in the region of neck advance, it was not possible to know exactly where the fracture occurred in the analyzed video. Thus, it was not possible to obtain the axial true stress and strain at fracture because the fracture plane was uncertain. Therefore, instead, the maximum axial stress and strain in a section through which the neck had completely propagated was determined. A second limitation of this study is the assumption of predominantly gross elastic behavior made in the analysis of the moderate notched specimens. There is significantly more gross plasticity in this geometry at both rates than in the deep geometry (Figure 5). Thus, modeling the entire average cross sectional behavior as elastic may overestimate the strain (since plastic deformation is incompressible and the radial strain is used to find the axial strain). However, as seen from the von Mises stress distribution determined by the Neuber analysis (Figure 7), the majority of the specimen is below yield, even at fracture, which supported use of the assumption of primarily elastic behavior of the moderate notch geometry.
Conclusions
The notched specimens demonstrated significant notch sensitivity. There was a large drop in the maximum true axial stress and maximum true axial strain (average across a cross section) upon notching. Notching caused a suppression in the overall ductility of the specimen and greatly altered the deformation and the micromechanism of fracture, by allowing for craze formation, which was not present in the unnotched (uniaxial) tested specimens. These findings support the need for careful consideration of the location and severity of notch risers in orthopaedic components utilizing PEEK.
Appendix
Geometry-Specific Testing and Analysis Methods
Poisson's ratio (ν) was taken as 0.36 and the elastic modulus (E) as 3.5 GPa, based on room temperature tests conducted and reported by the manufacturer [1, 24]. It was also assumed that the material obeys a von Mises plastic flow criterion.
Smooth Specimen Tests
To measure strain, unnotched specimens were marked with 15-17 circumferential lines throughout the length of the specimen at 2mm intervals. This divided the specimen into 14-16 sections. A video recording (960×720 pixels, 15 frames per second) was made of the tensile test for each unnotched specimen. Custom-written MATLAB programs, relying on iterative threshholding [25] and SUSAN edge detection [26] techniques, were used to find the minimum diameter and the distance between black marks, in each section of a specimen from the video of the tensile test (Figure A1).
The minimum diameter of the entire specimen was used to calculate the radial engineering strain (εradial), the nominal stress (S), and the true axial stress (σaxial) throughout the entire test.
| (1a) |
| (1b) |
| (1c) |
where r and ro are the current and the initial radii, respectively, in pixels, and P is the load.
In the initial stages the material is only deforming elastically and the axial engineering strain (εaxial) can be found in two ways, as can axial true strain (εaxial).
| (2a) |
| (2b) |
| (2c) |
Where lo is the initial distance between two black marks (in pixels) and l is the current distance in pixels between two black marks.
Once the calculated axial strain (based on ν) starts to deviate from the measured axial strain (that which is found directly using the black markings), the proportional limit has been reached. This is the point where the basic equations of elasticity are no longer applicable.
Beyond the proportional limit, some of the material is beginning to deform plastically. Therefore, the axial strain (average across the entire cross section) for the rest of the test (including necking and neck propagation) can be calculated by assuming series elastic-plastic behavior.
| (3a) |
| (3b) |
where E is the elastic modulus and all other terms are the same as previously defined. This model assumes that plastic deformation is isochoric.
Additionally, once neck propagation has been completed in a section between two black marks, those black marks can again be used to calculate the axial engineering and true strains as in equation 1 for that section.
It was also of interest to calculate the von Mises stress and strain for the purpose of obtaining the yield criterion. Necking causes a triaxial stress state in the vicinity of the neck. Therefore, the yield stress calculated solely based on current cross sectional area underestimates the maximum von Mises stress in the neck, and that is what determines the onset of plastic flow. Because tangential strain and radial strain are equal in an axisymmetric body, the von Mises strain (εVM) can be calculated as:
| (4) |
for the entire duration of the test.
Prior to neck formation the von Mises stress (σVM) can be found by
| (5) |
During neck formation, due to the geometrical constraints imposed by the neck, it is no longer permissible to assume that the von Mises stress is equal to the axial true stress. Therefore, to calculate the von Mises stress the Bridgman formula is used [27, 28].
| (6) |
Here, Rc is the radius of curvature of the neck, and r is minimum radius of the neck.
Rc vs r data was collected for three randomly selected smooth specimens at each displacement rate at several instances during the necking stage. An experimental function was created by using a polynomial curve to fit the collected data. (In this work a 5th order polynomial was found to approximate the data well: .
Once the neck has reached the propagation stage, the stress state is again uniaxial and equation 5 is once again valid in sections through which the neck has propagated. There was good agreement between the axial strain calculated using equations 3a and 3b and that found using the black marks and equations 2b and 2c in sections through which the neck had propagated (2.1±1.9% difference, depending on the specimen, with a maximum observed difference of 5%).
U-Shaped Notched Specimen Tests
Video was again utilized for the U-shaped notched specimens to acquire radial strain using a previously reported method [29]. The true axial stress and strain (average across the entire reduced cross section) were calculated using equations 1c and 2c.
Razor Notched Specimen Tests
For the razor notched specimens, only the load and crosshead displacement were recorded. Video was not utilized because the extremely narrow area of interest in the vicinity of the razor-notch made recording unfeasible with the available video system. Therefore, only the engineering fracture stress (equation 1b) could be found for the razor specimens.
Neuber Analysis
Neuber [14] derived theoretical solutions for the stresses in a cylindrical bar with a circumferential notch based on linear elasticity. At the cross section of minimum area, the hyperbolic coordinate system that Neuber used in his derivations (elliptical, hyperbolic, and tangential directions) is coincident with the axial (z), radial (r), and tangential (θ) directions of a cylindrical coordinate system. At z=0, the z,r,θ directions are also the principal basis for the stresses and strains in the specimen and therefore, Neuber's equations can be greatly simplified to the following (valid only at the minimum cross section):
| (7) |
where R is the radius of the minimum cross section, ρ is the notch radius of curvature, ν is the Poisson's ratio, and S is the nominal stress at the minimum cross section.
From the equations for the principle stresses the distributions of both the hydrostatic stress (σH(r)) and the von Mises stress (σVM(r)) can be calculated as well as the distribution of the triaxiality ratio, TR(r):
| (8a) |
| (8b) |
| (8c) |
Fig. A1. This figure illustrates the basic algorithm for analyzing one frame of the video recording of an unnotched specimen. The image is cropped. Then edge detection is run and the minimum diameter in each section is found (d9 is the minimum diameter of the 9th section). Next iterative threshholding and object detection are used. The centroids of each mark are found (* in the figure). The distance between centroids is then found for each section (l8 is the length of the 8th section). Thus, for the entire test the minimum diameter and the length of each section are known.
Footnotes
Publisher's Disclaimer: This is a PDF file of an unedited manuscript that has been accepted for publication. As a service to our customers we are providing this early version of the manuscript. The manuscript will undergo copyediting, typesetting, and review of the resulting proof before it is published in its final citable form. Please note that during the production process errors may be discovered which could affect the content, and all legal disclaimers that apply to the journal pertain.
References
- 1.Kurtz S, Devine J. PEEK biomaterials in trauma, orthopedic, and spinal implants. Biomaterials. 2007;28:4845–69. doi: 10.1016/j.biomaterials.2007.07.013. [DOI] [PMC free article] [PubMed] [Google Scholar]
- 2.Green S, Schlegel J. Polymers for the Medical Industry Proceedings. Brussels, Belgium: 2001. May 14-15, A polyaryletherketone biomaterial for use in medical implant applications. Available from: http://www.medicalpeek.org/pdf/Green_RAPRA_2001.pdf. [Google Scholar]
- 3.Scholes S, Inman I, Unsworth A, Jones E. Tribological assessment of a flexible carbon-fibre-reinforced poly(ether-ether-ketone) acetabular cup articulating against an alumina femoral head. Proceedings of the Institution of Mechanical Engineers, Part H: Journal of Engineering in Medicine. 2008;222(3):273–83. doi: 10.1243/09544119JEIM334. [DOI] [PubMed] [Google Scholar]
- 4.Collins J. Failure of materials in mechanical design. 2. New York: John Wiley & Sons; 1993. [Google Scholar]
- 5.Dowling NE. Mechanical behavior of materials: Engineering methods for deformation, fracture, and fatigue. 2. Upper Saddle River; New Jersey: Prentice Hall; 1999. [Google Scholar]
- 6.Pluvinage G. Fracture and fatigue emanating from stress concentrations. Boston: Kluwer Academic Publishers; 2003. [Google Scholar]
- 7.Pluvinage G, Gjonaj M, editors. Notch effects in fatigue and fracture. Boston: Kluwer Academic Publishers; 2001. [Google Scholar]
- 8.Goolsby R, Chatterjee A. Notch sensitivity and fractography of polyolefins. Polymer Engineering and Science. 1983;23(3):117–24. [Google Scholar]
- 9.Brillhart M, Gregory B, Botsis J. Fatigue fracture behavior of PEEK: 1. Effects of load level. Polymer. 1991;32(9):1605–11. [Google Scholar]
- 10.Tseng W. Relationship between processing, structure, fatigue crack growth, and j-integral fracture tougness of neat polyetheretherketone PhD Dissertation. The University of Texas; Arlington: 1986. Available from: http://www.proquest.com; Publication Number: AAT 8711621. [Google Scholar]
- 11.Brillhart M, Botsis J. Fatigue crack growth analysis in PEEK. International journal of fatigue. 1994;16:134–40. [Google Scholar]
- 12.Tang S, Cheang P, AbuBakar M, Khor K, Lia K. Tension-tension fatigue behavior of hydroxyapatite reinforced polyetheretherketon composites. International Journal of Fatigue. 2004;26:49–57. [Google Scholar]
- 13.Flores K, Dauskardt R. Mean stress effects on flow localization and failure in a bulk metallic glass. Acta Materialia. 2001;49:2527–37. [Google Scholar]
- 14.Neuber H. Theory of notch stresses: Principles for exact calculation of strength with reference to structural form and material. United States Atomic Energy Commision, Office of Technical Information. 1961 [Google Scholar]
- 15.Cao J. Studies on the mechanism of the instability of polymers in tensile testing. Journal of Applied Polymer Science. 1992;45:2169–79. [Google Scholar]
- 16.Pawlak A, Galeski A. Plastic deformation of crystalline polymers: The role of cavitation and crystal plasticity. Macromolecules. 2005;38:9688–97. [Google Scholar]
- 17.Cheng L, Guo T. Void interaction and coalescence in polymeric materials. International Journal of Solids and Structures. 2007;44:1787–808. [Google Scholar]
- 18.Belayachi N, Benseddiq N, Naït-Abdelaziz M, Hamdi A. On cavitation and macroscopic behaviour of amorphous polymer-rubber blends. Science and Technology of Advanced Materials. 2008;9:1–6. doi: 10.1088/1468-6996/9/2/025008. [DOI] [PMC free article] [PubMed] [Google Scholar]
- 19.Narisawa I, Ishikawa M. Crazing in semicrystalline thermoplastics. In: Kausch H, editor. Crazing in polymers. New York: Springer-Verlag; 1990. [Google Scholar]
- 20.Taylor D. The theory of critical distances. London: Elsevier; 2007. [Google Scholar]
- 21.Doglione R, Firrao D. Inclusion effect on the notch behavior of a low alloy steel. In: Pluvinage G, Gjonaj M, editors. Notch effect in fatigue and fracture. Boston: Kluwer Academic Publishers; 2001. [Google Scholar]
- 22.Tähtinen S, Laukkanen A, Singh BN. Damage mechanisms and fracture toughness of GlidCop® CuAl 125 IG0 copper alloy. Journal of Nuclear Materials. 2000:283–287. (Part 2):1028-32. [Google Scholar]
- 23.Gensler R, Plummer J, Kausch H, Munstedt H. Thin film and bulk deformation behaviour of poly(ether ether ketone)/poly(ether imide) blends. Journal of Materials Science. 1997;32:3037–42. [Google Scholar]
- 24.Invibio I. [07/06/08]; Available from: http://www.invibio.com/documents/BROCHURE--PEEK-OPTIMA_Carbon_Fiber.pdf.
- 25.Wu H, Barba J, Gil J. Iterative thresholding for segmentation of cells from noisy images. Journal of Microscopy. 2000;197(3):296–304. doi: 10.1046/j.1365-2818.2000.00653.x. [DOI] [PubMed] [Google Scholar]
- 26.Smith S, Brady J. Susan - a new approach to low level image processing. International Journal of Computer Vision. 1997;23(1):45–78. [Google Scholar]
- 27.Dahoun A, Aboulfaraj M, G'Sell C, Molinari A, Canova G. Plastic behavior and deformation textures of poly(etherether ketone) under uniaxial tension and simple sheal. Polymer Engineering and Science. 1995;35(4):317–30. [Google Scholar]
- 28.La Rosa G, Mirone G, Risitano A. Postnecking elastoplastic characterization: Degree of approximation in the bridgman method and properties of the flow-stress/true-stress ratio. Metallurgical and Materials Transactions. 2003;34A:615–24. [Google Scholar]
- 29.Sobieraj MC, Kurtz SM, Rimnac CM. Notch strengthening and hardening behavior of conventional and highly crosslinked UHMWPE under applied tensile loading. Biomaterials. 2005;26:3411–26. doi: 10.1016/j.biomaterials.2004.09.031. [DOI] [PubMed] [Google Scholar]


