Abstract
A sensor for the lethal bacterial enzyme, botulinum neurotoxin type A (BoNT/A), was developed using self-assembled monolayers (SAMs). SAMs consisting of an immobilized synthetic peptide that mimicked the toxin’s in vivo SNAP-25 protein substrate were formed on Au and interfaced with arrayed microfluidic channels. Efforts to optimize SAM composition and assay conditions for greatest reaction efficiency and sensitivity are described in detail. Channel design provided facile fluid manipulation, sample incubation, analyte concentration, and fluorescence detection all within a single microfluidic channel, thus avoiding sample transfer and loss. Peptide SAMs were exposed to varying concentrations of BoNT/A or its catalytic light chain (ALC), resulting in enzymatic cleavage of the peptide substrate from the surface. Fluorescence detection was achieved down to 20 pg/mL ALC and 3 pg/ mL BoNT/A in 3 h. Toxin sensing was also accomplished in vegetable soup, demonstrating practicality of the method. The modular design of this microfluidic SAM platform allows for extension to sensing other toxins that operate via enzymatic cleavage, such as the remaining BoNT serotypes B–G, anthrax, and tetanus toxin.
Botulinum neurotoxin (BoNT), derived from the anaerobe Clostridium botulinum, is among the most poisonous substances known with an oral lethal dose of ~70 µg for an adult human.1 Seven immunologically distinct types exist (A–G), each of which enzymatically cleaves a target neuronal substrate, leading to flaccid paralysis associated with botulism. Because of its potency, accidental or intentional BoNT contamination of food or drink poses a severe threat to human and animal health. Currently, the only accepted means of BoNT detection is the mouse bioassay, which requires animal sacrifice, highly trained personnel, and special facilities. In addition, the assay itself is low throughput (one mouse equals one data point) and typically takes 2–4 days for a readout.
Alternative BoNT detection methods are desirable, as evidenced by the recent development of assays centered on ELISA,2–4 PCR,5,6 and mass spectrometry7 as well as other immuno- and cleavage-based assays.8–16 ELISA, while well-characterized and easily formatted for 96- or 384-well plate assays, suffers from insensitivity and cross-reactivity at BoNT concentrations below ~0.1 ng/mL.4 It is paramount to homeland security to develop inexpensive, reliable sensors that can detect low levels of BoNT (30 pg/mL or less has been recommended17). In addition to efficient design and implementation, the sensor should be robust for field deployment and amenable to high throughput, multiplexed sensing.
Recently, we introduced a novel microfluidic assay capable of detecting BoNT type A (BoNT/A) enzyme activity by using substrate-laden beads and measuring the extent of cleavage.15 This sensor performed well with buffered samples and displayed a BoNT/A detection limit of 10 pg/mL; however, output was dependent on the amount of beads present in the sample reservoir and therefore led to greater interassay error, a common drawback among other bead-based BoNT sensors.3,14 A new BoNT/A sensor that retains the same enzymatic sensing principles but uses self-assembled monolayers (SAMs) as the means of substrate presentation has since been developed. SAMs display an immobilized, fluorescent peptide substrate specific for the type A toxin; BoNT/A recognizes and cleaves the surface substrate, releasing fluorescently labeled fragments into bulk solution for detection and quantification. Tethering the BoNT substrate to preformed SAMs rather than beads of a heterogeneous distribution allows for better control over the amount, density, and orientation of substrate on the surface,18 thus diminishing experimental error. Additionally, nonspecific protein adsorption can be limited by modifying the background molecules comprising the SAM (i.e., adding oligo- (ethylene glycol)19,20 or perfluorinated alkanethiols21).
Because of the flexibility in SAM design, biologically active monolayers have been used for detecting and understanding enzyme activity22–24 and or monitoring cellular processes,25 but relatively few systems exist for sensing bacterial toxins such as BoNT.26,27 In response, we have combined surface chemistry with microfluidic technology to create a versatile, modular platform for sensing BoNT whereby there are limitless combinations of SAM, biomolecule, and channel designs. By adapting SAM technology to microfluidics, we can also capitalize on increased throughput and lower sample volumes to develop a portable analytical system. Mangru and co-workers recently formatted a BoNT inhibitor-screening assay for the microscale by using a FRET peptide substrate within microchannels; however, the device was complex, requiring extensive fluidic components for flow manipulation in addition to multiple inlet and outlet ports for reagent addition/removal.28
Toward simplicity, our entire cleavage assay (sample introduction, incubation, and product detection) takes place in a single channel. We have arrayed 40 microchannels to achieve simultaneous BoNT/A sensing, with the possibility of scaling up to hundreds of channels upon interfacing with robotic pipetters and/or on-chip detectors.29 Using this SAM-based microfluidic sensor, we have been able to sense even lower levels of both the BoNT/A holotoxin and its catalytic light chain by improving and expanding upon our previous detection technologies (beads,3,15 hydrogels12). While our assay has been designed specifically for detecting type A BoNT, it may be possible to sense other toxins that enzymatically cleave a known substrate using this platform. We discuss optimization of SAM composition regarding peptide density and toxin recognition/cleavage, sensor performance, and lastly, we consider the utility of the sensor in the field with respect to multiplexed sensing of BoNT in complex matrixes such as suspect food and drink.
EXPERIMENTAL SECTION
Trifluoroacetic acid (TFA) was purchased from Aldrich Chemicals. Tween-20 was purchased from Acros Organics. All other reagents were obtained from Fisher Scientific. Botulinum neurotoxin type A (holotoxin and light chain) was generously provided by the Johnson laboratory in the Department of Food Microbiology and Toxicology at the University of Wisconsin-Madison. Deionized ultrafiltered (DIUF) water was used for all solutions. A NanoDrop 3300 fluorospectrometer (Thermo Scientific) or a Synergy plate reader (BioTek, Winooski, VT) was used for off-chip fluorescence measurements. All fluorescent microchannel images were taken on an Olympus IX70 microscope with Meta-morph software. A GeneTAC UC4 × 4 imager (Genomic Solutions, Ann Arbor, MI) was used for fluorescent Au surface scans; all scans used a blue laser and a 512 nm BP filter for fluorescein with the photomultiplier tube (PMT) gain adjusted per sample for optimal sensitivity. All images (surface or microscopy) were processed using ImageJ freeware (National Institutes of Health).
BoNT/A Substrate Synthesis
Fluorescent SNAP peptide (flu-SNAP), a 24mer representing SNAP-25 residues 187–203, was synthesized on a Symphony instrument (Protein Technologies, Tuscon, AZ) in the UW-Madison Peptide Synthesis Facility using standard solid phase synthesis methods on Rink Amide resin (EMD Biosciences Novabiochem, San Diego, CA). Peptide was deprotected for 4 h using a TFA cocktail containing 5% (v/v) thioanisole (Acros Organics) and 2.5% (v/v) ethanedithiol (Alfa Aesar). Flu-SNAP was purified using reverse-phase HPLC on a 5 µm preparative scale C-18 column using a 15–50% gradient of 0.08% TFA in acetonitrile (ACN) against 0.1% TFA. Flu-SNAP peptide with an E11Q substitution (flu-SNAPQ) was purchased at > 90% purity from Genscript (Piscataway, NJ). Both peptides were C-terminus amidated, contained an N-terminus fluorescein (flu) (Novabiochem’s 5-carboxyfluorescein used for in-house synthesis of flu-SNAP), and had multiple modifications to enhance toxin recognition (described previously, ref 15). Lyophilized peptides were dissolved in DIUF and stored at −20 °C until use.
Recombinant partial SNAP-25 protein (rSNAP, 8.5 kDa) representing SNAP-25 residues 141–206 was expressed with cysteines at both termini and purified according to a protocol outlined in the Supporting Information. rSNAP (0.1 mg/mL in 2× saline-sodium phosphate-EDTA (SSPE) buffer containing 6:1 tris(2-carboxyethyl)phosphine (TCEP, Pierce) to Cys) was fluorescently labeled by adding 30:1 molar excess fluorescein-5-maleimide (Pierce) and reacting at 4 °C overnight. Flu-rSNAP was purified by dialysis against HEPES-buffered saline (HBS, 10 mM HEPES, 150 mM NaCl, pH 7.2) and stored at −20 °C until use.
HPLC of flu-SNAP and flu-SNAPQ with BoNT/A Light Chain
RP-HPLC was used to compare toxin recognition of the synthetic 2.8 kDa SNAP peptide substrates in solution. A Prominence HPLC (LC-20AT) with a PDA detector (SPD-M20A) and a 5 µm C18 column were used (Shimadzu Corp.). Mobile phase consisted of 0.1% TFA in HPLC grade ACN. BoNT/A light chain (2 µg/mL) was added to 100 µM flu-peptide dissolved in 30 mM HEPES with 1 mg/mL BSA and incubated at 37 °C. Aliquots (20 µL) were removed at designated time points, and the pH was lowered to 2 with a 1% TFA solution. Chromatograms with peak height and area data were generated using Shimadzu EZStart software.
Device Fabrication
Microchannels were fabricated using standard soft lithography and PDMS (Sylgaard 184, Dow Corning). Molds (masters) were created by coating SU-8 100 photo-resist (MicroChem) on a silicon wafer. The first layer (250 µm) defined the channel, and the second layer (250 µm) defined the ports. Channel dimensions: 5 mm × 0.75 mm, l × w. Port radii: 0.750 mm (input) and 0.375 mm (detection). Dimensions are included graphically in Figure 1 in the Supporting Information. The master-making process is described in detail elsewhere.30 PDMS was poured on the resulting master, covered with transparency film, and weighted with 20 lb to ensure complete port formation without thin films covering them. This stack was baked on a hot plate at 80 °C for 3 h after which the PDMS was peeled off the master and placed on a Au-patterned slide containing preassembled monolayers.
Figure 1.
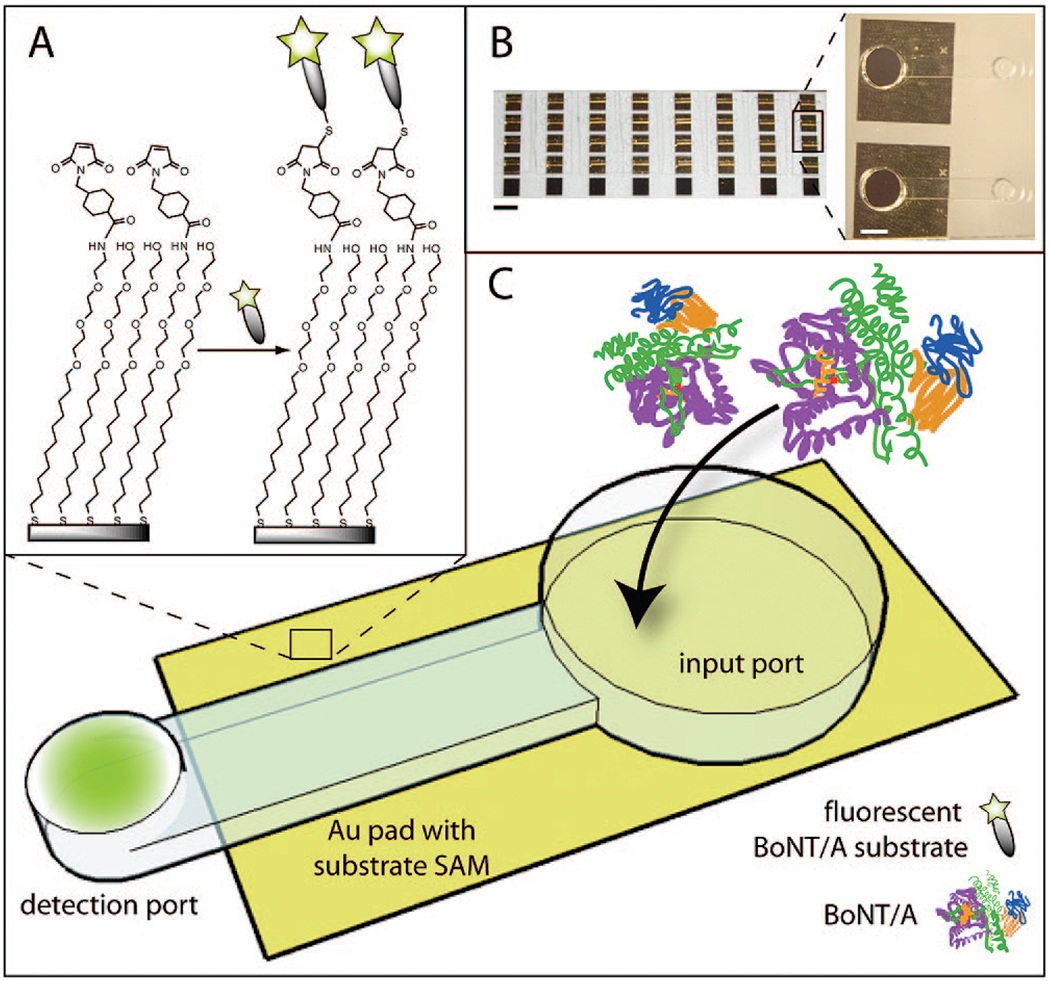
Sensor schematic: (A) SAM formation on Au yields mixed monolayers of amine- and hydroxyl-terminated alkanethiols presenting the BoNT/A enzymatic substrate. (B) PDMS microchannels on 40 arrayed Au pads (10.5 mm2) (scale bar = 5 mm) with inset image representing two neighboring channels (scale bar = 1 mm). (C) BoNT/A is added at input port and incubated on SAMs, during which time it can cleave the immobilized substrate, releasing fluorescent fragments into solution. Flu-labeled fragments are concentrated at detection port via evaporation.
Self-Assembled Monolayer Formation
Au slides (1 in. × 3 in., Evaporated Metal Films, Ithaca, NY) were patterned to form discrete 10.5 mm2 “pads” onto which monolayers would be formed. Slides were evenly spin-coated with Shipley STR-1045 positive photoresist (PR) and soft-baked for 15 min at 115 °C. A pattern of 40 arrayed pads was transferred to the slide by UV exposure at 20 mW/cm2 for 50 s. Pattern was developed in Shipley MF-321 developer and hard-baked for 30 min at 120 °C. Au was removed using Transene Au etch (GE-8148). Ti binder layer was removed with a 1% HF solution. Remaining PR was washed off with acetone.
Patterned Au slides were immersed overnight in 1 mM ethanolic solutions containing amino (X = NH2)- and hydroxy (X = OH)-terminated tri(ethylene glycol) (EG3) undecanethiols (HS(CH2)11EG3X) (Prochimia, Poland) in various weight ratios. Sulfo-succinimidyl-4-(N-maleimidomethyl)cyclohexane-1-carboxylate (sSMCC, Pierce) was dissolved in 0.1 M triethanolamine (TEOA) buffer, pH 8.0, and added to the SAMs for 45 min to convert amine headgroups into thiol-reactive maleimide moieties. Cysteine-containing peptide (30 µM flu-SNAP or flu-SNAPQ in 1× PBS, pH 7.3) or protein (11 µM flu-rSNAP in HBS) substrate was then incubated on Au surfaces for 2 h to form the final toxin-recognizable SAM.
To remove excess and nonspecifically adsorbed peptide or protein, we adopted a wash routine from Schmidt et al.9 wherein SAMs were soaked sequentially for 45 min at room temperature (RT) in 50 mM Tris/0.1% Tween-20 (T-T) with 5 mM EDTA and 40 mM 2-mercaptoethanol; 10 mg/mL BSA in T-T; and T-T (3×). Surfaces were either stored dry under argon at 4 °C or were interfaced with PDMS microchannels for immediate use.
Sensor Testing with BoNT/A Holotoxin and Light Chain
Toxin cleavage experiments designed to optimize SAM composition/peptide density, immobilized substrate, and assay time/temperature were carried out using the recombinant BoNT/A 50 kDa light chain (ALC) as a nontoxic substitute. Detection limits and sensor performance upon optimization were performed using both ALC and the live BoNT/A holotoxin. ALC samples were diluted from a frozen 2 mg/mL stock in 30 mM HEPES, pH 7.4, to a desired concentration. The control buffer for all ALC experimentation was HEPES buffer. Concentrated BoNT/A holotoxin was reduced with 50 mM dithiothreitol (DTT) at RT for 45 min. Stock BoNT/A solutions (0.1 mg/mL) were then diluted in 30 mM HEPES with 1 mg/mL BSA, pH 7.4, keeping the DTT concentration at 1.3 mM to prevent oxidation. The control buffer for all BoNT/A experimentation was HEPES/BSA/DTT. Note: All work with BoNT holotoxin must take place in certified BSL 2 laboratories with the proper safety precautions. For experimentation with toxin in food, vegetable soup was centrifuged at 7500 rpm for 5 min to remove larger components. Supernatant was removed and diluted 1:1 in respective assay buffer.
ALC or reduced BoNT/A holotoxin was added to SAMs in either PDMS microchannels (4 µL/channel) or silicone microwells (Grace Bio-Laboratories, Bend, OR) (9 µL/well), depending on the assay, and incubated in a humidifed environment at 30 °C for 2.5 h. If added to microwells, 24 wells could be incubated simultaneously; upon completion of the assay, solution was transferred to black 384-well plates (Nunc) for fluorescence quantification using a plate reader or read directly using a NanoDrop. If added to microchannels, up to 40 channels were incubated simultaneously; upon completion, 10 µL droplets of DIUF were placed on the reservoir ports and evaporation was allowed to take place in a nonhumidified environment for 35 min as described previously.15,31 Detection ports were imaged via fluorescence microscopy for quantification. If imaging (scanning) fluorescent SAMs directly, surfaces were rinsed with DIUF and dried with N2 before adding 1× SSPE and a glass coverslip.
Data Processing
Individual datum “z scores” were used to remove outliers (Supporting Information): data with a z score above an arbitrary 2.5 cutoff were chosen to be excluded from the data set as the probability that z > 2.5 is very small for a data set with an otherwise normal distribution. For all data, mean and standard deviation, s, were calculated and often normalized to a control (blank) signal. Standard error (SE, s/(n)1/2) was plotted as y-axis error bars to reflect population distribution. A one- or two-tailed t-test (depending on experimental hypothesis) was performed to determine signal significance with P < 0.05 considered significant.
RESULTS AND DISCUSSION
Sensor Design
Various new BoNT sensors have been explored as alternatives to the mouse bioassay. Unfortunately, many of these assays would not be amenable to on-site, rapid testing of suspect samples due to assay-specific drawbacks such as bulky instrumentation, tedious protocols requiring multiple sample transfers, or costly reagents, to name a few. Toward a portable, easy-to-use sensor with a limit of detection (LOD) comparable to the mouse bioassay, we integrated all assay reagents, steps, and readout into a single microchannel. This was accomplished through the formation of toxin-recognizable self-assembled monolayers (SAMs) and through a microchannel assay design that did not require any external pumps, valves, or tubing.
To sense BoNT type A (BoNT/A) enzyme activity, SAMs were designed to display a fluorescent, toxin-recognizable substrate that could be cleaved, releasing fluorophore into solution. SAMs with free maleimide moieties exposed among a background of “bioinert” EG3 groups were chosen for selective conjugation to the C-terminal cysteine of a synthetic BoNT/A substrate (Figure 1A). SAMs were formed on patterned Au pads, with each pad accommodating a single microchannel for maximal interaction with the toxin solution (Figure 1B), thus offering a distinct advantage over many existing assays. As compared to the traditional 96-well plates, for example, microchannels have higher surface area-to-volume ratios and shorter diffusion lengths, which together have been shown to enhance enzymatic reactions at the microscale.32,33
Each channel consisted of a large input port (r, 750 µm) connected to a detection port (r, 375 µm) with a total volume of 1.8 µL (Figure 1C). The input port and a majority of the channel allowed the toxin to access the substrate SAM, whereas the detection port was laid atop the clear glass portions of the patterned slide for fluorescence detection of cleaved products. As detailed in previous work,15 this design-consisting of a larger input port and smaller detection port-also provided for a built-in amplification mechanism via evaporative flow, thereby intensifying the fluorescent output signal. Briefly, a large droplet (10 µL) is placed on the input port and serves to replenish the channel as evaporation occurs rapidly from the detection port, thus inducing fluid flow downstream. As a result, cleaved flu-peptide fragments are concentrated in the smaller-volume detection port.31
The current channel design differs from our previous work detailing a “diffusion valve” in that it offers increased interaction of toxin solution with the flu-SNAP SAM by exposing a greater surface area: 0.047 cm2 of Au versus 0.034 cm2 with the previous design. In addition, the input port is not the large, exposed reservoir that had been designed specifically for maximal interaction of spherical beads with <1 µL of solution. Lastly, the channel itself is only constricted in height to easily allow capillary filling. Since evaporation sets the flow rate, decreasing the channel cross-sectional area would proportionally increase velocity of fluid flowing toward the detection port; as such, a more constricted channel better counters analyte diffusion out of the detection port. The extent of analyte concentration, however, relies primarily on the ratio of port volumes (Vinput/Vdetection). With the current channel design, a maximum amplification of 4 is theoretically obtainable and, although approximately 2-fold less than the diffusion valve, has experimentally proven sufficient for detecting low levels of botulinum toxin.
Surface Characterization
The SAM-based microfluidic sensor relies on the enzymatic activity inherent to BoNTs, wherein the toxin cleaves the fluorescently labeled peptide substrate immobilized on the surface. Fluorescent output at the microchannel detection port signals the presence of the toxin in the suspect sample. Three substrate candidates were screened for their ability to be recognized and cleaved by BoNT/A once immobilized on the Au surface. Once the best substrate was chosen, mixed SAM composition and assay conditions were optimized for maximal cleavage toward sensing BoNT/A at or below the recommended LOD of 30 pg/mL.17
Substrate Compatibility
BoNT/A is a disulfide-linked, dichain (heavy and light) 150 kDa polypeptide that specifically cleaves the 25 kDa SNAP-25 (synaptosomal-associated protein) in the synaptic cleft, thereby blocking exocytosis of neurotransmitters. Short peptides that mimic the BoNT/A cleavage site within the SNAP-25 sequence have been described in the literature.34,35 Known substrates can then be used to monitor BoNT/A proteolysis.
Three different SNAP-25-derived substrate candidates were monitored for the extent of BoNT/A cleavage. The first substrate was the recombinant partial SNAP-25 protein (rSNAP) representing residues 141–206 and expressed with cysteine at each terminus for both conjugation to the fluorophore and immobilization on thiol-reactive SAMs. The other two substrates were synthetic 24mer peptides, flu-SNAP and flu-SNAPQ, both adopted from SNAP-25 residues 187–203 and containing an N-terminus fluorescein. Flu-SNAP was a previously described peptide with the sequence: GGGSNRTRIDEANQRATR{Nle}LGGGC.15 Flu-SNAPQ was synthesized with an E11Q substitution, which purportedly decreases the Km, leading to a doubled initial rate of peptide hydrolysis by type A BoNT.35
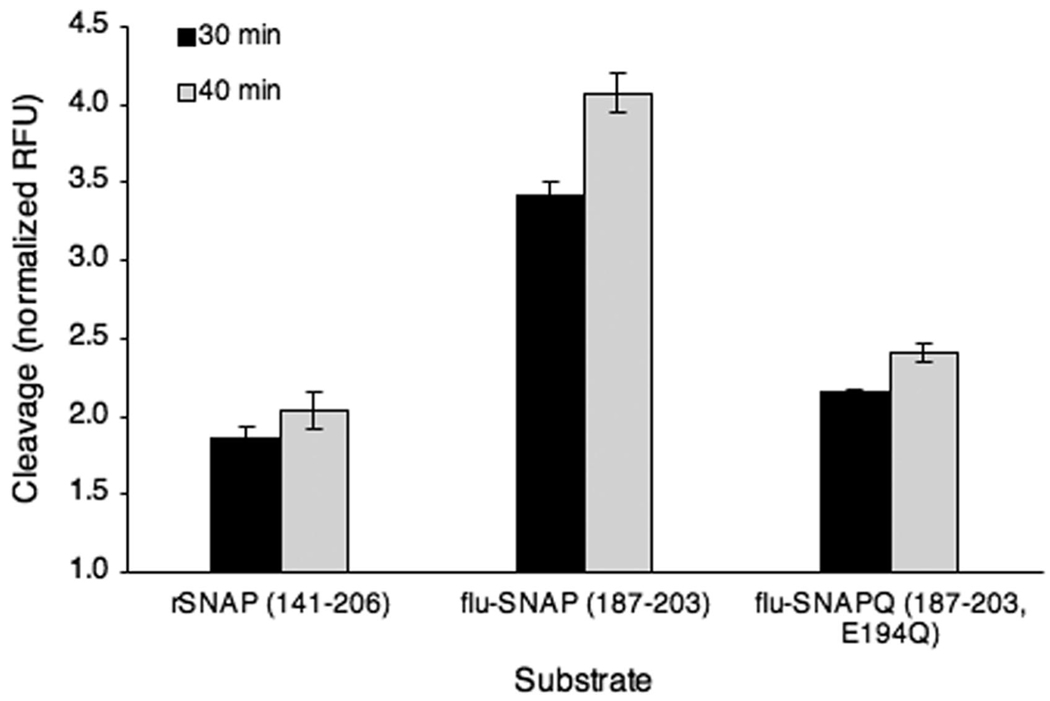
Each substrate was tethered to a series of Au pads using sSMCC, a heterobifunctional cross-linker reactive for both thiols (Cys residues in all substrates) and amines (displayed by SAM). Substrate SAMs were exposed to 2 µg/mL BoNT/A light chain (ALC), the catalytic domain of the live BoNT/A holotoxin that is nontoxic in vivo,36 in straight PDMS microchannels. Fluorescence microscopy after incubation and evaporative concentration of fluorescent cleavage product revealed ALC’s preference for immobilized flu-SNAP as compared to both rSNAP and the Gln-substituted flu-SNAPQ (Figure 2). Normalized averages to a buffer control show 1.8- and 1.6-fold greater cleavage for the flu-SNAP substrate when compared to rSNAP and flu-SNAPQ, respectively, after 30 min of evaporation (black bars). Notably, 10 extra minutes of evaporation (40 min total) allowed for a 19% increase in the cleaved flu-SNAP signal intensity, providing a 2-fold greater fluorescence output than the other two substrates (gray bars). This is a significant amplification in a short period of time considering the autonomy of the concentrating mechanism wherein no extra fluid addition or manipulation was required.
Figure 2.
Substrate cleavage at the surface. Three SNAP-25-derived substrate candidates immobilized on Au SAMs, peptides flu-SNAP (residues 187–203) and flu-SNAPQ (residues 187–203 with Gln substitution) as well as the recombinant SNAP-25 (rSNAP, residues 141–206), were cleaved by 2 µg/mL ALC over the course of 3 h. All sample groups, n = 4.
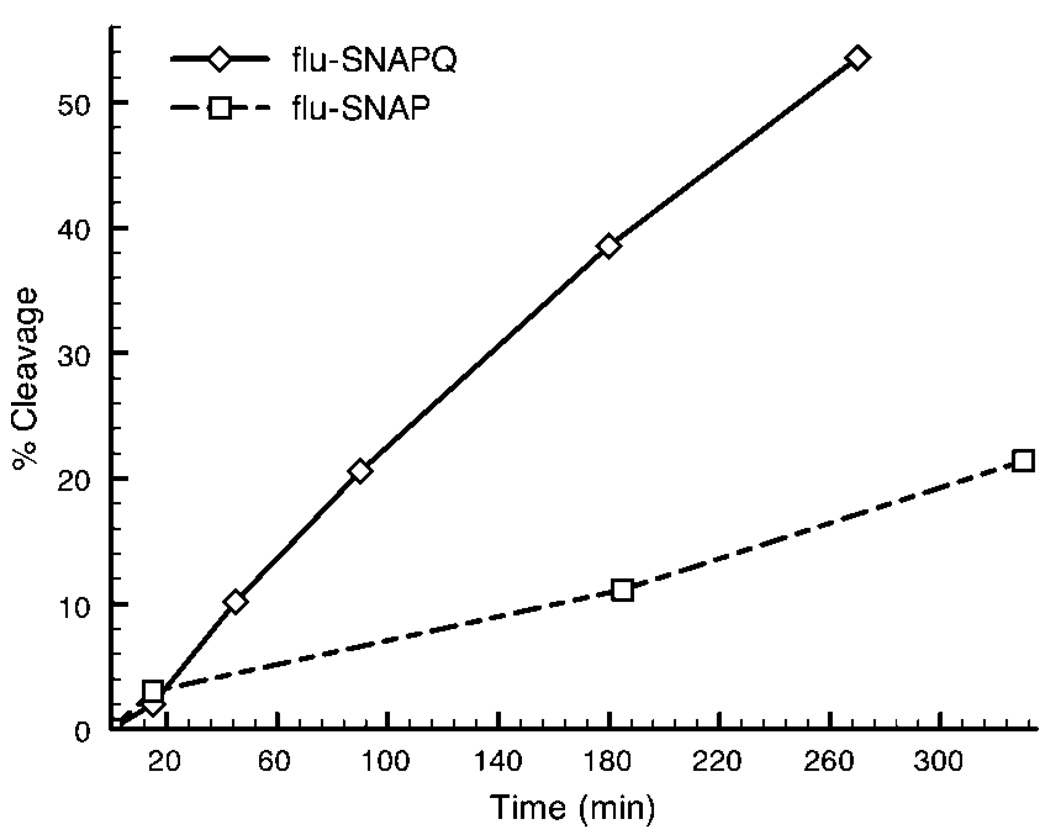
Preferential ALC cleavage of flu-SNAP with respect to the Gln-substituted flu-SNAPQ is surprising given BoNT’s opposite response to the peptides in solution. HPLC chromatographic data display rapid ALC cleavage of flu-SNAPQ in solution, with a slower, incomplete response to flu-SNAP (Figure 3). After 180 min (typical assay time), 11% of flu-SNAP and 39% of flu-SNAPQ were cleaved by 2 µg/mL ALC, echoing previous reports that flu-SNAPQ is a “better” substrate under substrate-limiting conditions.34 Immobilization of flu-SNAPQ appears to lower its ability to function as a suitable substrate for the BoNT/A light chain, presumably by forcing a less favorable conformation via lateral crowding or steric interactions at the surface.37,38 Conversely, tethering flu-SNAP to the surface appears to enhance substrate recognition by the toxin as compared to solution kinetics. As such, the flu-SNAP peptide substrate was used for sensing BoNT/A cleavage in conjunction with the optimal mixed monolayer described later.
Figure 3.
Substrate cleavage in bulk solution. HPLC reveals preference of ALC (2 µg/mL) for the Gln-substituted flu-SNAPQ, with over 50% cleaved in 260 min. After nearly 500 min, the toxin only cleaved 35% of the other synthetic SNAP-25 mimic, the flu-SNAP peptide (not shown). Immobilized on a surface, however, flu-SNAP is the preferred substrate, as determined experimentally (Figure 2).
Density of Mixed SAMs
Varying ratios of amine- to hydroxy-terminated EG3 alkanethiols were used to form mixed monolayers on Au. The reactive amine group was added at percentages ranging from 1 to 50% (w/w) with hydroxyl headgroups filling the remaining area. Flu-SNAP was then tethered to the SAMs, as illustrated in Figure 1A, using silicone microwells to define discrete circular areas (3.1 mm2). Resulting surface scans (n= 6 per group) revealed the highest fluorescence intensity at 20% amine groups, with diminishing intensities both above and below this percentage (Figure 4A). Fluorescence intensity does not necessarily allow for quantitative surface calculations because of the nonlinear correlation between intensity and the amount of fluorophore attached to the SAM, but can give a qualitative view of the functionalized surfaces.39 At 20:80 NH2:OH, the peptide may be allowed to adopt a denser monolayer, whereas at higher percentages, the peptide aggregates as globular entities that inhibit dense immobilization. Another possible explanation for decreased surface fluorescence at high NH2 (active group) percentages (30–50%) is intermolecular quenching due to fluorophore proximity within the range of Förster radii (10–100 Å).39,40 At lower NH2 percentages (1–10%), peptide is more sparsely distributed on the SAM.
Figure 4.
(A) Surface density as qualitatively related to scanned fluorescence intensity at 520 nm (50 µm resolution). (B) Extent of ALC cleavage with respect to mixed monolayer composition. SAMs comprised of varying ratios of amine:hydroxyl headgroups were exposed to 20 µg/mL ALC. Fluorescence intensity of solution removed from microwells was quantified in a standard plate reader. (C) Flu-SNAP SAMs of (1–20% amines) were either exposed to ALC (20 µg/mL) or a HEPES control buffer without toxin in microchannels. The extent of cleavage was determined by comparing pixel intensities. The most fluorescent monolayer (20% NH2) corresponded to the highest rate of ALC enzyme activity at the surface.
Optimizing Cleavage Assay with BoNT/A Light Chain
The highest surface fluorescence intensity occurred at 20% amines; however, this does not readily translate to optimal cleavage. To determine which mixed monolayer promotes the greatest extent of peptide cleavage by the toxin, SAMs were again varied in composition with amine percentages ranging from 1–50% and exposed to the BoNT/A light chain. ALC (20 µg/mL) was incubated on the surface in individual silicone microwells. Fluorescence intensity comparison of solution removed (n = 6 per group) from the microwells after 2.5 h incubation indicated optimal cleavage at 20% amine groups, averaging ~1.3-fold greater cleavage than both the 10% and 30% surfaces (P < 0.01) (Figure 4B).
To obtain a comprehensive “before and after” view of the SAMs with respect to toxin-mediated cleavage, flu-SNAP was immobilized in discrete regions on Au surfaces by patterning with PDMS microchannels. Figure 4C includes the four surfaces used, 1–20% amines, with scanned fluorescence intensities before (gray bars) and after (black bars) 20 µg/mL ALC cleavage. Average intensities were calculated for each channel (n = 3). The 20% amine surface again produced the greatest initial fluorescence in the absence of cleavage (buffer control). Intensities after toxin cleavage reveal a 53% decrease in surface flu-SNAP with 20% amines, a 40% decrease with 10% amines, and a 9% and 14% decrease with 5% and 1% amines, respectively (Figure 4C). The data in Figure 4B–C suggest that the preferential flu-SNAP conformation for toxin recognition and cleavage occurs at a SAM composition of 20% amines with 80% background hydroxyl headgroups. This monolayer composition was therefore used for all testing and further assay characterization. However, the percentage of active groups (i.e., amine, carboxyl, azide) in any mixed monolayer should be optimized for individual enzymes as each has different requirements for substrate recognition, which can be altered upon surface immobilization.
Lastly, parameters such as time, temperature, and extraneous sample components need to be controlled to ensure BoNT activity in vitro. We compared “elevated” temperature (30 °C) to room temperature (RT, ~24 °C) and sample buffer (30 mM HEPES, pH 7.3 with 1 mg/mL BSA) with and without 1.3 mM DTT, a reducing agent used to maximize toxin activity in vitro yet known to disrupt metal-thiol bonds41 such as the SAM Au-S bond. An elevated temperature of 30 °C was chosen rather than the typical BoNT assay temperature of 37 °C as our experimental observations indicate 2-fold greater signal output at the former.15 Similarly, Jones et al. have noticed enhanced readout for a BoNT cleavage assay at room temperature (versus 37 °C).16 For this reason, we examined assay performance at two relatively lower temperatures, 30 °C and RT.
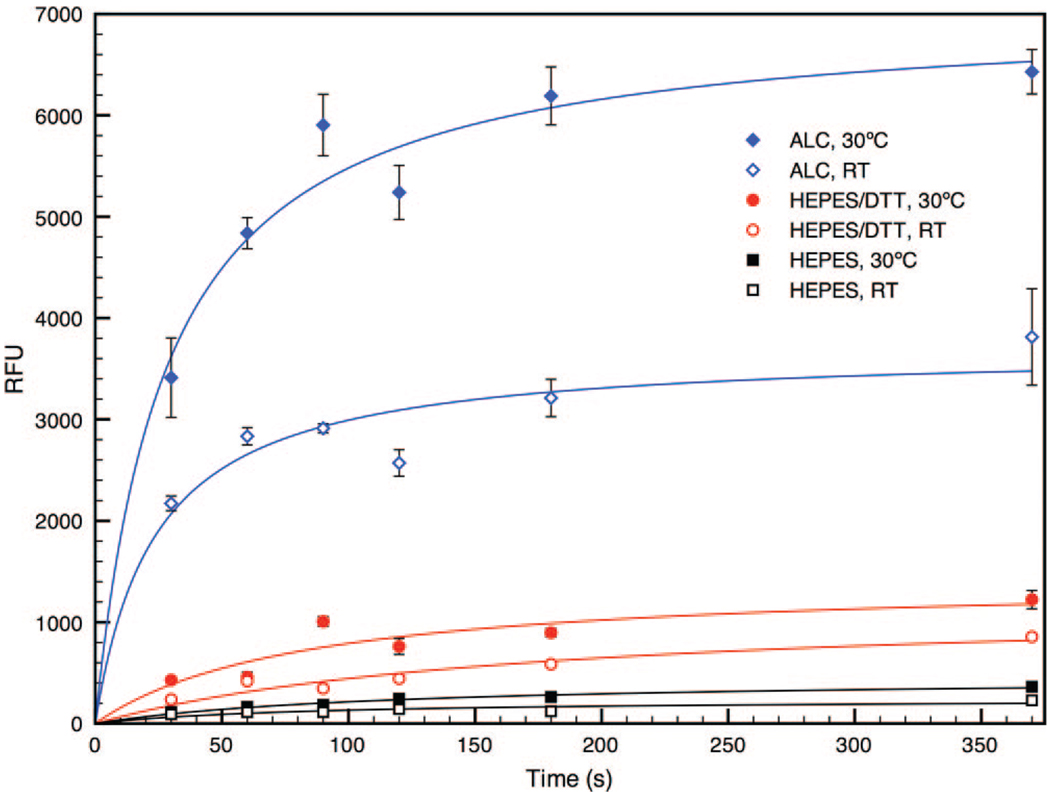
Fluorescence output was plotted at multiple time points over the course of 6 h as ALC (50 µg/mL) cleaved flu-SNAP from the SAMs under specified conditions (Figure 5). Data were fit using nonlinear trendlines in order to show generalized surface response to both ALC and buffer controls. During the assay, fluorescent signals resulting from ALC enzyme activity remained, on average, 23- and 19-fold greater than the control buffer at elevated and RT, respectively. The extent of ALC-mediated flu-SNAP cleavage increased over 6 h at both temperatures, with the 30 °C assay outputting signals nearly twice as intense as those obtained at RT. It is clear that the control buffer, HEPES without DTT, did not produce a significant signal. The buffer sample containing DTT did produce a small signal that increased over time, most likely due to thiol exchange at the Au surface,41 which results in the removal of the entire flu-SNAP conjugated alkanethiolates. However, DTT at such low concentrations (1.3 mM) is not detrimental to assay readout if properly controlled for. Lastly, it is also evident from Figure 5 that a shorter assay time (<3 h) is sufficient for sensing the toxin with signals easily distinguishable from the controls.
Figure 5.
BoNT/A light chain (50 µg/mL in HEPES) response to flu-SNAP SAMs at RT (blue ◇) and at 30 °C (blue ◆). ALC was able to cleave more flu-SNAP at elevated temperatures, producing fluorescent signals twice as intense as corresponding measurements at RT. The HEPES buffer control containing 1.3 mM DTT (black squares) produced a slight signal as a result of thiol exchange at the Au surface, whereas the HEPES control without DTT (red circles) produced negligible signals. Solid lines represent nonlinear fits to the data.
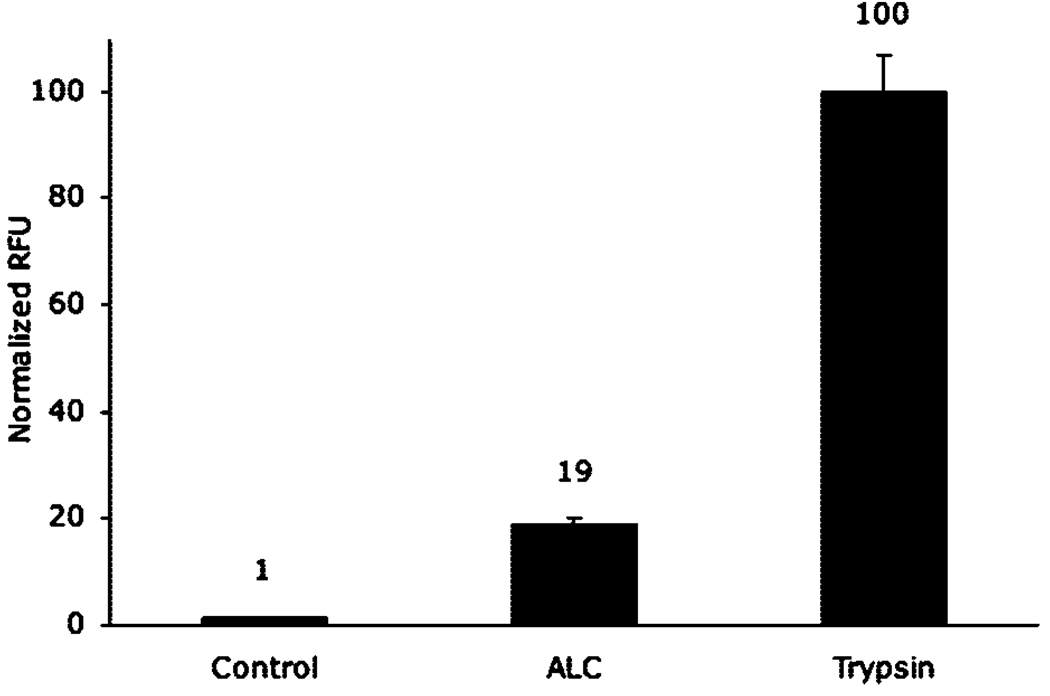
With the use of an optimal temperature of 30 °C and shortened assay time of 2.5 h, surfaces were exposed to 1 µM ALC or 1 µM trypsin. Trypsin is a relatively promiscuous protease as compared to BoNT, cleaving after multiple arginine residues within the flu-SNAP sequence with little regard for conformation. Using trypsin as the benchmark for 100% cleavage, we determined that ALC cleaves ~19% of the peptide substrate within the same time period (Figure 6). This is a greater cleavage percentage than expected from HPLC, which indicated only 11% after 180 min in solution, confirming our assumption based on data provided in Figure 2 and Figure 3 that tethering flu-SNAP to the surface increases its ability to be recognized and cleaved by the toxin.
Figure 6.
Comparison of the extent of ALC and trypsin (each 1 µM) enzyme activity after 2.5 h incubation on flu-SNAP SAMs. The trypsin signal was normalized to represent 100% cleavage. Accordingly, ALC was able to cleave 19% of the substrate, a significant increase from 11% in solution, as shown by HPLC. All sample groups, n = 6.
Sensor Performance with BoNT/A
Light Chain
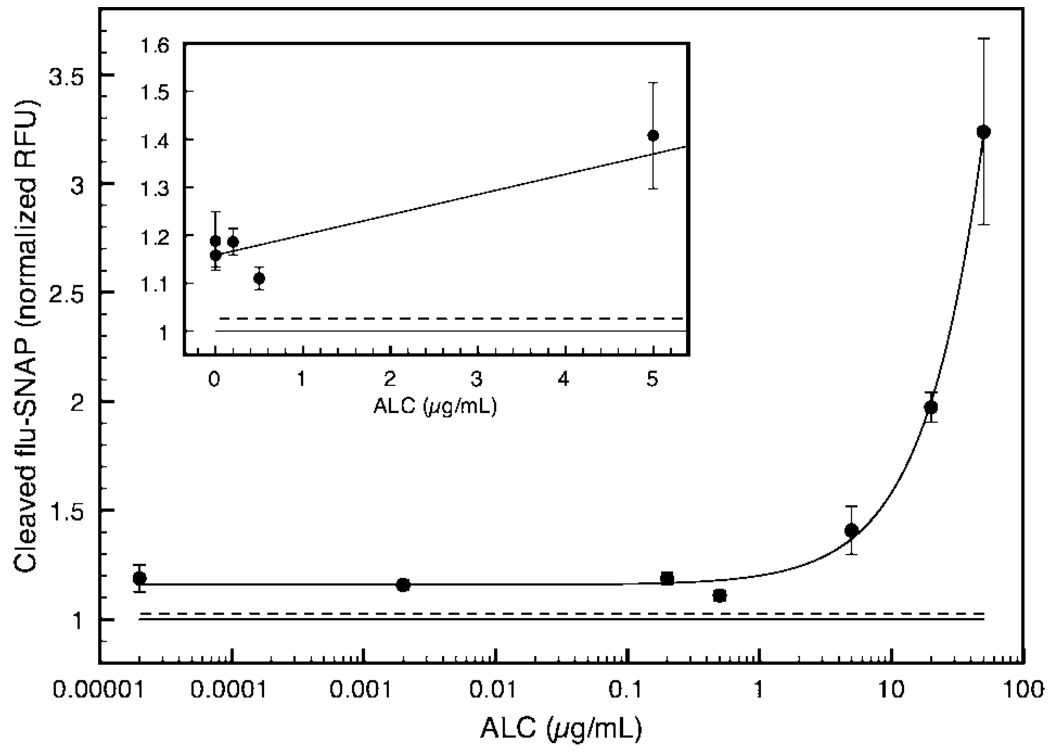
As a measure of assay viability and approximate detection limit, flu-SNAP SAMs were exposed to varying concentrations of the BoNT/A light chain (20 pg/mL−20 µg/mL), which cover 6 orders of magnitude and straddle the suggested LOD of 30 pg/mL for a BoNT sensor. Mean fluorescence intensity, which can be correlated to the extent of ALC cleavage of immobilized flu-SNAP, is plotted ±SE in Figure 7. Data were fit to a nonlinear equation (A[E]/(B + [E]) + C) that represents a combination of Michaelis-Menten kinetics and Langmuir adsorption principles for an enzyme-substrate reaction at the surface.42 The fit was used to display any trends in sensor output relative to toxin concentration, [E]. This curve is predicted for enzymatic surface reactions, as explained in detail by Lee and co-workers, wherein the enzyme reaction rate at the surface is based on the enzyme concentration in bulk solution rather than the concentration of the immobilized substrate.43
Figure 7.
Sensor output at varying ALC concentrations was quantified using fluorescence microscopy at the microchannel detection port. Normalized averages ±SE were plotted and fit to a nonlinear equation representing combined kinetic and surface adsorption concepts. The solid line under the curve represents the control (+1SE, dotted line). The sensor was able to detect down to 20 pg ALC per milliliter of buffered solution (all points, P < 0.05). Inset: 20 pg/mL−5 µg/mL, linear scale.
All ALC data points (ntotal = 32) were significant (P < 0.05). An averaged control signal (n = 15) is plotted as a solid line under the curve (+1SE, dotted line) in Figure 7. The SAM-based microfluidic sensor was capable of detecting ALC down to 20 pg/mL, averaging 5.2% error over several experiments. Since all values are significant with respect to the buffer control (Figure 7 inset), it may be possible to sense even lower concentrations of ALC (<picograms per milliliter) upon further optimization. In addition, being able to detect the catalytically active BoNT/A light chain provides a distinct advantage over most immuno-based assays that cannot distinguish active from inactive BoNT.
Holotoxin
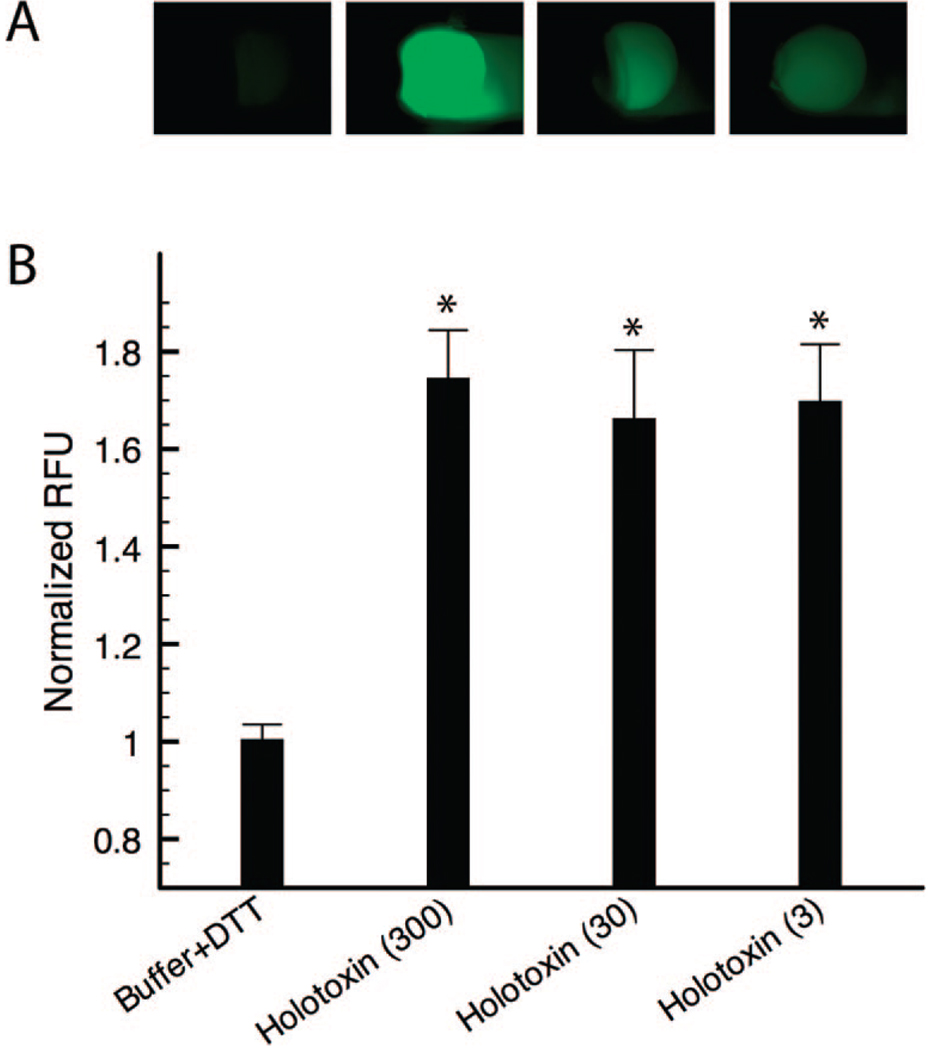
The microfluidic sensor was tested for live BoNT/A holotoxin recognition and cleavage of the flu-SNAP SAMs. With the primary interest being the sensor’s relative detection limit, SAMs were incubated with 3–300 pg/mL BoNT/A: the recommended LOD ± one order of magnitude. Resulting fluorescent images are represented in Figure 8A and the corresponding data plotted in Figure 8B as the mean ± SE. Figure 8A provides a visual representation of channel output for a negative control (HEPES/ BSA with 1.3 mM DTT), a positive control (1 µM trypsin), and two BoNT/A holotoxin samples (300 and 3 pg/mL). After evaporative concentration, the toxin and trypsin signals are easily discernible from both background and control. Analyte diffusion out of the detection port is noticeable and could be lessened by further constricting the channel. Nonetheless, the extent of evaporative amplification was sufficient for detection using the traditional microchannel design, as quantified in Figure 8B. Fluorescence intensities of all three concentrations (n300pg/mL = 15; n30pg/mL = 16; n3pg/mL = 13) were at least 1.6-fold greater than the control (n = 11) with 7.2% error, averaged over repeated experiments. All signals were significant relative to the control (*P < 0.001) indicating the ability of the sensor to detect down to 3 pg/mL holotoxin-10 times below the desired LOD.
Figure 8.
BoNT/A holotoxin cleavage of flu-SNAP was visualized using fluorescence microscopy (A) and the output quantified (B). Representative fluorescent images from the microchannel detection port are shown in part A, from left to right: HEPES/BSA buffer with 1.3 mM DTT (negative control), 1 µM trypsin (positive control), 300 pg/mL BoNT/A, and 3 pg/mL BoNT/A. (B) Normalized average intensities (±SE) for 3–300 pg/mL holotoxin (ntotal = 44) as compared to the control (n = 11) reveal fluorescent signals down to 3 pg/mL BoNT/A (*P < 0.001).
It is important that the SAM-based sensor retains functionality in the presence of complex matrixes such as liquid food or drink. Foodborne botulism in the western United States resulting from the type A bacterium is often caused by ingesting contaminated fruits or vegetables, most likely home-canned.1,44 We therefore evaluated sensor capabilities by spiking BoNT/A holotoxin (500 ng/mL) into canned vegetable soup. The light chain was also tested in soup at concentrations of 2 and 20 µg/mL. Contaminated soup samples were incubated on flu-SNAP SAMs within silicone microwells. A standardized FRET assay (SNAPtide) was run concurrently to verify toxin viability in soup.
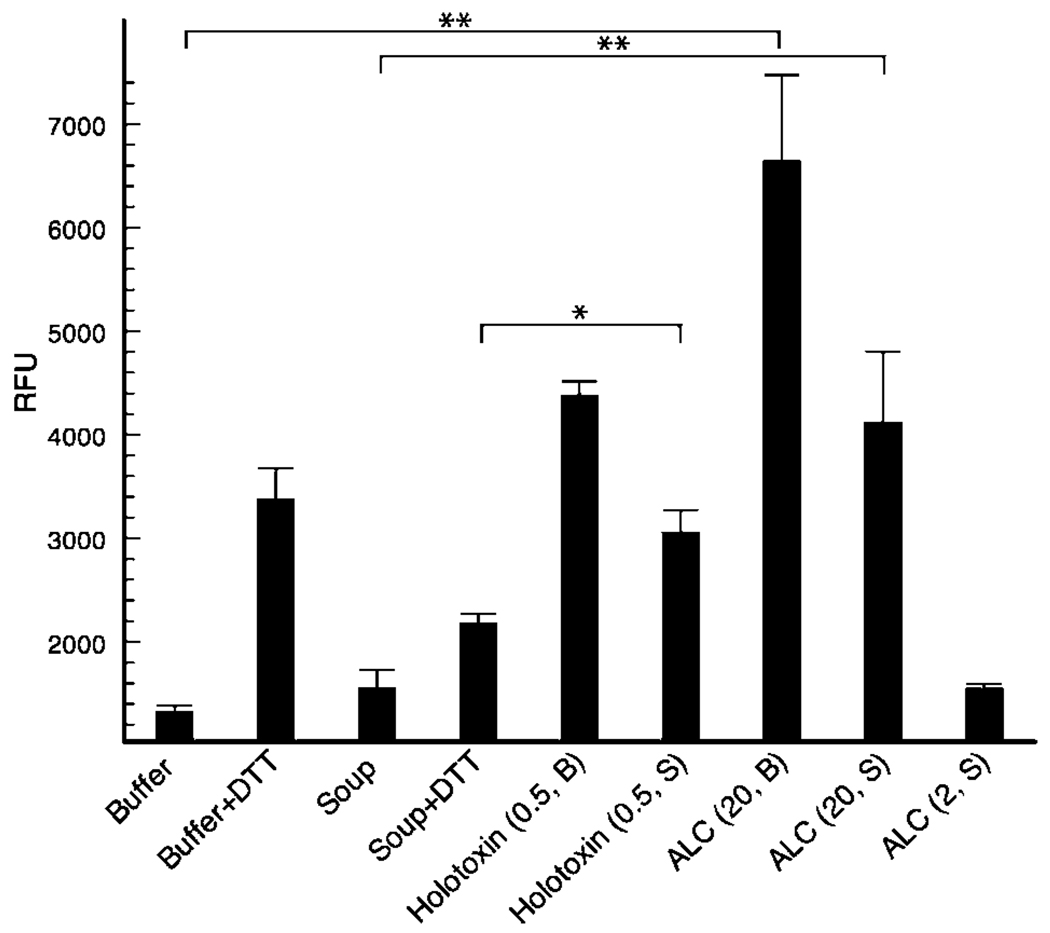
Preliminary fluorescence data provided in Figure 9 demonstrate the ability of the sensor to detect the holotoxin in soup (S) (*P < 0.02), with output similar to the toxin in buffer (B) (P = 0.38). ALC (20 µg/mL) showed a slightly diminished signal in soup as compared to its equivalent in buffer but nonetheless displayed an intensity nearly 3-fold greater than the control (**P < 0.001). A lower concentration of ALC (2 µg/mL) did not produce a signal distinguishable from the control with our assay but was detectable using the SNAPtide (Figure 2 in the Supporting Information), indicating a loss of SAM-based assay sensitivity when detecting the light chain in more complex media.
Figure 9.
BoNT/A holotoxin (500 ng/mL) and its catalytic light chain (ALC, 20 µg/mL) are detected in vegetable soup after a 3 h incubation with flu-SNAP SAMs (*P < 0.02; **P < 0.001); each sample, n = 3. Toxin concentration (in micrograms per milliliter) and sample matrix (soup, S, or buffer, B) are indicated in parentheses.
Assay sensitivity was not compromised with the live BoNT/A holotoxin in soup; in fact, fluorescence output was heightened for the toxin in soup using both the SAM and FRET methods of detection. This is most likely due to additional stabilizing proteins within the vegetable soup, thus corroborating reports that the toxin is more stable in food than aqueous solutions. Additionally, DTT appeared to have less of a negative impact on the SAM Au-S bond (1.4-fold increase in fluorescent output for soup + DTT as compared to soup without DTT; 2.6-fold increase for buffer + DTT versus buffer without DTT) (Figure 9), which may be attributed to reduced DTT activity at a more acidic soup pH.
In order to increase sensitivity for both the holotoxin and ALC in complex media, we are currently exploring the use of near-infrared dyes conjugated to the SNAP peptide substrate, which should allow for detection at wavelengths where protein auto-fluorescence is diminished. Toward a truly portable, on-site sensor for BoNT type A and other enzyme toxins, we will be incorporating other known peptide substrates onto the surface. As each BoNT serotype possesses discrete substrate requirements, the creation of a multiplexed sensor capable of detecting numerous serotypes in parallel is a logical extension of our versatile SAM-based microfluidic platform.
CONCLUSION
A sensing system that interfaces self-assembled peptide mono-layers with PDMS microchannels was optimized and used to detect botulinum neurotoxin type A (BoNT/A) enzyme activity without the need for sample transfer or complicated external components characteristic of many microfluidic platforms. On the basis of fluorescence intensities resulting from toxin cleavage of the surface substrate, we found that the sensor could detect BoNT/A holotoxin down to 3 pg/mL (20 fM) in buffer with preliminary results showing the ability to detect 3 nM holotoxin in food. The sensor was also able to detect the BoNT/A catalytic light chain (ALC) down to 20 pg/mL. Because of its versatile, modular design, this microfluidic SAM platform could be formatted for detecting other enzyme toxins such as the remaining BoNT serotypes (B–G), tetanus toxin, or anthrax, thus having implications for a multiplexed, on-site toxin sensor.
Supplementary Material
ACKNOWLEDGMENT
The authors thank the MMB and Johnson laboratories for insightful discussions. M.L.F. thanks Dr. Gary Case at the UW Peptide Synthesis Facility and Matt Lockett (UW Chemistry) for chemistry guidance. This publication was developed under DHS Science and Technology Assistance Agreement No. 2007-ST-061- 000003 awarded by the U.S. Department of Homeland Security. It has not been formally reviewed by DHS. The views and conclusions contained in this document are those of the authors and should not be interpreted as necessarily representing the official policies, either expressed or implied, of the U.S. Department of Homeland Security. The Department of Homeland Security does not endorse any products or commercial services mentioned in this publication.
Footnotes
SUPPORTING INFORMATION AVAILABLE
Recombinant partial SNAP-25 synthesis, SNAPtide assay method and results, microchannel dimensions, and data processing. This material is available free of charge via the Internet at http://pubs.acs.org.
References
- 1.Arnon S, et al. J. Am. Med. Assoc. 2001;285:1059–1070. [Google Scholar]
- 2.Ferreira J, Maslanka S, Johnson E, Goodnough M. J. AOAC Int. 2003;86:314–331. [PubMed] [Google Scholar]
- 3.Moorthy J, Mensing G, Kim D, Mohanty S, Eddington D, Tepp W, Johnson E, Beebe D. Electrophoresis. 2004;25:1705–1713. doi: 10.1002/elps.200405888. [DOI] [PubMed] [Google Scholar]
- 4.Sharma S, Ferreira J, Eblen B, Whiting R. Appl. Environ. Microbiol. 2006;72:1231–1238. doi: 10.1128/AEM.72.2.1231-1238.2006. [DOI] [PMC free article] [PubMed] [Google Scholar]
- 5.Lindstrom M, Keto R, Markkula A, Nevas M, Hielm S, Korkeala H. Appl. Environ. Microbiol. 2001;67:5694–5699. doi: 10.1128/AEM.67.12.5694-5699.2001. [DOI] [PMC free article] [PubMed] [Google Scholar]
- 6.Chao H-Y, Wang Y-C, Tang S-S, Liu H-W. Toxicon. 2004;43:27–34. doi: 10.1016/j.toxicon.2003.10.013. [DOI] [PubMed] [Google Scholar]
- 7.Boyer A, Moura H, Woolfitt A, Kalb S, McWilliams L, Pavlopoulos A, Schmidt J, Ashley D, Barr J. Anal. Chem. 2005;77:3916–3924. doi: 10.1021/ac050485f. [DOI] [PubMed] [Google Scholar]
- 8.Hallis B, James B, Shone C. J. Clin. Microbiol. 1996;34:1934–1938. doi: 10.1128/jcm.34.8.1934-1938.1996. [DOI] [PMC free article] [PubMed] [Google Scholar]
- 9.Schmidt J, Stafford R, Millard C. Anal. Biochem. 2001;296:130–137. doi: 10.1006/abio.2001.5236. [DOI] [PubMed] [Google Scholar]
- 10.Liu W, Montana V, Chapman E, Mohideen U, Parpura V. Proc. Natl. Acad. Sci. U.S.A. 2003;100:13621–13625. doi: 10.1073/pnas.2233819100. [DOI] [PMC free article] [PubMed] [Google Scholar]
- 11.Scarlatos A, Welt B, Cooper B, Archer D, DeMarse T, Chau K. J. Food Sci. 2005;70:R121–R130. [Google Scholar]
- 12.Frisk M, Tepp W, Lin G, Johnson E, Beebe D. Chem. Mater. 2007;19:5842–5844. [Google Scholar]
- 13.Purcell A, Hoard-Fruchey H. Anal. Biochem. 2007;366:207–217. doi: 10.1016/j.ab.2007.04.048. [DOI] [PubMed] [Google Scholar]
- 14.Bagramyan K, Barash J, Arnon S, Kalkum M. PLoS ONE. 2008;3:1–9. doi: 10.1371/journal.pone.0002041. [DOI] [PMC free article] [PubMed] [Google Scholar]
- 15.Frisk M, Tepp W, Johnson E, Beebe D. Lab Chip. 2008;8:1793–1800. doi: 10.1039/b811075a. [DOI] [PubMed] [Google Scholar]
- 16.Jones R, Ochiai M, Liu Y, Ekong T, Sesardic D. J. Immunol. Methods. 2008;329:92–101. doi: 10.1016/j.jim.2007.09.014. [DOI] [PubMed] [Google Scholar]
- 17.DHS. BAA08-05: Immunological Assays (ELISA) for the Detection of Ricin, Abrin, and Botulinum Toxins (IADRABT) 2008 [Google Scholar]
- 18.Houseman B, Gawalt E, Mrksich M. Langmuir. 2003;19:1522–1531. [Google Scholar]
- 19.Prime K, Whitesides G. Science. 1991;252:1164–1167. doi: 10.1126/science.252.5009.1164. [DOI] [PubMed] [Google Scholar]
- 20.Mrksich M, Grunwell J, Whitesides G. J. Am. Chem. Soc. 1995;117:12009–12010. [Google Scholar]
- 21.Derda R, Wherritt D, Kiessling L. Langmuir. 2007;23:11164–11167. doi: 10.1021/la701386v. [DOI] [PMC free article] [PubMed] [Google Scholar]
- 22.Kim J-H, Roy S, Kellis J, Poulose A, Gast A, Roberston C. Langmuir. 2002;18:6312–6318. [Google Scholar]
- 23.Min D-H, Su J, Mrksich M. Angew. Chem., Int. Ed. 2004;43:5973–5977. doi: 10.1002/anie.200461061. [DOI] [PubMed] [Google Scholar]
- 24.Kitano H, Makino Y, Kawasaki H, Sumi Y. Anal. Chem. 2005;77:1588–1595. doi: 10.1021/ac0488558. [DOI] [PubMed] [Google Scholar]
- 25.Sekine K, Revzin A, Tompkins R, Toner M. J. Immunol. Methods. 2006;313:96–109. doi: 10.1016/j.jim.2006.03.017. [DOI] [PubMed] [Google Scholar]
- 26.Rowe-Taitt C, Golden J, Feldstein M, Cras J, Hoffman K, Ligler F. Biosens. Bioelectron. 2000;14:785–794. doi: 10.1016/s0956-5663(99)00052-4. [DOI] [PubMed] [Google Scholar]
- 27.Kulagina N, Anderson G, Ligler F, Shaffer K, Taitt C. Sensors. 2007;7:2808–2824. doi: 10.3390/s7112808. [DOI] [PMC free article] [PubMed] [Google Scholar]
- 28.Mangru S, Bentz B, Davis T, Desai N, Stabile P, Schmidt J, Millard C, Bavari S, Kodukula K. J. Biomol. Screen. 2005;10:788–794. doi: 10.1177/1087057105278927. [DOI] [PubMed] [Google Scholar]
- 29.Dittrich P. Lab Chip. 2008;8:1601–1603. doi: 10.1039/b811448j. [DOI] [PubMed] [Google Scholar]
- 30.Duffy D, McDonald J, Schueller O, Whitesides G. Anal. Chem. 1998;70:4974–4984. doi: 10.1021/ac980656z. [DOI] [PubMed] [Google Scholar]
- 31.Walker G, Beebe D. Lab Chip. 2002;2:57–61. doi: 10.1039/b202473j. [DOI] [PubMed] [Google Scholar]
- 32.Song H, Ismagilov R. J. Am. Chem. Soc. 2003;125:14613–14619. doi: 10.1021/ja0354566. [DOI] [PMC free article] [PubMed] [Google Scholar]
- 33.Lee L, Yang S-T, Lai S, Bai Y, Huang W-C, Juang Y-J. Adv. Clin. Chem. 2006;42:255–295. [PubMed] [Google Scholar]
- 34.Schmidt J, Bostian K. J. Protein Chem. 1995;14:703–708. doi: 10.1007/BF01886909. [DOI] [PubMed] [Google Scholar]
- 35.Schmidt J, Bostian K. J. Protein Chem. 1997;16:19–26. doi: 10.1023/a:1026386710428. [DOI] [PubMed] [Google Scholar]
- 36.Sukonpan C, Oost T, Goodnough M, Tepp W, Johnson E, Rich D. J. Pept. Res. 2004;63:181–193. doi: 10.1111/j.1399-3011.2004.00124.x. [DOI] [PubMed] [Google Scholar]
- 37.Johnson C, Jensen I, Prakasam A, Vijayendran R, Leckband D. Bioconjugate Chem. 2003;14:974–978. doi: 10.1021/bc034063t. [DOI] [PubMed] [Google Scholar]
- 38.Min D-H, Yeo W-S, Mrksich M. Anal. Chem. 2004;76:3923–3929. doi: 10.1021/ac049816z. [DOI] [PubMed] [Google Scholar]
- 39.Lu M, Hall J, Shortreed M, Wang L, Berggren W, Stevens P, Kelso D, Lyamichev V, Neri B, Skinner J, Smith L. J. Am. Chem. Soc. 2002;124:7924–7931. doi: 10.1021/ja012082c. [DOI] [PubMed] [Google Scholar]
- 40.Viger M, Live L, Therrien O, Boudreau D. Plasmonics. 2008;3:33–40. [Google Scholar]
- 41.Wang X, Lieberman M. Langmuir. 2003;19:7346–7353. [Google Scholar]
- 42.Lee H, Wark A, Corn R. Langmuir. 2006;22:5241–5250. doi: 10.1021/la060223o. [DOI] [PMC free article] [PubMed] [Google Scholar]
- 43.Lee H, Wark A, Goodrich T, Fang S, Corn R. Langmuir. 2005;21:4050–4057. doi: 10.1021/la046822h. [DOI] [PubMed] [Google Scholar]
- 44.Popoff M. Ecology of Neurotoxigenic Strains of Clostridia. In: Montecucco C, editor. Clostridial Neurotoxins. 1st ed. New York: Springer; 1995. p. 21. [Google Scholar]
Associated Data
This section collects any data citations, data availability statements, or supplementary materials included in this article.


