Abstract
A facile and versatile method for the large-scale synthesis of sensitive mesoporous ZnO–SnO2 (m-Z–S) nanofibers through a combination of surfactant-directed assembly and an electrospinning approach is reported. The morphology and the structure were investigated by scanning electron microscopy (SEM), transmission electron microscopy (TEM), x-ray diffraction (XRD), and nitrogen adsorption–desorption isotherm analysis. The results showed that the diameters of fibers ranged from 100 to 150 nm with mixed structures of wurtzite (ZnO) and rutile (SnO2), and a mesoporous structure was observed in the m-Z–S nanofibers. The sensor performance of the prepared m-Z–S nanofibers was measured for ethanol. It is found that the mesoporous fiber film obtained exhibited excellent ethanol sensing properties, such as high sensitivity, quick response and recovery, good reproducibility, and linearity in the range 3–500 ppm.
1. Introduction
Ethanol vapor is one of the most exhaustively studied gases in the field of gas sensors due to the great demand in biomedical, chemical, and food industries, especially in wine-quality monitoring and traffic safety [1]. Because of an increasing demand for fast, continuous, and trace detection, current research in gas sensor techniques has been focused on the development of sensors which can provide low-cost, rapid sensory, and high sensing information. A general route to improve a sensor's characteristics is to make the chemical sensors at the nanoscale, taking advantage of the large surface areas of nanoscale structures [2–8]. One-dimensional (1D) nanomaterials have been demonstrated to be excellent candidates for ultrasensitive and highly miniaturized sensors because of their high surface to volume ratios and special physical and chemical properties [9]. So far, a number of successful techniques have been developed to fabricate 1D nanostructures, such as template-directed, vapor–liquid–solid (VLS), solution–liquid–solid, solvothermal, self-assembly, and electrospinning methods. Of these techniques, electrospinning is a straightforward, versatile, and effective method for producing 1D continuous polymer, inorganic, and polymer/inorganic hybrid nanofibers [10].
ZnO and SnO2, as well-known wide direct band-gap (Eg = 3.37 and 3.6 eV at 300 K, respectively) semiconductors, have attracted much attention because of their special electrochromic and photochromic properties, which can be applied in optical devices [11, 12], piezoelectric devices [13], transparent electrodes [14], gas sensors [15, 16], and photocatalysts [17]. However, little attention has been given to the synthesis of mesoporous ZnO–SnO2 (m-Z–S) nanofibers and exploration of their sensing properties. Kim et al reported a SnO2–ZnO composite sensor made by alternate deposition of 10 droplets of SnO2 and ZnO sols (S50Z50 sensor), showing a good response (4.69) to 200 ppm ethanol and an excellent selectivity [18]. We also investigated the sensing property of ZnO–SnO2 thin film for ethanol in previous studies, but its sensitivity remains to be improved further. In this paper, we report a large-scale preparation of m-Z–S nanofibers with desirable sensing property for ethanol gas via simple electrospinning. Poly(vinylpyrrolidone) (PVP) was selected for the fiber template, and H(C2H5O)20(C3H7O)70(C2H5O)20OH (pluronic P123) was used as the surfactant-directed agent. Both the mesoporous structure and the ZnO–SnO2 heterojunction made the surface-depletion effect more pronounced for gas sensing. The prepared ethanol sensor exhibited excellent sensing characteristics at 300 °C, including high sensitivity, fast response (3 s) and recovery time (8 s), good reproducibility, and linearity.
2. Experimental details
2.1. Preparation of mesoporous ZnO–SnO2 nanofibers
The electrospinning process in the present experiment is similar to those described previously for SnO2 nanofiber synthesis [10]. In a typical procedure, 0.18 g of SnCl2·2H2O and 0.4 g of P-123 were added in a mixed solvent of N, N-dimethylformamide/ethanol in a glove box under vigorous stirring for 6 h. Subsequently, 0.22 g of ZnCl2 and 0.8 g of PVP were in turn added into the above solution under vigorous stirring for 6 h. Then, the mixture was loaded into a glass syringe and electrospun by applying 10 kV at an electrode distance of 20 cm. The fibers were collected on an aluminum frame, transferred to a standard microscopic thin mica slide, and subjected to pyrolysis at 600 °C for 4 h in the air. To elucidate the role of the mesoporous structure, ZnO-SnO2 (Z–S) nanofibers of identical composition without the surfactant were also prepared.
2.2. Characterization
The fibers were characterized by scanning electron microscopy (SEM; SSX-550, Shimadzu), x-ray diffraction (XRD; Scintag XDS 2000 diffractometer with a Cu Kα radiation), transmission electron microscopy (TEM; Hitachi S-570) and nitrogen adsorption–desorption isotherm analysis (Micromeritics ASAP2000 apparatus at 77 K).
2.3. Measurement of ethanol sensing properties
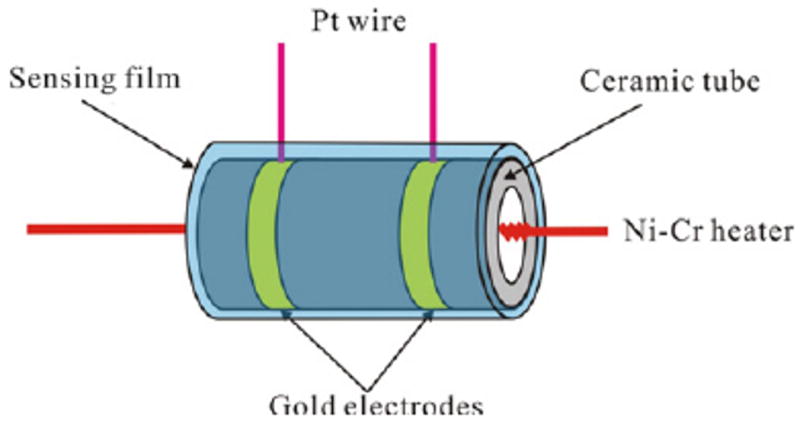
A schematic picture of the sensor fabricated from the m-Z–S nanofibers is shown in figure 1. Two Au electrodes were printed on the surface of the ceramic tube and a Ni–Cr heater was inserted into the tube. The gas sensitivity (S) was defined as Ra/Rg, where Ra and Rg are the resistance of the sensor in the air and in the ethanol–air mixed gas, respectively.
Figure 1.

Schematic illustration of the fabricated device for ethanol sensing measurement.
3. Results and discussion
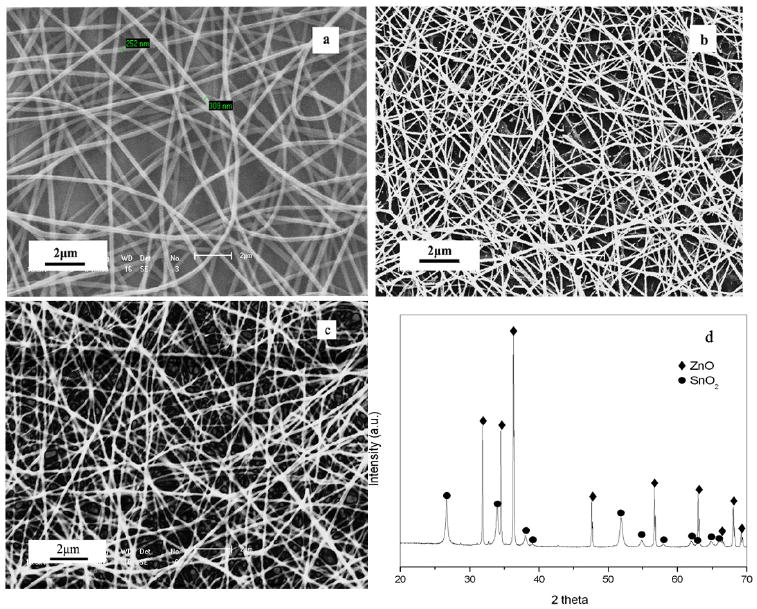
As shown in figures 2(a) and (b), heating resulted in m-Z–S nanofibers with diameter sizes of 100–150 nm, which is significantly less than the average diameters of as-spun fibers due to the degradation of PVP and P123. Figure 2(c) shows the SEM image of the Z–S nanofibers. The x-ray diffraction pattern of the synthesized m-Z–S composite nanofibers is presented in figure 2(d). All diffraction peaks can be perfectly indexed as the tetragonal rutile structure for SnO2 (JCPDS 41-1445) and a hexagonal wurtzite structure (JCPDS 36-1451) for ZnO, suggesting high crystallinity of the nanofibers after calcining at 600 °C for 4 h. No characteristic peaks for impurity, such as SnO, ZnSnO3, and Zn2SnO4, were observed.
Figure 2.

SEM images of (a) m-Z–S precursor fibers, (b) m-Z–S nanofibers, (c) Z–S nanofibers, and (d) the XRD pattern of the m-Z–S nanofibers.
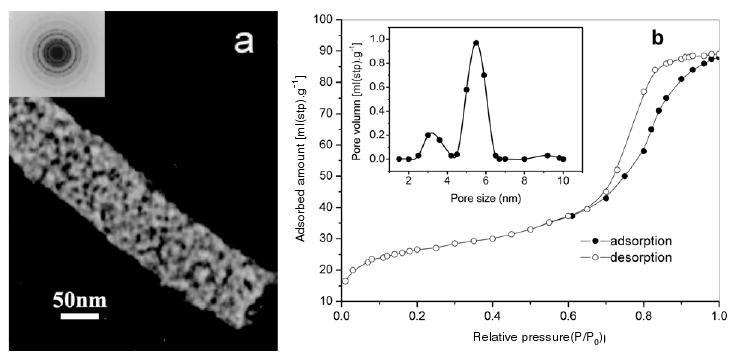
Transmission electron micrographs and nitrogen adsorption studies resulted in further insight into the detailed structure of the m-Z–S nanofibers. As shown in figure 3(a), these nanofibers exhibited a highly mesoporous structure, and some disordered wormhole-like pores could be found based on the composite nanofibers, implying that some porous structures have been destroyed during the calcination due to the collapse of meso-structured wall and the aggregation of nanofibers. The selected area electron diffraction (SAED) pattern in the inset in figure 3(a) shows that the composite nanofibers had a polycrystalline structure attributable to various diffraction planes of ZnO and SnO2. The surface structural characteristics of the composite nanofibers were also analyzed by nitrogen adsorption and desorption isotherm techniques, as shown in figure 3(b). The inset in figure 3(b) reveals the corresponding pore size distributions. According to the IUPAC nomenclature, it exhibited a type IV isotherm with type H1 hysteresis for the relative pressure P/P0 in the range 0.6–1, which is a characteristic of different processes between adsorption into and desorption from the mesopores [19]. The pore size distribution (PSD) curve was derived by the Barret–Joyner–Halenda (BJH) method, and revealed a relative narrow pore size distribution centered at about 5.6 nm in the composite nanofibers. In addition, a Brunauer–Emmett–Teller (BET) analysis showed that the surface areas of the m-Z–S nanofibers and Z–S nanofibers were 156 m2 g−1 and 40 m2 g−1, respectively.
Figure 3.

(a) TEM images and (b) nitrogen adsorption–desorption isotherms of m-Z–S nanofibers.
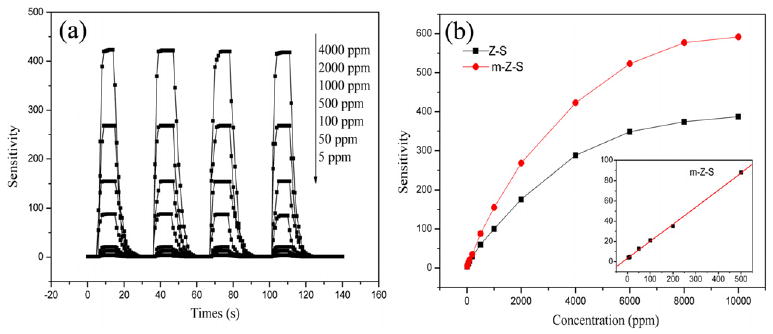
As shown in figure 4(a), the m-Z–S nanofibers showed both excellent sensitivity and good reproducibility when exposed to various ethanol concentrations at 300 °C. The responses of m-Z–S nanofibers film were 4, 12.8, 21, 88, 155, 268, and 423 to 5 ppm, 50 ppm, 100 ppm, 500 ppm, 1000 ppm, 2000 ppm, and 4000 ppm of ethanol gas, respectively. The response time was only 3 s and the recovery time was only 8 s. In addition, such an on-and-off response could be repeated more than 10 times without a major change in the signal. These results are much better than those of metal oxide-based sensors reported previously [20, 21].
Figure 4.

(a) Four cycles of response–recovery characteristics of m-Z–S nanofibers exposed to different ethanol concentrations, and (b) sensitivity versus ethanol concentration in the range 5–10 000 ppm.
The responses of two samples versus ethanol concentrations at 300 °C are given in figure 4(b). The sensitivity increased with the increase of ethanol concentration, and when the ethanol concentration was 10 000 ppm, it reached saturation. However, the response of the Z–S nanofibers was lower compared with that of m-Z–S nanofibers. The relationship between the sensitivity and ethanol concentration follows the formula S = APβ, where P is the ethanol concentration, and A and β are constants for certain materials [22]. As shown in the inset of figure 4(b), at relatively low ethanol concentration, the sensitivity increased nearly linearly with the ethanol concentration in the range 5–500 ppm, and β was found to be 1.
The sensor property of metal oxides was clarified in previous works [23, 24]. The most widely accepted model is based on the modulation of the depletion layer by oxygen absorption. Oxygen species in the air are adsorbed on the exposed surface of the metal oxide conduction band and ionize to O− or O2− by capturing free electrons from the particles. As a consequence, depletion layers are formed on the surface area of the metal oxides, resulting in a decrease of the carrier concentration and electron mobility. When the sensor is exposed to a reducing gas such as ethanol, the reducing gas reacts with the adsorbed oxygen molecules and releases the trapped electrons back to the conduction band, thus increasing the carrier concentration and carrier mobility of the metal oxides. Here the enhancement in gas sensing property on m-Z–S nanofibers could be explained by following reasons. The mesoporous structure, together with the large surface area, easily enables oxygen and ethanol molecules to access all the surfaces of the sensing materials. As shown in figure 5(a), the electrons in the nanofibers are almost completely depleted due to oxygen adsorption in the air. The surface-depletion effect is enhanced and becomes more pronounced on the construction of a mesoporous structure with Z–S composite nanofibers. When the sensor is exposed to ethanol, the oxygen species on the surface of the fibers react with the ethanol, which results in the electrons released from the surface reaction transferring back into the conductance band of the sensors, thus leading to a very high sensitivity (figure 5(b)). At the same time, comparing with the 2D nanoscale films, the nanofibers can facilitate a faster mass transfer of the analyzed molecules to and from the interactive region as well as improve the rate for charged carriers to transverse the barriers induced by molecular recognition along the fibers. In addition, the XRD results as shown in figure 3(a) demonstrated that these fibers were composed of nanocrystalline particles in the size range 8–14 nm in diameter. According to Wu and Wang et al [25, 26], when the grain size in thin film sensors is reduced to a scale comparable to the space–charge length (for SnO2, this value is −6 nm), the sensitivity could be exponentially enhanced, or the sensor could operate in ambient conditions. Thus the small grain size can also be used to make the surface-depletion effect of the m-Z–S nanofibers more pronounced for ethanol sensing.
Figure 5.

Sketch of chemical sensing of mesoporous Z–S nanofibers.
Moreover, the heterojunction structure between SnO2 and ZnO plays an important role in improving the sensing properties. It is well known that a second component in a metal–oxide–semiconductor sensor can be used both as active positions for redox processes and to promote free charge carriers that increase the electronic conductance of the oxide films [27, 28]. The sensor also has a good stability towards ethanol vapor for more than 30 days under the work temperature of 300 °C (data not shown).
4. Conclusions
In conclusion, we have successfully prepared mesoporous Z–S composite nanofibers with diameters of 100–150 nm via electrospinning. With the sensitization of uniformly distributed mesopores and heterostructure of ZnO and SnO2, the fabricated sensor showed excellent ethanol sensing properties such as high sensitivity, quick response, reproducibility, and linear dependence of the sensitivity on the ethanol concentration. The possibility of large-scale synthesis and excellent sensing property demonstrate that the mesoporous ZnO–SnO2 nanofibers are very promising materials for fabricating ethanol sensors.
Acknowledgments
The authors would like to thank the editor and the anonymous reviewers for their valuable comments on this manuscript. This work was supported by National 973 Project of China (No. 2007CD936203) and National 863 Project of China (No. 2007AA03Z324). Studies by LL were supported by the National Institute of Health (NIH) MBRS SCORE Program (Grant #2 S06 GM 063119).
References
- 1.Tang H, Li Y, Zheng C, Ye J, Hou X, LV Y. Talanta. 2007;72:1593–7. doi: 10.1016/j.talanta.2007.01.035. [DOI] [PubMed] [Google Scholar]
- 2.Franke ME, Koplin TJ, Simon U. Small. 2006;2:36–50. doi: 10.1002/smll.200500261. [DOI] [PubMed] [Google Scholar]
- 3.Shimizu Y, Hyodo T, Egashira M. Catal Surv Asia. 2004;8:127–35. [Google Scholar]
- 4.Liu SQ, Chen AC. Langmuir. 2005;21:8409–13. doi: 10.1021/la050875x. [DOI] [PubMed] [Google Scholar]
- 5.Kwon TH, Ryu JY, Choi WC, Kim SW, Park SH, Choi HH, Lee MK. Sens Mater. 1999;11:257–67. [Google Scholar]
- 6.Comini E. Anal Chim Acta. 2006;568:28–40. doi: 10.1016/j.aca.2005.10.069. [DOI] [PubMed] [Google Scholar]
- 7.Eranna G, Joshi BC, Runthala DP, Gupta RP. Crit Rev Solid State Mater Sci. 2004;29:111–88. [Google Scholar]
- 8.Xue XY, Chen YJ, Wang YG, Wang TH. Appl Phys Lett. 2005;86:233101. [Google Scholar]
- 9.Kolmakov A, Moskovits M. Annu Rev Mater Res. 2004;34:151. [Google Scholar]
- 10.Dharmaraj N, Kim CH, Kim KW, Kim HY, Suh EK. Spectrochim Acta A. 2006;64:136. doi: 10.1016/j.saa.2005.07.007. [DOI] [PubMed] [Google Scholar]
- 11.Kuang Q, Jiang ZH, Xie ZX, Lin SC, Lin ZW, Xie SY, Huang RB, Zheng LS. J Am Chem Soc. 2005;127:11777. doi: 10.1021/ja052259t. [DOI] [PubMed] [Google Scholar]
- 12.Yang P, Yan H, Mao S, Johnson J, Saykally R, Morris N, Pham J, He R, Choi HJ. Adv Mater. 2002;12:323. [Google Scholar]
- 13.Ambia MG, Islam MN, Hakim MO. J Mater Sci. 1992;27:5169. [Google Scholar]
- 14.Major S, Kumar S, Bhatnagar M, Chopra KL. Appl Phys Lett. 1986;49:394. [Google Scholar]
- 15.Zhang Y, Kolmakov A, Chretien S, Metiu H, Moskovits M. Nano Lett. 2004;4:403–7. [Google Scholar]
- 16.Fan Z, Wang D, Chang P, Tseng WY, Lu J. Appl Phys Lett. 2004;85:5923. [Google Scholar]
- 17.Wang W, Zhu Y, Yang L. Adv Mater. 2007;17:59–64. [Google Scholar]
- 18.Kim K, Cho P, Kim S, Lee J, Kang C, Kim J, Yoon S. Sensors Actuators B. 2007;123:318. [Google Scholar]
- 19.Sing KSW, Everett DH, Haul RAW, Moscow L, Pierotti RA, Rouquerol T, Siemienewska T. Pure Appl Chem. 1985;57:603. [Google Scholar]
- 20.Dong Q, Su H, Zhang D, Zhang F. Nanotechnology. 2006;17:3968. [Google Scholar]
- 21.Vaezi MR. Mater Chem Phys. 2008;110:89. [Google Scholar]
- 22.Li LM, Li CC, Zhang J, Du ZF, Zou BS, Yu HC, Wang YG, Wang TH. Nanotechnology. 2007;18:225504. [Google Scholar]
- 23.Hafaiedh I, Helali S, Cherif K, Abdelghani A, Tournier G. Mater Sci Eng C. 2008;28:584–7. [Google Scholar]
- 24.Wolkenstein T. Electronic Processes on Semiconductor Surfaces During Chemisorption. New York: Consultants Bureau; 1991. pp. 35–182. [Google Scholar]
- 25.Wu N, Wang S, Rusakova I. Science. 1999;285:1375. doi: 10.1126/science.285.5432.1375. [DOI] [PubMed] [Google Scholar]
- 26.Wang Y, Jiang X, Xia Y. J Am Chem Soc. 2003;125:16176. doi: 10.1021/ja037743f. [DOI] [PubMed] [Google Scholar]
- 27.Xu C, Tamaki J, Miura N, Yamazoe N. J Electrochem Soc Japan. 1990;58:1143. [Google Scholar]
- 28.Ogawa H, Nishikawa M, Abe A. J Appl Phys. 1982;53:4448. [Google Scholar]


