

Abstract
A high-performance liquid chromatographic method that accurately measures glycerol and myo-inositol from plasma and tissue is described. The method incorporates a pre-column derivatization reaction using aqueous extracts with benzoyl chloride as a modifying agent. The benzoylated derivatives are isolated by HPLC using reversed-phase gradient chromatography and quantified via absorbance detection at 231 nm. The benzoylated derivatives of glycerol and myo-inositol are well resolved from` other know carbohydrates, internal standard and other contaminants encountered within samples and during incubation. The benzoylation of these analytes reach a maximum between 3.5 and 6 h of incubation and are stable for at least 24 days at 4° C. The limit of quantization (LOQ) of glycerol was equal to 2.5 nmol/ml plasma and 6.4 nmol/g tissue and the LOQ of myo-inositol was 1.8 nmol/mL plasma and 3.6 nmol/g tissue. Incubation of known standards and samples with benzoyl chloride at 40° C for 4 h showed fully benzoylated products as determined by mass spectral analysis. Calibration curves were linear between 2.7 and 174 nmol for glycerol and 1.4 to 89 nmol for myo-inositol. Comparison of tissue and plasma concentrations of glycerol and myo-inositol found using this method are in good agreement with other reported values using other techniques.
Keywords: glycerol, myo-inositol, carbohydrates, plasma, tissue, high performance chromatography
Introduction
The polyhydroxyl compounds glycerol (1,2,3-propanetriol) and myo-inositol (1,2,3,4,5,6-hexahydroxycyclohexane) are essential metabolic precursors for the synthesis of triacylglycerol and membrane phospholipid [1-4]. The cellular content of these molecules are indicators of lipogenic breakdown [5], metabolic stress [6,7], and can be used to determine cellular glycolytic status [8]. The serum content of glycerol is positively correlated as a marker of cardiovascular disease [9] and post-traumatic membrane breakdown in rats [5]. The plasma and tissue content of glycerol is considered an index of cardiac triacylglycerol [8,9] as well as glycerol-3-phosphate [10] metabolism. Concurrently, phospholipase C-mediated turnover of myo-inositol-containing phospholipid is dependent on cell signaling and is the precursor of the biologically important inositol phosphates [11]. Therefore, being able to rapidly and reproducibly quantify plasma and tissue concentrations of these compounds are important to determine cellular phospholipid and glycolytic metabolism in vivo.
A significant body of knowledge exists regarding the separation and quantification of many polyhydroxyl compounds using thin-layer chromatography [13,14], enzyme-linked assays [15,16], pulsed amperometric detection [17], mass spectral analysis [18,19], and UV detection [20-22]. The most commonly used methods for measuring glycerol and myo-inositol involves enzyme-linked assays based on the reduction of NAD by glycerokinase and glycerophosphate dehydrogenase or myo-inositol dehydrogenase and malate dehydrogenase [15,16], respectively. Although these assays are sensitive, they are often complicated due to interference by detergents, salts, and other compounds found in biological samples [27]. In addition, these methods do not allow for further processing of the sample and can be time consuming because each compound must be assayed individually. Gas-liquid chromatography methods with various modes of detection, such as flame ionization detection [19] and ion trap mass spectrometry [18] are also available. These methods provide reliable and sensitive results but require the use of costly equipment which is often not available. These methods are also destructive to the parent analyte preventing further processing of samples.
When further processing following quantization is desired, it is necessary that the method of detection not be destructive to the parent molecule. For this reason, HPLC methods using in-line detection are optimal. Unfortunately, glycerol and myo-inositol lack chromophoric properties making their isolation and detection difficult [12]. Recently, a method to measure serum non-esterified myo-inositol and glycerol was reported [20]. This method employs a Schotten-Baumann reaction in which glycerol and myo-inositol is modified with benzoyl chloride then quantified using HPLC and UV detection. However, in the presence of strong alkaline solutions required for the Schotten-Baumann reaction, endogenous glycerol and myo-inositol found esterified in serum glycerophospholipid are released and benzoylated along with the endogenous polyhydroxyl compounds. Thus, this method did account for potential phospholipid-derived contamination and is not amendable to the analysis of tissue samples.
To address this problem we have refined this method to accurately measure both glycerol and myo-inositol and have adapted it for use with tissue. As reported herein, this method allows for the reproducible and accurate quantization of both plasma and tissue glycerol and myo-inositol levels which are comparable to established literature values. Further, the procedure is adaptable to most two-phase extraction protocols and provides for the simultaneous determination of total lipid, glycerol, myo-inositol, as well as other polyhydroxyl compounds from a single sample.
Experimental
Chemicals
Benzoyl chloride, carbohydrate standards, myo-inositol, glycerol, phloroglucinol (1, 3, 5-benzenetriol, internal standard), and other chemicals were purchased from Aldrich Chemicals (Milwaukee, WI). Radiolabeled [1, 2-3H] myo-inositol (10-20 Ci/mmol) was purchased from Perkin Elmer (Boston, MA). HPLC-grade acetonitrile and n-hexane and reagent-grade chloroform, methanol, sodium hydroxide, and hydrochloric acid were from EMD Science (Gibbstown, NJ). Analytical grade formic acid was from Sigma (St. Louis, MO) and sodium pentobarbital and sodium heparin was from Baxter Healthcare Corp. (Deerfield, IL).
Animals
This study was conducted in accordance with the National Institutes of Health Guidelines for the Care and Use of Laboratory Animals (NIH Publication No. 80-23) under an animal protocol approved by the University of North Dakota Animal Care and Use Committee. Male Sprague-Dawley rats (Charles River, Indianapolis, IN) were maintained on standard laboratory chow (2018 Teklad Global 18% protein rodent diet, Harlan, Madison, WI) and provided water ad libitum for two weeks prior to inclusion in this study. All rats weighing between 170-195 grams were fasted for 12 h prior to surgery to normalize blood glucose and fatty acid levels [23]. Rats were anesthetized with 3% halothane (Halocarbon, River Edge, NJ) and polyethylene catheters (PE 50, Becton Dickinson, Sparks, MD) filled with sodium heparin (100 IU) were implanted into the right femoral artery and vein. The skin was closed with surgical clips and 1% lidocaine was applied to the wound to lessen pain. The rat was then taped to a wooden block and allowed to recover from anesthesia for 4 h. Arterial blood samples (200 μL) were taken from recovered rats to determine plasma glycerol and myo-inositol levels prior to being euthanized with an intravenous injection of pentobarbital (100 mg/kg). All rats were subjected immediately to head-focused microwave irradiation to stop brain metabolism. The heart, liver, muscle, testis, and kidney samples were removed and flash frozen in liquid nitrogen. The postmortem interval for all non-microwaved samples did not exceed 3 min.
Tissue extraction
Samples from heart, liver, muscle, testis, kidney, and microwaved brain were frozen in liquid nitrogen and pulverized in a tissue press (Biospec, Bartlesville, OK). The pulverized tissues were extracted in a glass Tenbroeck tissue homogenizer using a two phase system [24]. Briefly, 1.0 g of tissue was homogenized in 18 ml chloroform/ methanol (1:2, by Vol.) containing 200 μl 6 N HCl. A 6.0 ml aliquot of chloroform was added to the extract and phase separation was induced with 6.0 ml of 2 M KCl containing 0.5 M H3PO4 followed by centrifugation at room temperature (600 × g). The lower chloroform layer was transferred to a second tube and the upper aqueous layer was washed once with 12.0 ml chloroform. The organic fractions were combined then washed with 10 ml of theoretical aqueous phase (chloroform/ methanol/ H2O (1:12:12, by Vol.) containing 100 μl 6N HCl. Following centrifugation the upper phases were combined and stored at -20°C until use. Plasma samples from whole blood collections were extracted in chloroform/ methanol (1:2, by Vol.) as described [25] using 0.15 M KCl to induce phase separation. Following centrifugation at room temperature (600 × g) the lower chloroform phase was removed and was washed with theoretical upper phase as described above. Following a second centrifugation the two upper phases were combined and the extracts were stored at -20° C until use.
Sample derivatization
A sample from the aqueous extract was transferred to a glass screw-top test tube (13 × 100 mm) and concentrated to zero at 75° C. A 1.0 ml aliquot of 4 N sodium hydroxide containing internal standard (phloroglucinol, 1, 3, 5-benzenetriol) was added to the sample then mixed until the samples was completely dissolved. To start the reaction, a 0.5 ml aliquot of n-hexane and 200 μl benzoyl chloride (Sigma, St. Louis, MO, ≥99%, density 1.212g/ml) was added to the sample and capped with a Teflon-lined closure. The samples and standards were mixed gently then incubated in a metabolic incubator (Boekel Grant, Feasterville, PA) at 40° C for 4 h. Samples used to determine the reaction time course were incubated between 15 min and 6 h.
Parallel incubations were performed on a phosphatidylinositol standard (Avanti Polar Lipids, Alabaster, AL) to demonstrate the necessity for sample extraction prior to derivatization. Recovery of myo-inositol was performed using known amounts of radiolabeled [1, 2-3H] myo-inositol in parallel incubations with a final concentration ranging between 1 and 6 pmol. Following incubation, the benzoyl ester derivatives were extracted out of the reaction vessel using three washes with 2.0 ml n-hexane. The n-hexane washes containing the benzoyl ester derivatives were combined and concentrated to zero via vacuo at 45° C for 1 h using a SpeedVac® System (ThermoSavant, Milford, MA). The concentrated extracts were re-solvated in 1.0 ml H2O/ acetonitrile (42:58, by Vol.) and stored at 4° C until use.
Standard solutions
Stock standard solutions (10 mg/ml) were prepared by dissolving commercial preparations of D-fructose, glycerol, phloroglucinol (internal standard), D-glucose, myo-inositol, and D-sorbitol in sodium hydroxide (4 N). Standard working solutions were obtained by making appropriate dilutions of the stock solutions in sodium hydroxide (4 N). For routine calculations, the working internal standard solution (0.1 mg/mL phloroglucinol) was prepared by diluting the internal standard stock with sodium hydroxide (4 N). All solutions were stored at 4° C and discarded after two weeks.
Chromatography
The separation and quantification of benzoylated samples and standards were performed using a Waters™ 1525 binary HPLC pump equipped with a column heater, 2487 dual wavelength absorbance detector, and a 717plus Autosampler (Milford, MA). Waters Breeze™ software (Ver. 3.30, Milford, MA) was used for instrument control, data acquisition, and peak area analysis. Separations were performed on a Waters Sunfire® C18 reversed-phase column (250 × 4.6 mm, 5 μm, Milford, MA) and peak detection was performed at 231 nm. A gradient elution using H2O and acetonitrile similar to that reported [26] was used to isolate the benzoylated derivatives. Briefly, a flow rate of 1.0 ml/min and a column temperature of 55° C were maintained throughout the separation. An initial solvent composition of 42% H2O and 58% acetonitrile was maintained at injection and held for 5 min. At 5 min the proportion of acetonitrile was increased linearly to 80% over a 41 min period then held at 80% for 1 min. At 47 min the proportion of acetonitrile was increased linearly to 95% over 1 min and held at 95% for 5 min. At 53 min, the elution solvent was returned to the initial composition over a 2 min period and allowed to equilibrate for 5 min prior to starting the next injection. All samples were held at room temperature and mixed thoroughly prior to injection.
Mass spectral analysis
Mass spectrometry was performed on samples collected following separation by HPLC using a quadrupole mass spectrometer (API3000, Applied Biosystem, Foster City, CA, USA) equipped with a Turbo Ion Spray ionization source (TSI). Analyst® software (Ver. 1.4.1) was used for instrument control, acquisition, and data analysis. Using a syringe pump, the samples, 6 pmol/μl benzoylated glycerol dissolved in 65% acetonitrile, or 9 pmol/μl benzoylated myo-inositol dissolved in 80% acetonitrile both having final a concentration of 0.1% formic acid, was infused directly into the TSI source (10 μl/min). The source was operated in ion electrospray mode at 27° C with an electrospray voltage of 5000. The mass spectrometer was operated in positive Q1 full scan mode at unit resolution with a scan cycle time of 2.0 s and number of scan cycles equal to 71. The focusing and entrance potentials were optimized at 200 V and 10 V, respectively while the optimal declustering potential for benzoylated myo-inositol was 40 V and 5 V for benzoylated glycerol.
Calculations
Plasma and tissue concentrations of glycerol and myo-inositol were calculated based on standard curves using the internal standard phloroglucinol as outlined below.
In this equation the term “analyte” represents either glycerol or myo-inositol and the terms [phloroglucinol] and [analyte] represents the concentration of each, respectively. Peak area analysis was performed using Waters Breeze™ Software (Ver. 3.30, Milford, MA) and linear regression analysis to measure the slope and y-intercept from experimentally determined calibration curves was performed using SigmaPlot for Windows (Ver. 10, Systat Software Inc, Chicago, IL). Tissue and plasma levels are reported in units of mmol/kg wet weight and mmol/L. All data is reported as means ± SD.
Results
Chromatography, reaction time course, and recovery
A chromatogram of liver extract showing peak resolution of benzoylated D-fructose, glycerol, phloroglucinol, D-glucose, internal standard, myo-inositol, and D-sorbitol is shown in Figure 1, (Panel A). Peak identification was performed by measuring the relative retention times of benzoylated analytes to the internal standard phloroglucinol. The benzoylated analytes are well resolved from reagent peaks (2.0- 20.0 min, Figure 1, Panel B) and other interfering contaminates encountered from extracted tissue. The retention times of D-fructose, glycerol, phloroglucinol (internal standard), D-glucose, myo-inositol, and D-sorbitol were 14.4, 23.5, 34.7, 42.2, 45.8, and 48.0 min, respectively. With the exception of D-Glucose, all benzoylated samples and standards were separated with baseline resolution. To demonstrate the need for extraction of samples prior to analysis, a chromatogram was generated by incubating a phosphatidylinositol standard with benzoyl chloride as outlined in the methods section (Figure 1, Panel B). This chromatogram demonstrates that the reaction conditions used to form the benzoylated derivatives degrade membrane phospholipid, resulting in benzoylated glycerol and myo-inositol. Thus it was determined that the extraction of samples prior to analysis was necessary to achieve an accurate measure of the concentration of endogenous glycerol and myo-inositol.
Figure 1.
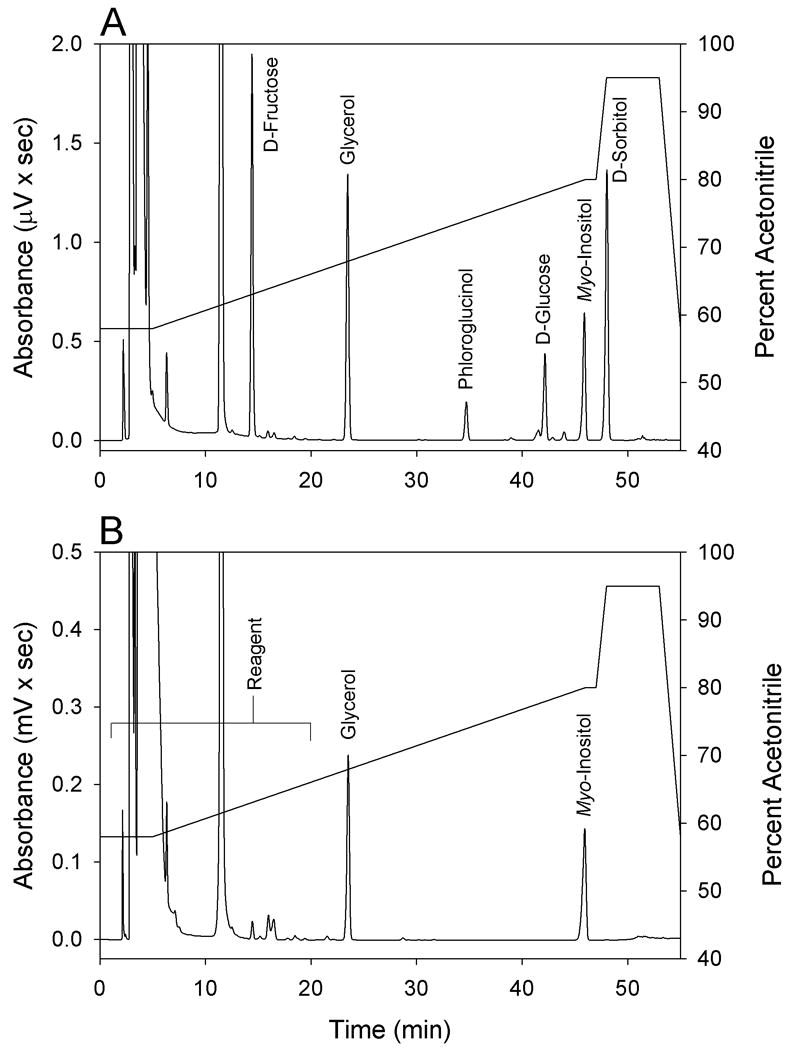
Chromatogram illustrating the elution orders of benzoylated carbohydrates, glycerol, myo-inositol, and internal standard (phloroglucinol) from a liver extract (Panel A). Chromatogram demonstrating reagent peaks and the formation of benzoylated glycerol and myo-inositol from pure phosphatidylinositol following derivatization as outlined in the experimental section (Panel B). Solid line indicates the percent of acetonitrile used to separate the benzoylated products.
Using the above separation a reaction time course was generated by incubating 6 nmol of glycerol together with 3 nmol of myo-inositol in a single reaction vessel. This experiment illustrated that the peak area absorbance of the two benzoylated derivatives reach a maximum by 240 min and remained stable for up to 360 min (data not shown). The calculated peak area ratio between the two samples show that there was a linear increase in their absorbance ratio between 15 and 210 min reaching a maximum peak area ratio of 1.0 between 210 and 360 min. Comparison of the change in the peak area as a function of time showed that glycerol was converted more rapidly than myo-inositol having conversion rates of approximately 0.04 and 0.03 pmol/min, respectively. As expected, based on the molar equivalent concentration of free hydroxyl groups of the two analytes, the peak area ratio of the two analytes reached a maximum of 1.0 between 210 and 360 min suggesting that the efficiency of the reaction and the recovery of sample were equal for each analyte. Sample recovery of myo-inositol was determined by performing incubations on samples containing known amounts of [1, 2-3H] myo-inositol with final concentrations ranging between 1 and 6 pmol. These studies showed that the recovery of radiolabeled myo-inositol was 37.7 ± 0.5% (n=3) for all concentrations measured (data not shown).
Linearity and mass spectral analysis
Calibration curves for glycerol and myo-inositol (Figure 2, Panels A and B) show that peak area for the two analytes doubled when the concentrations were doubled and remained linear within a calibration range of 2.7-174 nmol for glycerol and 1.4-89 nmol for myo-inositol. Regression analyses of the calibration data show that the coefficients of correlation were 0.999 for both benzoylated analytes. The calculated slopes of benzoylated glycerol and myo-inositol were 8.14 × 10⁻² and 8.44 × 10⁻² pmol/μV × sec, respectively. The absorption spectrum and mass spectral analysis of the benzoylated derivatives was determined using pooled calibration samples isolated by HPLC. As opposed to the native and optically silent precursor analytes, the benzoylated glycerol and myo-inositol standard derivatives had absorption maximum at 195 and 231 nm when dissolved in H2O/acetonitrile (20:80, by Vol.).
Figure 2.
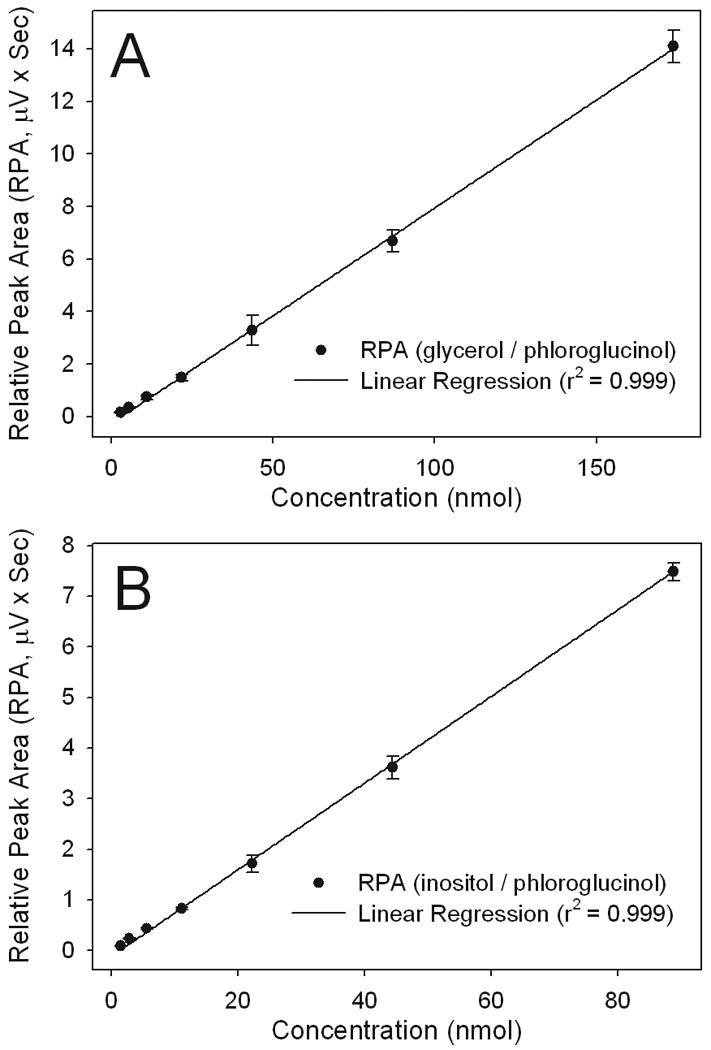
Internal standard calibration curves showing the linear calibration range between 2.7-174 and 1.4-89 nmol for glycerol (Panel A) and myo-inositol (Panel B), respectively. Values represent the peak area ratio of glycerol and myo-inositol to that of the internal standard phloroglucinol (means ± SD (n = 5)). Abbreviations: RPA, relative peak area.
Mass spectral analysis of the benzoylated glycerol isolated from HPLC showed a characteristic molecular ion at m/z 405 and a (M + Na+)+ ion at m/z 427 with a relative abundance of approximately 45 and 55%, respectively (Figure 3, Panel A). The mass spectrum obtained for the benzoylated myo-inositol showed characteristic molecular ion at m/z 806 and a (M + Na+)+ ion at m/z 828 with a relative abundance of approximately 95 and 5% (Figure 3, Panel B). The figure 4A and 4B insets show protonated molecular ions (M + H)+ at m/z 405.3 for benzoylated glycerol and m/z 805.7 for benzoylated myo-inositol. The theoretical mass of fully benzoylated glycerol and myo-inositol are m/z 404.1 and 804.2. Thus while there was interference in the mass spectral analysis due to the formation of M + Na+ ion with samples dissolved in a higher percentage of H2O, no ions were found of partially benzoylated glycerol (m/z 300 and 196), native glycerol m/z 92, partially benzoylated myo-inositol (m/z 701, 596, 492, 388, and 284), native myo-inositol m/z 180, or for other M + Na+ ion derivatives. The presence of the only fully benzoylated products following isolation via HPLC is directly a result of the final hexane extraction. These results suggest that the polar nature of free hydroxyl groups of the native and partially benzoylated polyhydroxyl moieties prevents their extraction into organic solvents [12].
Figure 3.
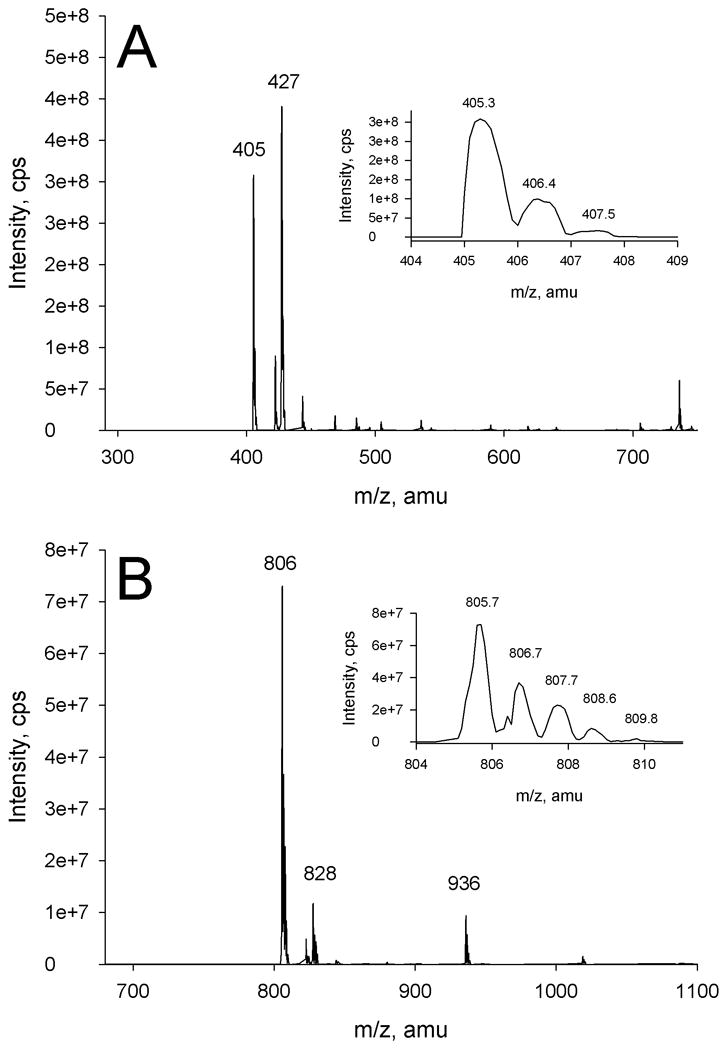
Mass spectrum of benzoylated glycerol (Panel A) showing mass distribution of m/z 405.3 (Panel A, inset) and benzoylated myo-inositol (Panel B) showing mass distribution of m/z 805.7 (Panel B, inset).
Variability, detection limits, and product stability
The inter- and intra-day variability assays for glycerol and myo-inositol were performed using freshly prepared standards and tissue and plasma extracts. Known standards ranging from concentrations between 5.0 and 80.0 nmol/mL were converted to their benzoylated derivatives then quantified via HPLC. The inter-day variation for the individual glycerol measurements ranged between 0.8 and 3.2% (n =5) and the intra-day showed a relative error range of 0.1 to 7.4% (n=5) (Table 1, Panel A). The inter- and intra-day relative standard deviation for the individual myo-inositol standards ranged between 0.9 and 11.7% and 0.8 to 6.6%, respectively (Table 1, Panel B). The limit of quantization (LOQ) of glycerol was equal to 2.5 nmol/ml plasma and 6.4 nmol/g tissue and the LOQ of myo-inositol was 1.8 nmol/mL plasma and 3.6 nmol/g tissue. The limit of detection of glycerol and myo-inositol, as determined by serial dilutions of know standards and samples were 70 and 17.5 pmol, respectively. The stability of the benzoylated myo-inositol was determined from benzoylated standards stored at 4° C for up to 28 days in H2O/acetonitrile (42:58, by Vol.) (Table 2). These data show that there was no significant change in the concentration of benzoylated myo-inositol between 0 and 24 days of storage having a calculated concentration ranging between 13.6 and 13.7 nmol with a relative standard deviations ranging between 0.1 and 1.3%. Benzoylated glycerol was equally stable to that found with benzoylated myo-inositol showing no product degradation for up to one month when stored at 4°C. Because sample preparation and analysis is time consuming, samples were processed in group sizes ranging between 24 and 96. By performing analysis on large sample groups minimized handling time making the rate limiting step the automated HPLC analysis. Processing samples in this manner allows for a throughput time of up to 24 samples per day.
Table 1.
Intra- and inter-day variability for glycerol and myo-inositol using the benzoyl ester derivatization method compared to known standards
| A | Glycerol | |||
|---|---|---|---|---|
| Intra-day (n=5) | Inter-day (n=5) | |||
| mean ± SD (%RSD) | Relative Error | mean ± SD (%RSD) | Relative Error | |
| Measured (nmol/ml) | Calculated (nmol/ml) | |||
| 5.00 | 4.63 ± 0.15 (3.2) | 7.4 % | 4.95 ± 0.04 (0.8) | 1.1 % |
| 10.00 | 9.85 ± 0.18 (1.8) | 1.5 % | 10.32 ± 0.09 (0.8) | 3.2 % |
| 20.00 | 19.99 ± 0.51 (2.6) | 0.1 % | 20.91 ± 0.53 (2.5) | 4.6 % |
| 40.00 | 40.77 ± 0.80 (2.0) | 1.9 % | 42.64 ± 0.23 (0.5) | 6.6 % |
| 80.00 | 82.06 ± 0.91 (1.1) | 2.6 % | 84.23 ± 1.75 (2.1) | 5.3 % |
| B | Myo-Inositol | |||
| Intra-day (n=5) | Inter-day (n=5) | |||
| mean ± SD (%RSD) | Relative Error | mean ± SD (%RSD) | Relative Error | |
| Measured (nmol/ml) | Calculated (nmol/ml) | |||
| 5.00 | 5.33 ± 0.12 (2.3) | 6.6 % | 5.31 ± 0.05 (0.9) | 6.2 % |
| 10.00 | 10.28 ± 0.41 (4.0) | 2.8 % | 9.69 ± 1.13 (11.7) | 3.1 % |
| 20.00 | 18.84 ± 1.44 (7.7) | 5.8 % | 20.45 ± 0.45 (2.2) | 2.3 % |
| 40.00 | 40.30 ± 1.79 (4.4) | 0.8 % | 40.79 ± 2.59 (6.4) | 2.0 % |
| 80.00 | 80.66 ± 3.08 (3.8) | 0.8 % | 78.59 ± 1.92 (1.4) | 1.8 % |
Values represent the calculated concentration (means ± SD (n=5)) of glycerol (Panel A) and myo-inositol (Panel B) measured using internal standard calculations. Percent relative error was determined comparing averaged calculated values to know standard concentrations. All sample derivatives were dissolved in H2O/ acetonitrile (42:58, by Vol.) and maintained at room temperature prior to analysis.
Table 2.
Product stability of benzoylated myo-inositol
| Concentration (n=3) | ||
|---|---|---|
| Storage Time (days) | nmol | % RSD |
| 0 | 13.63 ± 0.12 | 0.9 |
| Day 3 | 13.69 ± 0.02 | 0.1 |
| Day 6 | 13.65 ± 0.07 | 0.5 |
| Day 12 | 13.71 ± 0.04 | 0.3 |
| Day 24 | 13.64 ± 0.18 | 1.3 |
Values represent the means ± SD (n=3) of benzoylated myo-inositol standards following incubation at day 0 and following increasing storage times of the original incubate for 3, 6, 12, and 24 days. All benzoylated samples were dissolved in H2O/ acetonitrile (42:58, by Vol.) and stored at 4°C until use.
Plasma and tissue concentration of glycerol and myo-inositol
The plasma and tissue levels of glycerol and myo-inositol measured using the methodology outlined in this manuscript compared to published values are outlined in Table 3. Tissue glycerol levels found in this study ranged between 0.41 and 1.13 mmol/kg wet weight and the plasma concentration was 0.17 ± 0.01 mmol/L. The tissue concentration range of myo-inositol was between 0.22 and 5.41 mmol/kg wet weight with the highest concentrations found in the testis, kidney and microwaved brain. The plasma myo-inositol level determined in this study was 0.072 ± 0.014 mmol/L. As show in Table 3, all established values reported using other techniques were in good agreement with those values found using the method outlined in this manuscript. Reported concentrations of glycerol from liver, kidney, and testis were not available or could not be found at the time this report was written.
Table 3.
Tissue concentrations of glycerol and myo-inositol measured using the benzoyl ester derivatization method report in this manuscript compared to literature values.
| Glycerol | Myo-Inositol | |||
|---|---|---|---|---|
| Benzoyl Chloride Method | Reported Range | Benzoyl Chloride Method | Reported Range | |
| Tissue | mmol/kg wet weight | |||
| Brain | 0.30 ± 0.06 | 0.22-0.42 [6,28] |
4.94 ± 0.70 | 3.60-11.65 [21,29-35] |
| Muscle | 0.98 ± 0.14 | 0.43 [36,37] |
0.22 ± 0.05 | 0.33-2.40 [31,35,38] |
| Liver | 0.72 ± 0.09 | NR | 0.49 ± 0.05 | 0.55-3.30 [21,31,32,35,38,39] |
| Kidney | 1.13 ± 0.11 | NR | 5.41 ± 0.38 | 2.51-8.21 [21,31,32,34,35,38] |
| Heart | 0.41 ± 0.03 | 0.22-1.21 [10,40,41] |
1.45 ± 0.35 | 1.41-1.66 [31,35] |
| Testis | 0.77 ± 0.07 | NR | 1.53 ± 0.22 | 1.35-1.65 [42] |
| mmol/L | ||||
| Serum/Plasma | 0.17 ± 0.01 | 0.11-0.39 [20,43-48] |
0.072 ± 0.014 | 0.060-0.120 [21,32,34,39,49-53] |
Values Represent the means ± SD of tissue and plasma glycerol and myo-inositol (n =5, benzoyl chloride method) determined using the benzoyl ester derivatization method outlined in this manuscript compared to reported concentration ranges. NR represents values that were not found or are not reported in the literature and the numbers within in the square brackets refer to original citations.
Discussion
The quantification of polyhydroxyl compounds from biological samples is important in both clinical and research settings due to the many roles that these molecules have in cellular metabolism. In this regard, the sensitive, non-destructive nature of high performance liquid chromatography makes it ideal for the separation of small samples or complex mixtures of analytes. Unfortunately, based on their chemical structure, most metabolically important polyhydroxyl compounds are transparent to ultraviolet or visible light absorbance detection making them difficult to quantify using standard HPLC equipment. To address this problem, we have described an inexpensive and accurate HPLC procedure to quantify plasma and tissue levels of two metabolically important polyhydroxyl compounds: glycerol and myo-inositol. The method utilizes a pre-column derivatization reaction using benzoyl chloride and aqueous extracts from commonly used two-phase plasma and tissue extraction protocols. The benzoyl-derivatives from the reaction can then be isolated using a reversed phase HPLC separation and quantified by UV detection.
As noted, a similar method has been reported for the analysis of glycerol in serum [20]. However our data demonstrates that glycerophospholipid contamination in plasma can result in the release of endogenous glycerol and myo-inositol. Therefore it is essential that both plasma and tissue samples undergo a two-phase extraction protocol prior to derivatization to remove interfering contaminates found within biological samples. Because these polyhydroxyl compounds are incorporated into and regenerated from membrane lipids, being able to accurately quantify their levels in both plasma and tissue are of great importance when performing metabolic studies. As most metabolic studies require the use of radioactive compounds or drugs that influence metabolism, accurately measuring the specific radioactivity of polyhydroxyl intermediates as well as being able to gauge the influence that therapy has on the homeostasis of naturally occurring polyhydroxyl compounds is crucial. Therefore application of this method will be useful when examining the effects that certain pathophysiological conditions have on polyhydroxyl and membrane lipid metabolism and of the influence that drugs have on glycerol and myo-inositol utilization. The method described herein, relying on a Schotten-Baumann reaction, forms a very stable benzoylated product that permits the processing of a large number of samples. More importantly the benzoylated analytes are easily separated using reversed phase chromatography, quantifiable by in-line UV detection, and allows for further processing of the isolated analyte.
Acknowledgments
This publication was made possible by Grants from the National Center for Research Resources (NCRR), a component of the National Institutes of Health (NIH) (# P20RR17699-05), ND EPSCoR through the NSF (# EPS-0447679), and a UND Faculty Seed Award (#21418-4010).
Abbreviations
- HPLC
high performance liquid chromatography
- glycerol
1,2,3-propanetriol
- myo-inositol
1,2,3,4,5,6-hexahydroxycyclohexane
- phloroglucinol
1,3,5-benzenetriol
Footnotes
Publisher's Disclaimer: This is a PDF file of an unedited manuscript that has been accepted for publication. As a service to our customers we are providing this early version of the manuscript. The manuscript will undergo copyediting, typesetting, and review of the resulting proof before it is published in its final citable form. Please note that during the production process errors may be discovered which could affect the content, and all legal disclaimers that apply to the journal pertain.
References
- 1.Brisson D, Vohl MC, St-Pierre J, Hudson TJ, Gaudet D. Bioessays. 2001;23:534. doi: 10.1002/bies.1073. [DOI] [PubMed] [Google Scholar]
- 2.Hokin MR, Hokin LE. J Biol Chem. 1953;203:967. [PubMed] [Google Scholar]
- 3.Holub BJ. Annu Rev Nutr. 1986;6:563. doi: 10.1146/annurev.nu.06.070186.003023. [DOI] [PubMed] [Google Scholar]
- 4.Lin EC. Annu Rev Biochem. 1977;46:765. doi: 10.1146/annurev.bi.46.070177.004001. [DOI] [PubMed] [Google Scholar]
- 5.Marklund N, Salci K, Lewen A, Hillered L. Neuroreport. 1997;8:1457. doi: 10.1097/00001756-199704140-00026. [DOI] [PubMed] [Google Scholar]
- 6.Bertrand N, Ishii H, Spatz M. Neurosci Lett. 1992;148:81. doi: 10.1016/0304-3940(92)90809-l. [DOI] [PubMed] [Google Scholar]
- 7.Gambert S, Helies-Toussaint C, Grynberg A. Biochim Biophys Acta. 2005;1736:152. doi: 10.1016/j.bbalip.2005.08.004. [DOI] [PubMed] [Google Scholar]
- 8.Denton RM, Randle PJ. Biochem J. 1967;104:423. doi: 10.1042/bj1040423. [DOI] [PMC free article] [PubMed] [Google Scholar]
- 9.Scheuer J, Olson RE. Am J Physiol. 1967;212:301. doi: 10.1152/ajplegacy.1967.212.2.301. [DOI] [PubMed] [Google Scholar]
- 10.de Groot MJ, de Jong YF, Coumans WA, van der Vusse GJ. Pflugers Arch. 1994;427:96. doi: 10.1007/BF00585947. [DOI] [PubMed] [Google Scholar]
- 11.Di Paolo G, De Camilli P. Nature. 2006;443:651. doi: 10.1038/nature05185. [DOI] [PubMed] [Google Scholar]
- 12.Blanke SR, Blanke RV. J Anal Toxicol. 1984;8:231. doi: 10.1093/jat/8.5.231. [DOI] [PubMed] [Google Scholar]
- 13.De Stefanis VA, Ponte JG. J Chromatog. 1968;34:116. [Google Scholar]
- 14.Bell DJ, Talukder MQ. J Chromatogr. 1970;49:469. doi: 10.1016/s0021-9673(00)93661-6. [DOI] [PubMed] [Google Scholar]
- 15.MacGregor LC, Matschinsky FM. Anal Biochem. 1984;141:382. doi: 10.1016/0003-2697(84)90058-7. [DOI] [PubMed] [Google Scholar]
- 16.Wieland O. Biochem Z. 1957;329:313. [PubMed] [Google Scholar]
- 17.Peelen GO, de Jong JG, Wevers RA. Anal Biochem. 1991;198:334. doi: 10.1016/0003-2697(91)90435-v. [DOI] [PubMed] [Google Scholar]
- 18.Shetty HU, Holloway HW, Rapoport SI. Anal Biochem. 1995;224:279. doi: 10.1006/abio.1995.1041. [DOI] [PubMed] [Google Scholar]
- 19.Jellum E, Bjornstad P. J Lipid Res. 1964;5:314. [PubMed] [Google Scholar]
- 20.Li H, Dong J, Chen W, Wang S, Guo H, Man Y, Mo P, Li J. J Lipid Res. 2006;47:2089. doi: 10.1194/jlr.D600009-JLR200. [DOI] [PubMed] [Google Scholar]
- 21.Tomiya N, Suzuki T, Awaya J, Mizuno K, Matsubara A, Nakano K, Kurono M. Anal Biochem. 1992;206:98. doi: 10.1016/s0003-2697(05)80016-8. [DOI] [PubMed] [Google Scholar]
- 22.Owens JA, Robinson JS. J Chromatogr. 1985;338:303. doi: 10.1016/0378-4347(85)80101-8. [DOI] [PubMed] [Google Scholar]
- 23.Kargas G, Rudy T, Spennetta T, Takayama K, Querishi N, Shrago E. J Chromatogr. 1990;526:331. doi: 10.1016/s0378-4347(00)82517-7. [DOI] [PubMed] [Google Scholar]
- 24.Hajra AK, Seguin EB, Agranoff BW. J Biol Chem. 1968;243:1609. [PubMed] [Google Scholar]
- 25.Folch J, Lees M, Sloane Stanley GH. J Biol Chem. 1957;226:497. [PubMed] [Google Scholar]
- 26.Indyk HE, Woollard DC. Analyst. 1994;119:397. doi: 10.1039/an9941900397. [DOI] [PubMed] [Google Scholar]
- 27.Laursen SE, Knull HR, Belknap JK. Anal Biochem. 1986;153:387. doi: 10.1016/0003-2697(86)90107-7. [DOI] [PubMed] [Google Scholar]
- 28.Paschen W, van den Kerchhoff W, Hossmann KA. Metab Brain Dis. 1986;1:37. doi: 10.1007/BF00998475. [DOI] [PubMed] [Google Scholar]
- 29.Ma K, Deutsch J, Villacreses NE, Rosenberger TA, Rapoport SI, Shetty HU. Neurochem Res. 2006;31:759. doi: 10.1007/s11064-006-9080-4. [DOI] [PubMed] [Google Scholar]
- 30.Kindt E, Shum Y, Badura L, Snyder PJ, Brant A, Fountain S, Szekely-Klepser G. Anal Chem. 2004;76:4901. doi: 10.1021/ac049746w. [DOI] [PubMed] [Google Scholar]
- 31.Reddi AS, Jyothirmayi GN, Leevy CB, DeAngelis B, Frank O, Baker H. Alcohol Alcohol. 1990;25:137. doi: 10.1093/oxfordjournals.alcalc.a044988. [DOI] [PubMed] [Google Scholar]
- 32.Palmano KP, Whiting PH, Hawthorne JN. Biochem J. 1977;167:229. doi: 10.1042/bj1670229. [DOI] [PMC free article] [PubMed] [Google Scholar]
- 33.Kofman O, Agam G, Shapiro J, Spencer A. Psychopharmacology (Berl) 1998;139:239. doi: 10.1007/s002130050710. [DOI] [PubMed] [Google Scholar]
- 34.Stewart MA, Sherman WR, Kurien MM, Moonsammy GI, Wisgerhof M. J Neurochem. 1967;14:1057. doi: 10.1111/j.1471-4159.1967.tb09516.x. [DOI] [PubMed] [Google Scholar]
- 35.Battaglia FC, Meschia G, Blechner JN, Barron DH. Q J Exp Physiol Cogn Med Sci. 1961;46:188. doi: 10.1113/expphysiol.1961.sp001532. [DOI] [PubMed] [Google Scholar]
- 36.Guo Z, Zhou L. Metabolism. 2003;52:1571. doi: 10.1016/s0026-0495(03)00325-1. [DOI] [PubMed] [Google Scholar]
- 37.Stallknecht B, Kiens B, Helge JW, Richter EA, Galbo H. Acta Physiol Scand. 2004;180:367. doi: 10.1111/j.1365-201X.2004.01264.x. [DOI] [PubMed] [Google Scholar]
- 38.Sun TH, Heimark DB, Nguygen T, Nadler JL, Larner J. Biochem Biophys Res Commun. 2002;293:1092. doi: 10.1016/S0006-291X(02)00313-3. [DOI] [PubMed] [Google Scholar]
- 39.Yagi K, Kotaki A. Ann N Y Acad Sci. 1969;165:710. [PubMed] [Google Scholar]
- 40.de Groot MJ, Coumans WA, Willemsen PH, van der Vusse GJ. Circ Res. 1993;72:176. doi: 10.1161/01.res.72.1.176. [DOI] [PubMed] [Google Scholar]
- 41.van Bilsen M, van der Vusse GJ, Willemsen PH, Coumans WA, Roemen TH, Reneman RS. Circ Res. 1989;64:304. doi: 10.1161/01.res.64.2.304. [DOI] [PubMed] [Google Scholar]
- 42.Stewart MA, Sherman WR, Harris JT. Ann N Y Acad Sci. 1969;165:609. [PubMed] [Google Scholar]
- 43.Ricart-Jane D, Rodriguez-Sureda V, Benavides A, Peinado-Onsurbe J, Lopez-Tejero MD, Llobera M. Metabolism. 2002;51:925. doi: 10.1053/meta.2002.33353. [DOI] [PubMed] [Google Scholar]
- 44.Lam TK, van de Werve G, Giacca A. Am J Physiol Endocrinol Metab. 2003;284:E281. doi: 10.1152/ajpendo.00332.2002. [DOI] [PubMed] [Google Scholar]
- 45.Lam TK, Yoshii H, Haber CA, Bogdanovic E, Lam L, Fantus IG, Giacca A. Am J Physiol Endocrinol Metab. 2002;283:E682. doi: 10.1152/ajpendo.00038.2002. [DOI] [PubMed] [Google Scholar]
- 46.Alfadda A, DosSantos RA, Stepanyan Z, Marrif H, Silva JE. Am J Physiol Regul Integr Comp Physiol. 2004;287:R147. doi: 10.1152/ajpregu.00103.2004. [DOI] [PubMed] [Google Scholar]
- 47.Arola L, Palou A, Remesar X, Herrera E, Alemany M. Arch Int Physiol Biochim. 1980;88:99. doi: 10.3109/13813458009075674. [DOI] [PubMed] [Google Scholar]
- 48.Guo Z, Jensen MD. J Biol Chem. 1999;274:23702. doi: 10.1074/jbc.274.34.23702. [DOI] [PubMed] [Google Scholar]
- 49.Burton LE, Ray RE, Bradford JR, Orr JP, Nickerson JA, Wells WW. J Nutr. 1976;106:1610. doi: 10.1093/jn/106.11.1610. [DOI] [PubMed] [Google Scholar]
- 50.Reddi AS, Jyothirmayi GN, DeAngelis B, Frank O, Baker H. Comp Biochem Physiol A Comp Physiol. 1991;98:39. doi: 10.1016/0300-9629(91)90574-v. [DOI] [PubMed] [Google Scholar]
- 51.Allison JH, Stewart MA. Nat New Biol. 1971;233:267. doi: 10.1038/newbio233267a0. [DOI] [PubMed] [Google Scholar]
- 52.Carrington AL, Calcutt NA, Ettlinger CB, Gustafsson T, Tomlinson DR. Eur J Pharmacol. 1993;237:257. doi: 10.1016/0014-2999(93)90277-o. [DOI] [PubMed] [Google Scholar]
- 53.Gillon KR, Hawthorne JN, Tomlinson DR. Diabetologia. 1983;25:365. doi: 10.1007/BF00253203. [DOI] [PubMed] [Google Scholar]