Abstract
The levels of lysophosphatidic acid (LPA) or lysophosphatidylcholine (LPC) in plasma have been shown to be markers for several human diseases, including cancers. Here we show that the presence of LPC or other lysophospholipids (LPLs) in lipids extracted from biological samples affects accurate measurement of endogenous LPA in biological samples. We report for the first time the artificial conversion of LPC and lysophosphatidylserine (LPS) to LPA at the ion source of electrospray ionization tandem mass spectrometry (ESI-MS/MS). To avoid the interference of LPC with the quantification of LPA, a method based on high-performance-liquid-chromatography (HPLC) separation of LPA from LPC has been developed.
Keywords: High-performance-liquid-chromatography electrospray ionization tandem mass spectrometry (HPLC-ESI-MS/MS), lysophosphatidic acid (LPA), lysophosphatidylcholine (LPC)
1. Introduction
Lysophosphatidic acid (LPA) and lysophosphatidylcholine (LPC) are bioactive signaling molecules involved in many biochemical, physiological, and pathological processes. LPA and/or LPC levels in plasma or serum have been identified as potential biomarkers for certain human diseases, such as ovarian cancer [1–6], colorectal cancer [7], myeloma [8], sepsis, and other pathophysiological conditions [9–12]. Thus, for both biological functional assays and marker development, it is extremely important to develop methods which accurately and reproducibly analyze them.
Although many analytical methods have been developed for the analysis of phospholipids, including NMR method [13–17], mass spectrometry (MS)-based method is the best in terms of accurate quantification [18]. Many different laboratories now use liquid chromatography-tandem mass spectrometry (LC-MS/MS) for detection and quantitative analyses of lysophospholipids (LPLs). However, a number of different lipid preparation and LC-MS conditions have been utilized. For example, in our lab, thin layer chromatography (TLC) was used to purify LPA and then a flow injection in MS was used to quantify LPA [19], while Yoon et al. developed a direct flow injection LC-ESI-MS/MS method to analyze LPA in human plasma samples [6, 20]. Recently, Shan et al. have reported that some unknown compounds in plasma produce the same parent-to-daughter ion transitions as LPA and interfere with the quantification of LPA in a direct flow injection LC-ESI-MS/MS method [21]. We have observed the same phenomenon in our studies (unpublished). Since LPA has been shown to be involved in numerous biological activities, accurate measurement of endogenous LPAs becomes critically important.
In the current work, we have investigated the “unknown compounds” in plasma that could give rise to the “LPA” signal in MS detection and found that LPCs were the major source. In addition, lysophosphatidylserine (LPS) could also generate “LPA” signal during mass spectrometric analysis. Thus, separation of LPC and/or LPS from LPA is essential for accurate detection of endogenous LPA in biological samples. The HPLC conditions used for separating LPAs from LPCs have been established.
2. Experimental
2.1. Materials
Lipid standards were purchased from Avanti Polar lipids (Birmingham, AL). Organic solvents were purchased from Sigma (St. Louis, MO) or Fisher Scientific (Pittsburgh, PA). Mouse blood samples were obtained from the facial vein of mice in EDTA-containing tubes and centrifuged at 1,750g for 15 min at room temperature. Plasma samples were aliquoted into siliconized eppendorf tubes (PGC Scientifics, Frederick, Maryland) and frozen at −80°C until utilized.
2.2. Lipids extraction and HPLC-ESI-MS/MS
LPLs extraction was performed essentially the same as we described previously [7], except 10 μL of plasma samples (instead of 100 μL) were used. MS analyses were performed using API-4000 (Applied Biosystems, Forster City, CA). Typical operating parameters were as follows: collision gas (CAD) 8 units, curtain gas (CUR) 10 psi, ion source gas 1 (GS1) 15 psi, ion source gas 2 (GS2) 35 psi, electrospray voltage 5000 V with positive ion MRM mode or −4200 V with negative ion MRM mode, and a temperature of heater at 500 °C. Multiple reaction monitoring (MRM) mode was used for measurement of LPLs. Negative and positive monitoring ions were described previously [7, 19].
Samples (10 μL) were loaded through a LC system (Agilent 1100) with an auto sampler. A TARGA C18 5 μM, 2.1 mm ID × 10 mm TR-0121-C185 (Higgins Analytical, Southborough, MA USA) HPLC column was used for the separation of LPC from other LPLs. The mobile phase A was MeOH/water/NH4OH (90:10:0.1, v/v/v) and the mobile phase B was 5 mM ammonium acetate in MeOH/water (90:10, v/v). The HPLC separations were 12 min/sample using the following scheme: 1) 100% A for 3 min with a flow rate at 0.2 mL/min; 2) the mobile phase was changed from 100% A to 100% B over 2 min with the flow rate increased from 0.2 to 0.8 mL/min; 3) a constant flow rate of 0.8 mL/min for 5 min; 4) the mobile phase was changed from 100% B to 100% A in 1 min with the flow rate decreased from 0.8 to 0.2 mL/min; and 5) constant flow rate of 0.2 mL/min for 1 min. For LPCs detection, samples (10 μL) were directly injected into the MS ion source; the flow rate was 0.2 mL/min and the duration was 1.5 min/sample.
3. Results and discussions
3.1. LPAs in plasma
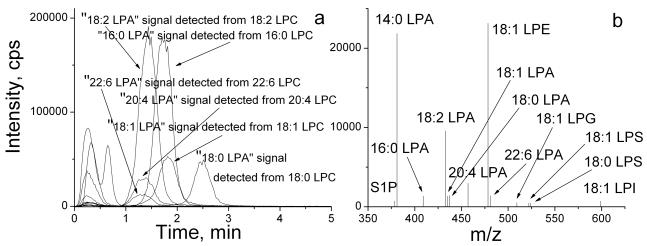
We have found that acidic condition was required for effective extraction of LPAs, and short-time incubation during lipid extraction was important to prevent acid-induced hydrolysis [19, 22]. To determine whether a separation of other lipids from LPAs was necessary for LPA detection, we developed a HPLC method (see the Experimental section). A short C18 HPLC column (10 mm) was used and the inclusion of ammonium acetate (5 mM) in the mobile phase reduced the elusion times for phospholipids, such as phosphatidylethanolamine (PE) and phosphatidylcholine (PC) to 12 min. While lysophosphatidylglycerol (18:1 LPG), lysophosphatidylethanolamine (18:1 LPE), 18:1 LPS, and lysophosphatidylinositol (18:1 LPI) were not well separated from LPAs (eluted in 0.5–1 min), other lipids, including LPCs, phosphatidic acid (PA), and phosphatidylethanolamine (PE) were well separated from LPAs (Fig. 1–3). The chromatogram (Fig. 1a) and mass spectrum (Fig. 1b) of LPA species extracted from a mouse plasma sample using negative ion MRM detection mode are shown. Two sets of “LPA” MS signals were detected in fractions eluted at 0.5–1 min and 1.5–4 min, respectively (Fig. 1a). Under the same HPLC-MS/MS conditions, the authentic LPAs (LPA standard compounds) were eluted between 0.5–1 min (Fig. 2a), indicating that the lipids eluted at 0.5–1 min should be endogenous LPA in the plasma. On the other hand, the LPA signals detected from the lipids eluted between 1.5–4 min could be derived from an unknown source.
Figure 1.
Negative ion MRM chromatogram (a) of LPLs with HPLC separation, and mass spectrum (b) eluted from the HPLC column in 0–1 min. The LPLs were extracted from a mouse plasma sample.
Figure 3.
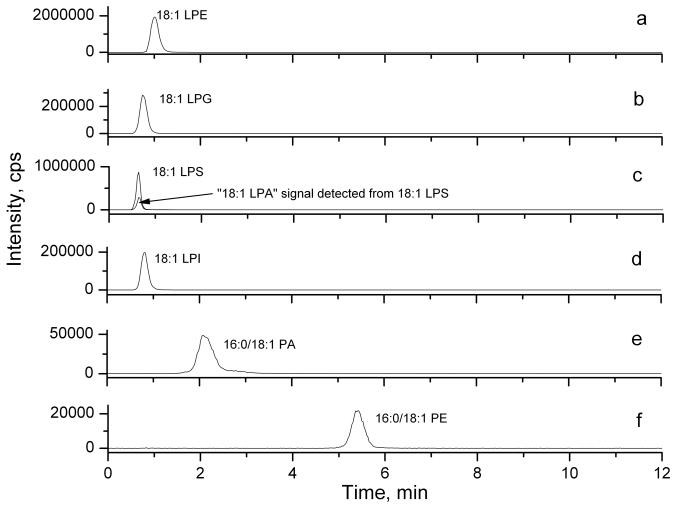
Negative ion MRM chromatograms of (a) 18:1 LPE, (b) 18:1 LPG, (c) 18:1 LPS, (d) 18:1 LPI, (e) 16:0/18:1 PA, and (f) 16:0/18:1 PE.
Figure 2.
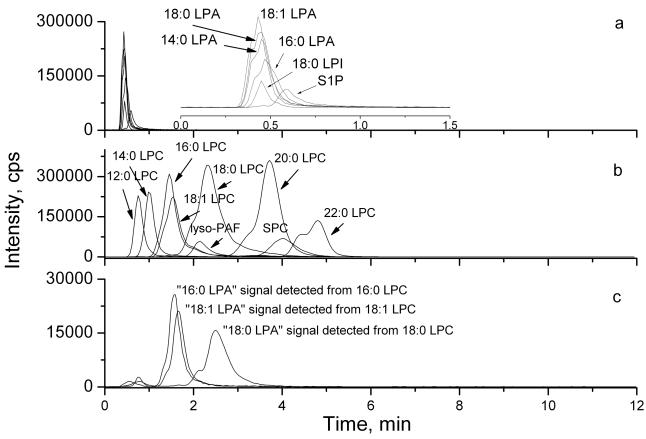
The chromatogram of LPL standards detected by HPLC-ESI-MS/MS. (a) Negative ion MRM mode analysis of LPAs, S1P and LPI standards (100 nM each); The insert is a time expansion of the chromatogram; (b) positive ion MRM mode analysis of LPCs, SPC and lyso-PAF standards (100 nM each); (c) Negative ion MRM mode analysis of 16:0, 18:1 and 18:0 LPC standards (100 nM each).
3.2. The conversions of LPC and LPS to LPA
In any of the published methods for lipids extraction [7, 19, 22–25], LPCs were co-extracted with LPAs, albeit the efficiencies of extractions varied from method to method. Since LPC concentrations in biological samples are generally 10–100 times higher than those of LPA [7, 19, 23], we tested whether the second set of “LPA” signals which eluted between 1.5–4 min were derived from conversion of LPC. Under the same HPLC conditions, different LPC species, sphingosylphosphorylcholine (SPC) and lyso-platelet factor (lyso-PAF) (100 nM) were separated from corresponding LPAs and were eluted between 0.5–6 min and were detected in the positive ion MRM mode (Fig. 2b). When 16:0, 18:1 and 18:0 LPC standards (100 nM) were injected without other lipids and MS signals were detected in the negative ion detection mode, two sets of “LPA” MS signals were detected in fractions eluted at 0.5–1 min and 1–4 min, respectively (Fig. 2c). The signals detected from the lipid fractions eluted between 0.5 and 1 min were very weak, which were from a very low level of contamination of LPAs in standard LPCs. However, strong “LPA” MS signals were detected in the fractions eluted from 1–4 min, corresponding to the elution times for authentic LPCs (compare Figs. 2b and 2c, e.g. the 16:0 LPC signaling detected in the positive ion mode was also detected as a 16:0-LPA in the negative ion mode from the same retention time). Approximately 15% of LPCs were detected as LPAs. Importantly, only specific “LPA” signals were detected from each of the corresponding LPC isoform (such as only “18:1-LPA” signal was detected form 18:-1-LPC), which further rules out non-specific contamination. Thus, our data showed that a part of LPCs could lose their choline group at the ion source before the parent ions were detected and thus give rise to signals which were indistinguishable from endogenous LPA as detected in the negative ion mode.
We also determined whether other LPLs, such as LPE, LPG, LPS, and LPI were also able to generate a LPA-like signal, whether PA could lose one fatty acid chain to give a LPA-like signal, and whether PE can lose one fatty acid chain and the ethanolamine group to give a LPA-like signal. The results of MS analyses of when LPE, LPG, LPS, LPI, PA, or PE (100 nM) separately injected into MS are shown in Fig. 3. Our chromatographic conditions well separated PA and PE well from other LPLs, although these LPLs could not be well separated from each other. Neither PA nor PE gave rise to LPA- or LPE-like signals (Figs. 3e and f), indicating these phospholipids do not generate artificial LPL signals in MS. However, LPS, similar to LPC, also gave rise to LPA-like signals (Fig. 3c). The “LPA” peak detected underneath the LPS peak, suggests that either the commercial LPS samples contained contaminated LPA or LPA-like signaling can be artificially generated in MS by losing the serine residue. To distinguish these two possibilities, we examined the commercial LPS using a thin layer chromatography (TLC) method [Silica G60, chloroform:MeOH:AmOH (65:35:5.5)] to separate LPS from LPA. No LPA contamination was detected in commercially available LPS samples (data not shown), indicating that similar to LPC, LPS is another source of artificial LPA signal in MS. We have examined human and mouse blood samples (serum or plasma) and found that LPS was not detectable in these samples (Fig. 1b and data not shown), indicating that a pre-separation of LPS from LPA is unnecessary for blood analyses of LPAs. However, LPS was present in certain cell pellets or supernatants (our unpublished data); To separate LPA from LPS, other mobile phases (e.g. acetonitrile), different additives in the mobile phase, including formic acid (0.2%) or acetic acid (0.2%), and/or longer HPLC columns, including both normal and reverse phase columns (26) were tested. None of these methods separated LPS from LPA. Thus, a different separation method, such as a TLC method for LPA and LPS may be necessary for accurate analyzing endogenous LPA in tissues and cells.
In contrast, other lysophospholipids, such as LPE, LPG, or LPI did not generate any LPA-like signal (Fig. 3a, b, and d), indicating that unlike the choline or the serine group, other groups of molecules (such as ethanolamine) attached to the phosphate are not lost at the ion source and the parent ions can be truthfully detected. In addition, we carefully examined the potential interactions or ion suppression among these lipids and LPAs, and found that co-existing of these lipids did not affect each other in MS-based quantification. Therefore, separation of LPE, LPG, or LPI from LPA is not necessary for an accurate analysis of endogenous LPA in biological samples using MS analyses.
We tested further whether alkaline conditions used in the mobile phase of HPLC had led to LPC-LPA conversion. When a neutral mobile phase was used [MeOH: H2O (90:10)], a similar rate of conversion (~17.5 %) was detected, indicating that the small amount of alkaline (NH4OH) used in our mobile phase does not affect this process. The electrospray voltage and temperature used at the MS ion source were also investigated. Using lower voltage and temperature, which resulted in reduced sensitivity, did not prevent this conversion (data not shown). Together, the loss of the choline or serine group from LPC or LPS is likely to happen at the MS ion source, where the collisions with gas molecules may be the major source of this loss.
3.3. A pre-separation step was necessary for detection of endogenous LPAs in biological samples
Several labs have established calibration curves for quantitation of LPLs [6–8, 11–12, 19, 22, 26] using directly standard solutions. This can result in systematic errors (up to more than 10% for some LPLs) when quantifying real samples due to the influence of extraction recoveries and/or ion suppression effects. Therefore we decided to extract the calibration samples in the same way as the real samples and validate our methodology by analyzing spiked plasma (<5% errors).
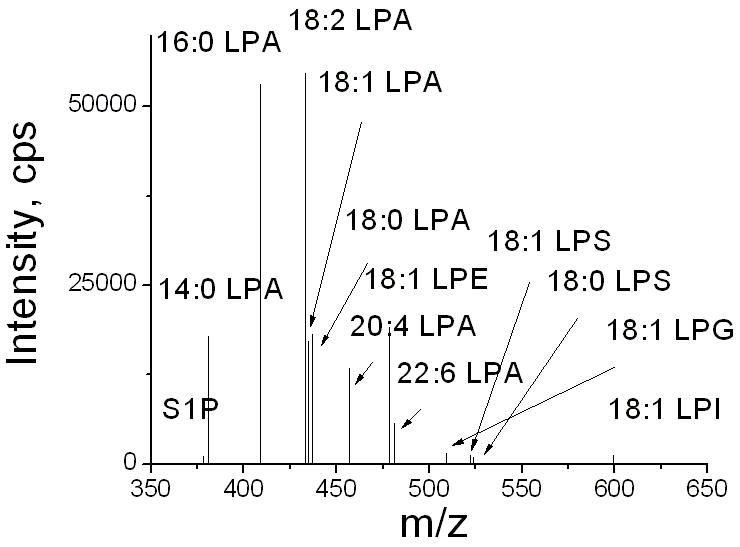
The importance of including a pre-separation step for detection of LPAs was further confirmed by comparing the results of LPAs with or without HPLC separation. A direct flow injection ESI-MS/MS method was used to analyze LPLs in the same plasma sample used in Fig. 1. Comparing the mass spectrum of LPAs detected in the lipid fractions eluted at 0.5–1 min with HPLC separation (Fig. 1b), much higher “LPA” signals were detected without HPLC separation (Fig. 4). Table 1 summarizes the quantitative differences when LPAs were detected in 8 mouse plasma samples with or without the HPLC separation. Without the pre-separation of LPC from LPA, the total LPA levels detected were about 50 times higher than those endogenous LPA levels detected when a HPLC separation was applied. For different species of LPAs, the endogenous levels ranged from less than 1% to ~26% (Table 1). These results clearly indicate the absolute necessity of LPC separation from LPA for detection of endogenous LPA. In contrast, as shown in Fig. 4, LPS was found to be essentially absent in plasma samples (Fig. 4), indicating that in blood samples the pre-separation of LPS from LPA step from blood samples is not be necessary.
Figure 4.

The mass spectrum of LPLs extracted from a mouse plasma sample without HPLC separation.
Table 1.
Quantification of LPA by ESI-MS/MS with or without a HPLC separation in 8 mice plasma samples. The concentrations of LPAs in the sample were calculated by established standard curves.
| μM | 16:0 LPA | 18:2 LPA | 18:1 LPA | 18:0 LPA | 20:4 LPA | 22:6 LPA | total LPA | |
|---|---|---|---|---|---|---|---|---|
| with HPLC separation | Mean | 0.48 | 0.36 | 0.13 | 0.34 | 0.35 | 0.45 | 2.10 |
| SD | 0.22 | 0.12 | 0.05 | 0.18 | 0.21 | 0.27 | 0.58 | |
| without HPLC separation | Mean | 49.7 | 19.7 | 8.8 | 17.6 | 6.3 | 1.7 | 103.7 |
| SD | 13.3 | 4.2 | 2.3 | 3.9 | 2.4 | 0.9 | 18.0 | |
| %a | 0.96 | 1.85 | 1.45 | 1.93 | 5.53 | 25.77 | 2.02 |
the percentage of authentic LPA.
In summary, our results suggest that pre-separation of LPCs from LPAs is necessary for the accurate analysis of endogenous LPAs in plasma and many other biological samples (since LPC concentrations in most biological samples are higher than those of LPA). HPLC conditions for separation of LPCs were established. It is worth noting that our HPLC conditions will elute all phospholipids in 12 min to avoid accumulation of phospholipids on the column, which is important for multiple samples analyses using the same HPLC column. Furthermore, using standard curves established under the same extraction and MS conditions is very important for accurate quantification of LPLs.
Acknowledgments
This work was supported in part by a RO1 CA95042 to YX. We thank Ms. Andrea R. Masters and Dr. David R. Jones, Ph.D. at the IU Simon Cancer Center Clinical Pharmacology Analytical Core laboratory for the trainings and assistance in MS analyses. We thank Dr. Rosemary Steimetz and Mr. Kevin J. McClelland for editing and proof reading of the manuscript.
Footnotes
Publisher's Disclaimer: This is a PDF file of an unedited manuscript that has been accepted for publication. As a service to our customers we are providing this early version of the manuscript. The manuscript will undergo copyediting, typesetting, and review of the resulting proof before it is published in its final citable form. Please note that during the production process errors may be discovered which could affect the content, and all legal disclaimers that apply to the journal pertain.
References
- 1.Xu Y, Shen Z, Wiper DW, Wu M, Morton RE, Elson P, Kennedy AW, Belinson J, Markman M, Casey G. Jama. 1998;280:719. doi: 10.1001/jama.280.8.719. [DOI] [PubMed] [Google Scholar]
- 2.Shen Z, Wu M, Elson P, Kennedy AW, Belinson J, Casey G, Xu Y. Gynecol Oncol. 2001;83:25. doi: 10.1006/gyno.2001.6357. [DOI] [PubMed] [Google Scholar]
- 3.Sutphen R, Xu Y, Wilbanks GD, Fiorica J, Grendys EC, LaPolla JPJ, Arango H, Hoffman MS, Martino M, Wakeley K, Griffin D, Blanco RW, Cantor AB, Xiao YJ, Krischer JP. Cancer Epidemiol Biomarkers Prev. 2004;13:1185. [PubMed] [Google Scholar]
- 4.Sedlakova I, Vavrova J, Tosner J, Hanousek L. Ceska Gynecol. 2006;71:312. [PubMed] [Google Scholar]
- 5.Meleh M, Pozlep B, Mlakar A, Meden-Vrtovec H, Zupancic-Kralj L. J Chromatogr B Analyt Technol Biomed Life Sci. 2007;858:287. doi: 10.1016/j.jchromb.2007.08.008. [DOI] [PubMed] [Google Scholar]
- 6.Yoon HR, Kim H, Cho SH. J Chromatogr B Analyt Technol Biomed Life Sci. 2003;788:85. doi: 10.1016/s1570-0232(02)01031-0. [DOI] [PubMed] [Google Scholar]
- 7.Zhao Z, Xiao Y, Elson P, Tan H, Plummer SJ, Berk M, Aung PP, Lavery IC, Achkar JP, Li L, Casey G, Xu Y. J Clin Oncol. 2007;25:2696. doi: 10.1200/JCO.2006.08.5571. [DOI] [PubMed] [Google Scholar]
- 8.Sasagawa T, Okita M, Murakami J, Kato T, Watanabe A. Lipids. 1999;34:17. doi: 10.1007/s11745-999-332-5. [DOI] [PubMed] [Google Scholar]
- 9.Drobnik W, Liebisch G, Audebert FX, Frohlich D, Gluck T, Vogel P, Rothe G, Schmitz G. J Lipid Res. 2003;44:754. doi: 10.1194/jlr.M200401-JLR200. [DOI] [PubMed] [Google Scholar]
- 10.Fuchs B, Schiller J, Wagner U, Hantzschel H, Arnold K. Clin Biochem. 2005;38:925. doi: 10.1016/j.clinbiochem.2005.06.006. [DOI] [PubMed] [Google Scholar]
- 11.Ehehalt R, Wagenblast J, Erben G, Lehmann WD, Hinz U, Merle U, Stremmel W. Scand J Gastroenterol. 2004;39:737. doi: 10.1080/00365520410006233. [DOI] [PubMed] [Google Scholar]
- 12.Takatera, Takeuchi A, Saiki K, Morisawa T, Yokoyama N, Matsuo M. J Chromatogr B Analyt Technol Biomed Life Sci. 2006;838:31. doi: 10.1016/j.jchromb.2006.03.006. [DOI] [PubMed] [Google Scholar]
- 13.Kuliszkiewicz-Janus M, Tuz MA, Baczynski S. Biochim Biophys Acta. 2005;1737:11. doi: 10.1016/j.bbalip.2005.08.019. [DOI] [PubMed] [Google Scholar]
- 14.Kuliszkiewicz-Janus M, Baczynski S, Jurczyk A. Med Sci Monit. 2004;10:CR485. [PubMed] [Google Scholar]
- 15.Shatov AV, Ognerubov NA. Urologiia. 2004;3:25. [PubMed] [Google Scholar]
- 16.Kuliszkiewicz-Janus M, Janus W, Baczynski S. Anticancer Res. 1996;16:1587. [PubMed] [Google Scholar]
- 17.Seijo L, Merchant TE, van der Ven LT, Minsky BD, Glonek T. Lipids. 1994;29:359. doi: 10.1007/BF02537190. [DOI] [PubMed] [Google Scholar]
- 18.Xiao Y, Xu Y. Functional lipodomics. CRC Press; Boca Raton, FL: 2006. p. 125. [Google Scholar]
- 19.Xiao YJ, Schwartz B, Washington M, Kennedy A, Webster K, Belinson J, Xu Y. Anal Biochem. 2001;290:302. doi: 10.1006/abio.2001.5000. [DOI] [PubMed] [Google Scholar]
- 20.Sonoda H, Aoki J, Hiramatsu T, Ishida M, Bandoh K, Nagai Y, Taguchi R, Inoue K, Arai H. J Biol Chem. 2002;277:34254. doi: 10.1074/jbc.M201659200. [DOI] [PubMed] [Google Scholar]
- 21.Shan L, Jaffe K, Li S, Davis L. J Chromatogr B Analyt Technol Biomed Life Sci. 2008;864:22. doi: 10.1016/j.jchromb.2008.01.031. [DOI] [PubMed] [Google Scholar]
- 22.Xiao Y, Chen Y, Kennedy AW, Belinson J, Xu Y. Ann N Y Acad Sci. 2000;905:242. doi: 10.1111/j.1749-6632.2000.tb06554.x. [DOI] [PubMed] [Google Scholar]
- 23.Bligh EG, Dyer WJ. Can J Biochem Physiol. 1959;37:911. doi: 10.1139/o59-099. [DOI] [PubMed] [Google Scholar]
- 24.Folch J, Lees M, Sloane Stanley GH. J Biol Chem. 1957;226:497. [PubMed] [Google Scholar]
- 25.Yatomi Y, Ohmori T, Rile G, Kazama F, Okamoto H, Sano T, Satoh K, Kume S, Tigyi G, Igarashi Y, Ozaki Y. Blood. 2000;96:3431. [PubMed] [Google Scholar]
- 26.Murph M, Tanaka T, Pang J, Felix E, Liu S, Trost R, Godwin AK, Newman R, Mills G. Methods in Enzymology. 2007;433:1. doi: 10.1016/S0076-6879(07)33001-2. [DOI] [PubMed] [Google Scholar]


