

Abstract
Attention deficit hyperactivity disorder (ADHD) is to a large extent influenced by genetic factors, but environmental influences are considered important as well. To distinguish between functional brain changes underlying primarily genetically and environmentally mediated ADHD, we used functional MRI to compare response interference in monozygotic twins highly concordant or discordant for attention problems (AP). AP scores were assessed longitudinally with the Child Behavior Check List attention problem scale (CBCL-AP). Response interference was measured during two executive function paradigms; a color-word Stroop and a flanker task. The neuroimaging results indicated that, across the entire sample, children with high CBCL-AP scores, relative to children with low CBCL-AP scores, showed decreased activation to response interference in dorsolateral prefrontal, parietal and temporal brain regions. Increased activation was noted in the premotor cortex and regions associated with visual selective attention processing, possibly reflecting compensatory mechanisms to maintain task performance. Specific comparisons of high and low scoring concordant twin pairs suggest that AP of genetic origin was characterized by decreased activation of the left dorsolateral prefrontal cortex during the Stroop task and right parietal lobe during the flanker task. In contrast, comparison of twins from discordant monozygotic pairs, suggest that AP of environmental origin was characterized by decreased activation in left and right temporal lobe areas, but only during Stroop interference.
The finding of distinct brain activation changes to response interference in inattention/hyperactivity of ‘genetic’ versus ‘environmental’ origin, indicate that genetic and environmental risk factors for attention/hyperactivity problems affect the brain in different ways.
Keywords: Functional MRI, Stroop task, flanker task, ADHD, genetic risk, environmental risk
INTRODUCTION
ADHD is a childhood onset psychiatric disorder characterized by symptoms of inattention, impulsivity and hyperactivity that affects about 3-5% of the child population (Goldman et al., 1998; Hudziak et al., 2000; Buitelaar and Kooij, 2000). In agreement with the general hypothesis that impaired executive function/inhibition is a core feature of ADHD (Barkley, 1997; Sergeant et al., 2002; Castellanos et al., 2006) brain imaging studies have pointed to impaired frontostriatal brain circuitry underlying ADHD symptoms (Bush et al., 2005; Seidman et al., 2005). For example, structural MR imaging in ADHD children has provided evidence for volume loss in orbitofrontal/inferior prefrontal cortex (Giedd et al., 2001; Carmona et al., 2005; Shaw et al., 2007b) and dorsolateral prefrontal lobes (Semrud-Clikeman et al., 2000; Overmeyer et al., 2001; Kates et al., 2002; Hill et al., 2003; Durston et al., 2004; Carmona et al., 2005; Shaw et al., 2007a), as well as regions of the basal ganglia (Filipek et al., 1997; Overmeyer et al., 2001; Qiu et al., 2009).
In addition to frontostriatal abnormalities, structural changes related to ADHD have also been observed in other brain regions, including the occipital, parietal and temporal lobes (Castellanos et al., 2002; Sowell et al., 2003; Durston et al., 2004; Shaw et al., 2007b), as well as the posterior corpus callosum (Hill et al., 2003) and cerebellum (Durston, 2003; Carmona et al., 2005; Krain and Castellanos, 2006). A recent meta-analysis of 22 region-of-interest studies found reductions of total and right cerebral volume, and volume loss for cerebellar regions, the posterior corpus callosum splenium, right caudate and several frontal regions to be most consistent (Valera et al., 2007). Another meta-analysis of 7 voxel-based studies identified significant gray matter reduction in the right putamen /globus pallidus region (Ellison-Wright et al., 2008). Brain volume increments associated with ADHD have also been reported for regions of both left and right parietal, frontal and temporal lobes (Sowell et al., 2003; van ’t Ent et al., 2007; Brieber et al., 2007) as well as the right occipital lobe (Wang et al., 2007). Increased volumes may indicate a lack of synaptic pruning during brain development (Huttenlocher, 1979), or plastic adjustment to compensate for reduced processing of adjacent brain regions.
Functional brain imaging studies have generally provided support for a core role of frontostriatal deficits in ADHD but, again, other areas have been implied as well (for a meta-analysis see: (Dickstein et al., 2006)) and the exact pattern of ADHD related brain activation differences depends strongly on the type of task used. For example, fMRI during response inhibition tasks indicated that the decreased brain activation in ADHD children was restricted to the frontostriatal network (Durston et al., 2003; Booth et al., 2005). However, decreased brain activation was also found in right occipital-parietal brain regions in a spatial working memory task (Vance et al., 2007) and in frontal and parietal regions and putamen in a cued target detection task (Cao et al., 2008). During the interference condition of an fMRI compatible variant of the Stroop task (Stroop, 1935) decreased activation has been found for the anterior cingulate cortex (ACC), basal ganglia, insula and cerebellum (Zang et al., 2005). Reduced ACC activation has also been reported in adult ADHD patients with the counting Stroop (Bush et al., 1999). Functional MRI recordings during modified versions of the Eriksen flanker task (Eriksen and Eriksen, 1974) indicated decreased activation of frontostriatal (Konrad et al., 2006) and frontal-striatal-temporal-parietal networks (Vaidya et al., 2005) during response interference after incongruent flankers. Functional imaging studies also report increased brain activation in ADHD subjects compared to controls. Functional hyperactivation has been observed most frequently in regions of the occipital and parietal lobes and basal ganglia, but also for frontal brain regions (for an overview see: Fassbender and Schweitzer, 2006).
Numerous twin and family studies indicate that attention problems have a major genetic component explaining up to 80% of the total variance (e.g., Thapar et al., 1999; Neuman et al., 1999; Rietveld et al., 2004; Hudziak et al., 2005; Derks et al., 2008). In agreement with the hypothesis of disturbed dopamine function in frontostriatal brain networks (Dickstein et al., 2006), genetic association studies have provided evidence for the involvement of dopamine transporter and receptor genes (Auerbach et al., 2001; Durston et al., 2005; Durston et al., 2008). However, involvement of other genes has also been reported (Brookes et al., 2006a). For example, in addition to confirmatory evidence for associations at previous candidate genes, a recent genome-wide association (GWA) study identified novel genetic associations for intronic regions of genes CDH13, a negative regulator of neural cell growth, and GFOD1, encoding glucose-fructose oxidoreductase (Lasky-Su et al., 2008).
Despite the high heritability, environmental risks, and possibly gene-environment interactions and correlations (Kahn et al., 2003; Brookes et al., 2006b), are also considered key elements underlying the development of ADHD. Consistent with the fact that ADHD is a childhood onset disorder, environmental risk factors primarily include problems that impair normal brain development, such as maternal alcohol abuse or smoking during pregnancy (Linnet et al., 2003; Huizink and Mulder, 2006), premature birth combined with low birth weight (Bhutta and Anand, 2001) and hypoxia at birth (Lou et al., 2004). Inattention and hyperactivity symptoms may also arise at later ages due to neurological complications, such as childhood stroke (Max et al., 2002; Max et al., 2005a), traumatic brain injury (Herskovits et al., 1999; Gerring et al., 2000; Max et al., 2005b), epilepsy (Powell et al., 1997; Schubert, 2005) and meningitis or autoimmune disorders (Peterson et al., 2000; Wait et al., 2002).
Except for cases with clearly identifiable brain lesions, the neurobiological pathways underlying environmentally driven ADHD are still unclear. Furthermore, it is largely unknown whether genetic and environmental etiologies follow similar or distinct pathways. A distinction between genetically and environmentally mediated neurobiological changes that underlie the development of behavioral traits such as ADHD, can be accomplished using a specific study design in twins, the concordant/discordant monozygotic (MZ) twin design. To assess the influence of environmental risk factors, neuroimaging results can be compared in MZ twin pairs strongly discordant for attention problems or ADHD. In these pairs, one twin scores very high, whereas the co-twin scores very low on ADHD symptoms. Because monozygotic twins are (nearly) always 100% identical at the DNA sequence level (Boomsma et al., 2002a), the discordance at the phenotypic level must arise from differential exposure to environmental influences. Differences in brain structure/function between the high-risk twin and the low-risk co-twin, therefore, also reflect environmental effects on the brain, including epigenetic effects, rather than effects of variation in DNA sequence. To maximize detection of the effects of genetic risk factors, neuroimaging results can be compared in twins that both score very high on symptoms of ADHD with twins that both score very low on symptoms of ADHD. These concordant high and low scoring twins are highly likely to come from families with either high or low vulnerability for ADHD. Because an influence of shared family environment on ADHD symptoms has hardly ever been found, whereas heritability is often over 80% (Rietveld et al., 2003), this familial vulnerability translates almost entirely to genetic vulnerability. Therefore, differences between the groups of low and high concordant twins are expected to highlight brain changes related to the genetically mediated risk for ADHD sequence.
In a previous study by our group we applied the concordant/discordant monozygotic twin design to study structural deviations in the brains of subjects with a genetic etiology of ADHD and in subjects with an environmental etiology of ADHD (van ’t Ent et al., 2007). The results from this study indicated that attention problems are associated with anatomical abnormalities of an action-attentional network including cerebellar, occipital/parietal and temporal brain regions interacting with the prefrontal cortex. This network appeared to be compromised at different brain areas for genetically and environmentally driven attentional problems, especially within the prefrontal lobes. In concordant high risk twins, there was volume loss in orbitofrontal brain areas, and a compromised posterior corpus callosum. In the high-risk twins from discordant twin-pairs, there was reduced volume in the right inferior dorsolateral prefrontal cortex.
In the present study we used the MZ concordant/discordant twin design (Lehn et al., 2007) to detect deviant functional brain activation that is specifically related to either genetic or environmental risk factors for ADHD. We recorded the fMRI BOLD (blood oxygen level dependent) signal during two different tasks that both probe selective attention and inhibitory control; the Stroop color-word task (Stroop, 1935) and a modified version of the Eriksen flanker task (Eriksen and Eriksen, 1974). We compared fMRI recordings of MZ pairs selected from the Netherlands Twin Register to be concordant high or low or discordant high-low for longitudinal parental ratings on the Child Behavior Checklist Attention/hyperactivity Problem scale (CBCL4/18: (Achenbach et al., 1991; Verhulst et al., 1996)). The CBCL is a widely used tool for the assessment of childhood behavioral abnormalities and correlates well with the clinical DSM-IV (Diagnostic and Statistical Manual of Mental Disorders-4th edition: (American Psychiatric Association, 1994)) assessment of Attention Deficit Hyperactivity Disorder (ADHD) (Derks et al., 2006). MZ pairs selected to be highly concordant for parental ratings on the CBCL, either at the high or at the low end of the CBCL Attention Problems (CBCL-AP) scale are considered to represent a genetic contrast. MZ twin pairs in which one twin scores high and the other low on the CBCL-AP scale are considered to represent an environmental contrast.
EXPERIMENTAL PROCEDURES
Participants
The subjects were Dutch twins from the Netherlands Twin Register whose parents take part in a longitudinal study designed to examine genetic and environmental influences on the development of behavioral and emotional problems in twins from birth onwards (NTR: (Boomsma et al., 2002b)). Surveys are sent to the parents when the twins are 1, 2, 3, 5, 7, 10, and 12 years of age. The twins included in the present study were born between 1986 and 1993 and selected on basis of the maternal Child Behavior Checklist (Achenbach et al., 1991) ratings collected at the ages 7, 10, and 12 years. We considered only twin pairs whose mothers had completed the CBCL at ages 7, 10 , and/or 12 years at least at two time-points (n = 4877) and who were classified as monozygotic (MZ) (n = 1803 pairs).
Each child was classified as either at high risk or low risk for ADHD based on his/her standardized CBCL-AP T-scores (mean = 50, SD = 10) at ages 7, 10, and 12. T-scores were calculated separately for boys and girls. High risk children had a T- score above 60 at all available time-points and a T-score above 65 at least once. Low risk children had a T-score below 55 at all available time-points. Prior research by our group and others have shown this to be a sensitive and specific technique to identify children at risk for clinical ADHD (Chen et al., 1994; Hudziak et al., 2004; Derks et al., 2006; Lehn et al., 2007). Using the CBCL-AP data we identified twin pairs who were concordant high (both twins high CBCL-AP scores), concordant low (both twins low CBCL-AP scores) and discordant (one twin high and co-twin low CBCL-AP score).
Twenty-seven monozygotic (MZ) twin pairs participated in the study. The selection of twin pairs was done at two time points. The first selection of twin pairs consisted of participants for a structural MRI study (n = 25: for a detailed description see (van ’t Ent et al., 2007)). In this sample of twins, born between 1986 and 1991, functional MRI data during a Stroop and flanker task were also collected for 3 concordant AP high, 10 concordant AP low and 5 AP discordant MZ pairs. At the second selection, the sample was extended with concordant AP high and discordant AP twin pairs. There were 23 pairs from the birth cohorts 1992-1993 who met the inclusion criteria on basis of the Maternal CBCL-AP. Twins were excluded with chronic medical or neurological disorders (n = 1) and mental disabilities (n = 4), leaving 18 twin pairs to be invited. The families of 9 twin pairs (5 concordant high, 4 discordant) took part in the MRI experiments. Non-participants included families who could not be contacted (n = 3), declined (n = 3), or whose twins had orthodontic braces (n = 3).
The total sample included 8 concordant high, 10 concordant low and 9 discordant twin pairs. The MZ status of all twin pairs was confirmed based on DNA zygosity testing of 15 genetic markers. Four individuals of the concordant high sample (twin and co-twin of one pair, and 2 twins from different pairs), and two twins of the concordant low sample (twin and co-twin of one pair) reported mild dyslexia. However these twins had no problems with reading single color words and showed normal Stroop task, as well as flanker task, performance. To assess DSM-IV diagnosis of ADHD, all mothers of the twins completed a telephone interview based on the Dutch version of the DISC-IV Parent Version (DISC-IV-P: (Shaffer et al., 1993)). In our final population, 4 twins from the concordant high-risk group (twin and co-twin of one pair and 2 twins from different pairs) and 2 twins from the discordant group met clinical criteria for ADHD diagnosis. For the twin and co-twin of the concordant high-risk sample that both met the ADHD criteria, the mother reported that the children had been diagnosed previously with PDD-NOS as well as Charcot-Marie-Tooth Disorder. Post hoc tests indicated that selective exclusion the twins with mild dyslexia or previously diagnosed of PDD-NOS did not significantly affect the results of the present study. All twins and their parents provided written informed consent. The study was approved by the university ethical review board.
Task paradigms
In the Stroop task subjects had to report the ink color of written color words. The stimuli consisted of Dutch translations of the words ‘red’, ‘yellow’, ‘blue’ and ‘green’ and could be written in either of these four colors. Word meaning could be either congruent (e.g. the word ‘red’ written in red) or incongruent (e.g. the word ‘blue’ written in red) with ink color A left index finger button press was required after ink colors red or yellow, and a right index finger button press after ink colors blue or green. The task was administered in an event-related design and split into six consecutive sessions separated by small breaks during which the subject was asked to lie still inside the scanner. In each session 12 congruent and 12 incongruent trials were presented in random order. Stimuli were shown for 2000 ms and the interstimulus interval consisted of a period of black screen after each stimulus (randomized between 1050 – 3050 ms) and a subsequent fixation cross for 950 ms before the next stimulus. Stimulus order was randomized for each run.
In the flanker task subjects had to indicate, as quickly as possible, the direction of a central target arrow (i.e., ‘<’ left hand press; ‘>’ right hand press) which was surrounded by four task irrelevant flankers of the same size and shape. The direction of the flanker arrows could be either congruent (‘> > > > >’ or ‘< < < < <’) or incongruent (‘< < > < <’ or ‘ > > < > >’) to the direction of the central target arrow. Flankers and targets were displayed simultaneously. The complete experimental setup including stimulus presentation times, interstimulus interval and ratio of incongruent to congruent trials was the same as for the Stroop paradigm. Before the scan sessions, subjects practised both the Stroop and flanker task with a maximum of six trials. On average subjects were accustomed to each task after two or three stimuli. Inside the scanner, stimuli were back-projected onto a screen that subjects viewed through a mirror mounted on the MRI head coil. Single characters of the stimuli in both tasks subtended 1.1° in height and 0.9° in width. Character spacing was 0.16°.
Image acquisition
The MRI protocol consisted of a structural and functional scanning part and took about 60 minutes in total for each individual (30 minutes sMRI and 30 minutes fMRI). First, 3 separate whole head anatomical scans were consecutively acquired for each twin, with randomized scan order of the twins. Subsequently functional scanning during both tasks was performed, starting with the twin that had first entered the scanner for structural MRI measurement. Task order (Stroop followed by flanker or flanker followed by Stroop) was the same within twin pairs, but counterbalanced between twin pairs. During each individual scan session the twins remained inside the scanner and were asked to minimize head movement.
Magnetic resonance imaging of the brain was performed on a 1.5 T Sonata MR system (Siemens, Erlangen, Germany) with a standard circularly polarized head coil. Anatomical scans included 160 sagittal slices at 1 mm intervals acquired with a 3D gradient-echo T1-weighted sequence (flip angle 15°; Repetition Time, TR = 1900 ms; Echo Time, TE = 3.93 ms; Inversion Time, TI = 1100 ms). In plane resolution was 256 × 224 pixels (pixel size 1 mm2), gray level resolution was 16 bit. For fMRI, Echo Planar Images (EPI) sensitive to blood oxygen level dependent (BOLD) effects were obtained (flip angle = 90°, Repetition Time, TR = 2000 ms; Echo Time, TE = 60 ms; Field of View: 200 × 200 mm, Bandwidth 888 hz/pixel, Echo Spacing 1.22 ms). For both reaction tasks, each of the 6 individual sessions consisted of 70 volumes of 20 axial slices (Slice Thickness = 5 mm; Interslice Gap 1 mm; In-plane Resolution: 3.125 × 3.125 mm). The first 2 EPI volumes for every session were discarded to allow for magnetic saturation.
Analysis of behavioral data
Analysis of task performance was performed in SPSS (SPSS Inc, Chicago, Illinois) using repeated measures ANOVA to correct for the dependency of twin data. For the concordant twin samples, the possibility of within-twin pair correlations of reaction performance was taken into account by defining a variable ‘group’ (group1 versus group2) as a within-twin pair factor, with one twin of each concordant pair randomly assigned to group1 and the co-twin to group2. Differences related to AP were modeled by using the variable ‘twin AP status’ (twins high on the CBCL-AP scale versus twins low on the CBCL-AP scale) as a between-twin pair factor. For the discordant pairs, ‘twin AP status’ (high CBCL-AP twin versus low CBCL-AP co-twin) was used as a within-twin pair factor. Variables ‘selection time point’ (twin pairs scanned at the first selection time-point versus twin pairs scanned at the second selection time-point) and ‘sex’ of the twins were included as additional between-pair covariates. A significance level of p < 0.05 was applied throughout.
fMRI analysis
fMRI data were analyzed using SPM5 (Wellcome Department of Imaging Neuroscience, London, UK). EPI scans were slice time corrected, realigned and normalized to the standard MNI (Montreal Neurological Institute) brain in SPM. Subsequently, data were resliced to 3×3×3-mm voxels and spatially smoothed using an 8-mm isotropic Gaussian kernel. After high-pass filtering (cut-off 128 seconds), functional scans were analyzed in the context of the general linear model using delta functions convolved with a canonical hemodynamic response function. Head-movement parameters were modeled as regressors of no interest. Post-hoc analysis of subject motion during the scans, based on the functional scan realignment parameters, indicated that the twins with high risk for ADHD did not exhibit significantly larger head movement compared to the low risk twins. For each subject and task, contrasts images were computed for simple main effects of congruent and incongruent trials, as well as the effect of response interference (incongruent minus congruent trials). For all contrasts, only trials with correct reactions were included. Contrast images for interference were fed into second-level (random effects) analyses for assessment of AP-related differences using repeated measures ANOVA. Similar to the analysis of behavioral data, to account for within-twin pair correlations of fMRI, a within-twin pair variable ‘group’ was defined. For AP concordant pairs, twins were randomly assigned to group1 and group2 and variable ‘twin AP status’ was used as a between-twin pair factor. For the discordant samples, high-risk twins were assigned to group1 and the low-risk co-twins to group2 such that ‘twin AP status’ represented a within-twin pair factor. Variables ‘selection time point’ and ‘sex’ were included as between-pair covariates. For main effects across twins of selected contrasts we set an individual voxel threshold of p < 0.05, corrected for multiple comparisons (False Discovery Rate: FDR), with a minimal cluster extent of 25 voxels. Group differences, masked with the appropriate main effect (mask thresholded at p < 0.05, uncorrected), are reported at an uncorrected individual voxel threshold of p < 0.001.
RESULTS
Demographics and mean CBCL-AP T-scores of the sample are summarized in Table 1. In line with our selection criterion, CBCL-AP T-scores were significantly higher for concordant CBCL-AP high compared to concordant CBCL-AP low twin samples (F(1,16) = 227.4, p < 0.001), as well as for the discordant CBCL-AP high twins relative to their CBCL-AP low scoring co-twins (F(1,8) = 67.1, p < 0.001). Table 1 also shows mean scores of DSM-Oriented scales for comorbid Anxiety problems, Oppositional Defiant problems and Conduct problems as well as mean birth weight. DSM-Oriented scores refer to composite scores on selected items from the CBCL4/18 inventory that are consistent with DSM-IV categories (Achenbach et al., 2003). The concordant CBCL-AP high sample exhibited higher scores, relative to the concordant low twins, on Anxiety problems (F(1,16) = 24.1, p < 0.001), Oppositional Defiant problems (F(1,16) = 39.1, p < 0.001) and Conduct problems (F(1,16) = 35.9, p < 0.001). CBCL-AP high twins from discordant pairs scored higher than their CBCL-AP low co-twins on Anxiety (F(1,8) = 10.5, p = 0.012), but not on Oppositional Defiant problems (F(1,8) = 1.2, p = 0.306) or Conduct problems (F(1,8) = 0.1, p = 0.809). Birth weight was significantly lower for CBCL-AP high twins from discordant pairs compared to their CBCL-AP low co-twins (F(1,8) = 9.2, p = 0.016). No difference in birth weight was seen for concordant CBCL-AP high compared to concordant CBCL-AP low twins (F(1,16) = 1.7, p = 0.205).
TABLE 1. Twin sample demographics.
AP status: attention/hyperactivity status of twin pair; Twin pairs: number of female (F) and male (M) twin pairs; Age: age at time of MRI exam (in years); Mean AP T-score: mean CBCL-AP T-scores; Anxiety problems T-score: mean DSM-Oriented Anxiety problems T-scores; Oppositional Defiant problems T-score: mean DSM-Oriented Oppositional Defiant problems T-scores; Conduct problems T-score: mean DSM-Oriented Conduct problems T-scores. DSM-Oriented scales are based on CBCL4/18 items very consistent with the relevant DSM-IV category (Achenbach et al., 2003). All mean scores are across 2 or 3 time points (7, 10 and 12 years), and computed separately for boys and girls. Birth weight: birth weight of each twin in grams. Data separated by a forward slash refer to first and second born twins for concordant high and low risk twin pairs, and to the high versus low risk co-twin for the discordant pairs.
| AP status | Twin pairs | Age | Mean CBCL-AP T-score | Anxiety problems T-score | Oppositional Defiant problems T-score | Conduct problems T-score | Birth weight | |
|---|---|---|---|---|---|---|---|---|
| Concordant high | 6F / 2M | mean | 15.35 | 74.16 / 79.93 | 57.09 / 61.87 | 63.41 / 61.63 | 54.57 / 52.62 | 2547 / 2374 |
| st. dev | 1.57 | 7.62 / 6.93 | 8.72 / 11.02 | 10.30 / 10.12 | 5.02 / 3.56 | 523 / 428 | ||
| Concordant low | 4F / 6M | mean | 15.40 | 42.93 / 41.63 | 46.62 / 44.02 | 41.95 / 43.63 | 45.22 / 45.19 | 2642 / 2603 |
| st. dev | 1.29 | 3.50 / 2.86 | 5.08 / 2.53 | 2.66 / 4.30 | 2.15 / 1.94 | 553 / 384 | ||
| Discordant | 7F / 2M | mean | 14.76 | 72.53 / 46.64 | 60.70 / 48.98 | 56.54 / 51.60 | 55.51 / 54.34 | 1968 / 2489 |
| st. dev | 1.48 | 7.77 / 4.45 | 11.41 / 7.48 | 10.39 / 12.21 | 8.26 / 14.01 | 604 / 466 | ||
Task Performance
Reaction times, across all individuals, for both the Stroop and flanker task were significantly delayed after incongruent compared to congruent stimuli [Stroop: incongruent 659.1 ± 203.4 ms vs. congruent 597.4 ± 153.9 ms, F(53,1) = 47.5, p < 0.001; flanker: incongruent 611.5 ± 131.4 ms vs. congruent 509.2 ± 107.3 ms, F(53,1) = 327.4, p < 0.001]. In addition, for both tasks, percentages of trials with correct reactions were significantly reduced after incongruent stimuli (Stroop: incongruent 95.6 ± 4.9 vs. congruent 96.6 ± 4.3, F(35,1) = 5.1, p = 0.028; Flanker: incongruent 95.8 ± 3.9 vs. congruent 99.2 ± 2.6, F(35,1) = 65.6, p < 0.001].
Effects of Stroop and flanker interference on reaction performance were quantified by computing differences in reaction times and reaction accuracy between incongruent and congruent stimulus trials. Consistent with previous findings in a larger sample (Stins et al., 2005), the interference effects on reaction time for the Stroop and flanker task were not significantly correlated (Pearson Correlation = 0.21, p = 0.13). Response interference effects are displayed separately for the different cells of our twin design in table 2. Results from statistical tests on AP-related differences for the concordant and discordant twin samples (F and p-values) are also listed. The effect of response interference on reaction times was not significantly different between twins with high and low AP scores. For percentage of correct responses, a larger effect of response interference was found in concordant high risk relative to concordant low risk twins during the flanker task.
TABLE 2. Response interference effects on task performanc.
Effects of information conflict on Stroop task (left) and flanker task (right) behavior, measured by computing differences in reaction times (top rows) and correct reaction rates (bottom rows) on incongruent relative to congruent stimulus trials. Columns ‘F’ and ‘p’ indicate results from statistical tests on AP-related differences between selected concordant or discordant twin samples. Degrees of freedom for the listed ‘F’ values are (1,14) and (1,6) for concordant and discordant twin comparisons, respectively. Asterisk indicates statistically significant difference.
| Stroop incongruent-congruent | flanker incongruent-congruent | ||||||||
|---|---|---|---|---|---|---|---|---|---|
| measure | sample | CBCL-AP high | CBCL-AP low | F | p | CBCL-AP high | CBCL-AP low | F | p |
| Reaction time | Concordant | 66.27 ± 54.04 | 48.80 ± 58.91 | 0.54 | 0.476 | 128.98 ± 55.23 | 86.07 ± 23.34 | 0.09 | 0.769 |
| Discordant | 59.98 ± 62.88 | 83.82 ± 99.68 | 1.02 | 0.351 | 94.24 ± 29.05 | 99.02 ± 27.50 | 0.00 | 0.966 | |
| Percentage correct | Concordant | -0.69 ± 3.13 | -0.76 ± 3.59 | 0.17 | 0.689 | -4.17 ± 4.09 | -2.71 ± 2.32 | 6.28 | 0.025* |
| Discordant | -3.09 ± 3.92 | -0.15 ± 2.02 | 1.09 | 0.337 | -3.40 ± 2.87 | -3.24 ± 2.50 | 0.35 | 0.576 | |
fMRI results
Main effects
Figure 1 shows brain areas with significant fMRI BOLD activations, across all participants, during performance of the Stroop task (left panels) and flanker task (right panels). Significant clusters for the different fMRI contrasts are also summarized in tables 3 and 4. The first two rows of figure 1 and first two columns of tables 3 and 4 illustrate brain areas with significant fMRI BOLD signal on congruent and incongruent stimulus trials. Brain areas activated during the Stroop and flanker task were highly similar. Task related activation was found in subcortical brain areas (thalamus and putamen), cortical regions related to sensory and motor processing (occipital/temporal junction, cerebellum, motor cortex and supplementary motor area) and brain regions involved in higher cognitive processing, including the parietal cortex, insula/claustrum region and anterior cingulate. For the Stroop task there was also evidence for activation of left and right frontopolar areas. For the flanker task frontopolar activation was found only in the left hemisphere after incongruent stimuli.
Figure 1.

Main effects of fMRI BOLD activation, across all participating twins, during Stroop task (left) and flanker task (right) performance. Significant clusters found after applying the congruent, incongruent, and interference (incongruent-congruent) contrasts are displayed from top to bottom. For each task and contrast, maximal intensity projections indicate voxels with statistical significance p < 0.05 (FDR corrected and minimal cluster extent 25 voxels). Areas of significant activation are also overlayed on average structural MR sections, computed across all twins, with t-values mapped by the color bar. To facilitate comparisons, the location of the MRI slices is kept fixed and centered at MNI coordinates x = 0, y = 6, z = 30 (also indicated by the red cross in the maximal intensity projections).
TABLE 3. Brain regions active during performance of the Stroop task.
Anatomical locations of significant clusters for main effects of fMRI BOLD activations during the Stroop task, for simple congruent, incongruent contrasts and interference (incongruent-congruent). MNI coordinates and Z score are listed for the voxels with largest effect size. Dorsolateral PFC = dorsolateral prefrontal cortex.
| congruent | incongruent | interference (incongruent-congruent) | |||||||||||
|---|---|---|---|---|---|---|---|---|---|---|---|---|---|
| Anatomical location | side | MNI coord’s |
Z score | MNI coord’s |
Z score | MNI coord’s |
Z score | ||||||
| x | y | z | x | y | z | x | y | z | |||||
| Cerebellum | L | -30 | -48 | -21 | 7.47 | -30 | -48 | -21 | 7.80 | -27 | -63 | -30 | 2.98 |
| M | 0 | -60 | -18 | 6.55 | 0 | -60 | -18 | 6.87 | -6 | -69 | -27 | 3.51 | |
| R | 30 | -54 | -27 | 5.94 | 21 | -48 | -24 | 6.60 | 33 | -57 | -24 | 3.51 | |
| Occipital/Temporal | L | -30 | -90 | -3 | Inf. | -30 | -90 | -3 | Inf. | -33 | -54 | -15 | 4.41 |
| R | 42 | -72 | -9 | 7.35 | 42 | -72 | -9 | Inf. | 42 | -60 | -6 | 4.25 | |
| Cuneus | L | -15 | -69 | 6 | 5.04 | ||||||||
| R | 6 | -84 | 9 | 5.18 | |||||||||
| Parietal | L | -30 | -30 | 48 | 5.48 | -33 | -63 | 42 | 6.08 | -33 | -54 | 55 | 4.56 |
| R | 33 | -42 | 42 | 7.26 | 42 | -42 | 48 | 7.19 | 33 | -57 | 54 | 6.32 | |
| Motor Cortex | L | -39 | -18 | 54 | 4.88 | -39 | -18 | 54 | 5.22 | ||||
| R | 39 | -15 | 60 | 5.34 | 39 | -15 | 60 | 5.68 | |||||
| SMA | L | -12 | -12 | 51 | 6.52 | -12 | -12 | 51 | 7.12 | -6 | 3 | 57 | 4.14 |
| R | 6 | -3 | 57 | 7.47 | 6 | -3 | 54 | 7.71 | 3 | 9 | 54 | 4.12 | |
| Anterior Cingulate | L | -9 | 12 | 36 | 6.94 | -6 | 9 | 45 | 7.53 | -6 | 18 | 36 | 4.20 |
| R | 9 | 3 | 42 | 7.00 | 9 | 3 | 42 | 7.07 | 9 | 18 | 39 | 3.70 | |
| Thalamus | L | -9 | -18 | 3 | 4.75 | -9 | -18 | 3 | 5.63 | ||||
| R | 12 | -18 | 3 | 5.28 | 12 | -18 | 3 | 6.10 | |||||
| Putamen | L | -27 | 0 | 6 | 6.36 | -24 | 0 | 9 | 6.71 | ||||
| R | 27 | 3 | 0 | 7.06 | 27 | 6 | 0 | 7.30 | |||||
| Insula/Claustrum | L | -42 | 0 | 12 | 6.57 | -33 | 12 | 9 | 6.92 | -39 | 15 | 3 | 3.41 |
| R | 36 | -3 | 12 | 7.53 | 33 | 15 | 6 | Inf. | 39 | 15 | 0 | 2.80 | |
| Inferior Frontal Gyrus | L | -45 | 27 | 3 | 3.62 | ||||||||
| R | 45 | 15 | 6 | 3.28 | |||||||||
| dorsolateral PFC | L | -54 | 9 | 36 | 4.50 | ||||||||
| R | 48 | 6 | 30 | 6.06 | |||||||||
| Frontopolar | L | -33 | 39 | 21 | 3.49 | -33 | 42 | 18 | 3.69 | ||||
| R | 36 | 36 | 24 | 4.05 | 33 | 33 | 21 | 4.60 | |||||
TABLE 4. Brain regions active during performance of the flanker task.
Anatomical locations of significant clusters for main effects of fMRI BOLD activation during the flanker task.
| congruent | incongruent | interference (incongruent-congruent) | |||||||||||
|---|---|---|---|---|---|---|---|---|---|---|---|---|---|
| Anatomical location | side | MNI coord’s |
Z score | MNI coord’s |
Z score | MNI coord’s |
Z score | ||||||
| x | y | z | x | y | z | x | y | z | |||||
| Cerebellum | L | -30 | -45 | -24 | 4.03 | -27 | -48 | -27 | 4.71 | -39 | -57 | -27 | 3.42 |
| M | -3 | -51 | -15 | 5.24 | 6 | -45 | -15 | 6.13 | 12 | -72 | -27 | 3.78 | |
| R | 36 | -51 | -30 | 5.58 | 33 | -51 | -30 | 6.21 | 30 | -69 | -27 | 3.62 | |
| Occipital/Temporal | L | -27 | -90 | 0 | Inf. | -27 | -90 | 0 | Inf. | -36 | -84 | 3 | 7.05 |
| R | 33 | -81 | -9 | 6.92 | 45 | -69 | -9 | Inf. | 33 | -81 | 3 | 5.10 | |
| Cuneus | L | ||||||||||||
| R | |||||||||||||
| Parietal | L | -39 | -30 | 51 | 5.59 | -42 | -33 | 48 | 6.51 | -30 | -72 | 39 | 7.00 |
| R | 45 | -36 | 42 | 6.14 | 33 | -42 | 45 | 7.18 | 24 | -69 | 33 | 6.62 | |
| Motor Cortex | L | -36 | -18 | 51 | 5.07 | -36 | -18 | 51 | 5.30 | ||||
| R | 39 | -18 | 57 | 4.39 | 33 | -15 | 60 | 5.09 | |||||
| SMA | L | -6 | 0 | 51 | 5.34 | -6 | 0 | 51 | 6.37 | -3 | 3 | 56 | 3.60 |
| R | 6 | -3 | 51 | 6.05 | 6 | 0 | 52 | 6.60 | 9 | 3 | 57 | 3.80 | |
| Anterior Cingulate | L | -9 | 9 | 39 | 5.49 | -9 | 12 | 39 | 6.76 | -1 | 15 | 51 | 5.03 |
| R | 9 | 3 | 42 | 6.02 | 9 | 0 | 48 | 6.77 | 9 | 9 | 51 | 5.01 | |
| Thalamus | L | -15 | -15 | 6 | 3.07 | -15 | -9 | 3 | 2.97 | -12 | -12 | 0 | 3.71 |
| R | 15 | -15 | 6 | 3.98 | 15 | -12 | 3 | 5.25 | 18 | -9 | 12 | 2.93 | |
| Putamen | L | -24 | 9 | 9 | 5.81 | -30 | 3 | 0 | 6.47 | ||||
| R | 27 | 3 | 3 | 5.61 | 27 | 3 | 3 | 6.77 | |||||
| Insula/Claustrum | L | -39 | 0 | 9 | 6.23 | -36 | 0 | 9 | 7.12 | -36 | 21 | 3 | 4.01 |
| R | 42 | 0 | 9 | 6.27 | 39 | -3 | 15 | 7.19 | 33 | 15 | 9 | 4.80 | |
| Inferior Frontal Gyrus | L | -51 | 21 | 0 | 3.00 | ||||||||
| R | 48 | 18 | -2 | 3.36 | |||||||||
| dorsolateral PFC | L | -45 | 6 | 30 | 5.64 | ||||||||
| R | 36 | -9 | 36 | 5.31 | |||||||||
| Frontopolar | L | -33 | 39 | 24 | 4.09 | -33 | 39 | 24 | 3.49 | ||||
| R | |||||||||||||
Brain areas that showed increased fMRI BOLD signal on incongruent trials compared to congruent trials, reflecting enhanced activation to response interference, can be appreciated from the ‘interference: (incongruent-congruent)’ contrast. Results for this contrast are illustrated in the third row of figure 1 and third column of tables 3 and 4. Response interference was associated with enhanced activation of the cerebellum, left and right occipitotemporal, insula/claustrum and parietal cortices as well as several frontal lobe regions including the left and right supplementary motor area (SMA), anterior cingulate cortex (ACC), inferior frontal gyrus (IFG) and dorsolateral prefrontal cortex (dlPFC). For the Stroop task, increased activation was also noted in the left and right cuneus. For the flanker task additional clusters were observed in left and right thalamus and a left frontopolar region.
Genetic risk: High versus low risk twins from concordant pairs
Table 5 and left panels of fig. 2, show clusters of AP-related differences for brain activation to response interference between the concordant high and concordant low twin pairs. Compared to low risk twins from concordant pairs, decreased activation to response interference was found in high risk twins from concordant pairs, but located in different brain regions for the Stroop and flanker task. For the Stroop task, a single cluster of decreased activation was found in the left dorsolateral prefrontal cortex. For the flanker task hypoactivation was restricted to the right parietal cortex.
TABLE 5. Brain activation differences in concordant MZ twin pairs.
Differences in brain activation to trials with information conflict in concordant high compared to low risk twins. Test: test for significant hypo- or hyperactivation in twins high or low on the CBCL-AP scale; Location: anatomical location; MNI coord’s: MNI coordinates for voxel with largest effect size; Z score: Z score of voxel with largest effect size. dlPFC = dorsolateral prefrontal cortex.
| Twins with high versus twins with low CBCL-AP scores | ||||||||||
|---|---|---|---|---|---|---|---|---|---|---|
| Stroop | flanker | |||||||||
| Test | Location | MNI coord’s | Z score | Location | MNI coord’s | Z score | ||||
| x | y | z | x | y | z | |||||
| high < low | L. dlPFC | -39 | 33 | 18 | 3.38 | R. Parietal | 60 | -48 | 36 | 3.42 |
| R. Parietal | 54 | -48 | 39 | 3.15 | ||||||
| high > low | L. Thalamus | -9 | -24 | 15 | 3.16 | L. Premotor | -21 | -9 | 57 | 3.15 |
Figure 2.
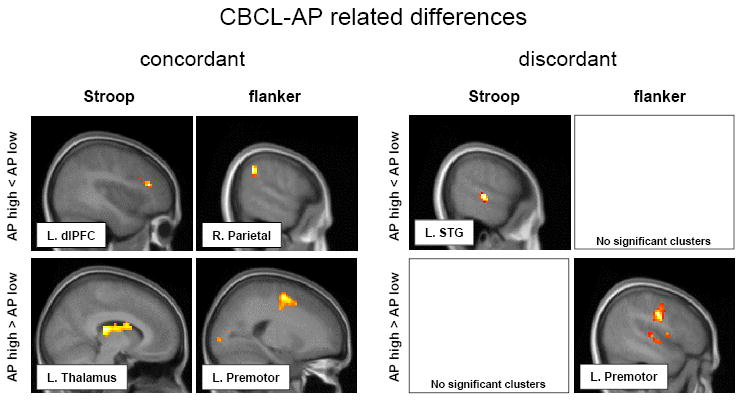
Most significant clusters, overlayed on MR sections, from statistical evaluations of CBCL-AP related differences in brain activation to Stroop and flanker trials with response interference. Left panels: hypoactivations (top row) and hyperactivations (bottom) for concordant high compared to low risk twins (genetic contrast). Right panels: hypo- and hyperactivations activation in discordant high risk twins relative to their low risk co-twins (environmental contrast). For display only, a lower statistical threshold (p < .05; uncorr.) is used. MNI coordinates and Z scores for voxel with maximum effect of each depicted cluster are listed in tables 5 and 6, respectively. dlPFC = dorsolateral prefrontal cortex; STG = superior temporal gyrus.
High-risk twins from concordant pairs showed increased activation to Stroop interference in a region overlying the caudal part of the left thalamus, including mainly the left pulvinar and extending rostrally to include the left posterior caudate body. For flanker interference, a single cluster of increased activation in high risk twins was located in the left premotor cortex.
Environmental risk: high- versus low-risk twins from discordant pairs
Paired comparisons between the high-risk twin and the low-risk co-twin from discordant pairs revealed significant clusters of decreased activation to response interference only for the Stroop task (table 6 and fig. 2: right panels). High-risk twins from discordant pairs showed relatively reduced activity in regions of the left and right superior temporal gyrus, right fusiform gyrus and right precuneus.
TABLE 6. Brain activation differences in discordant MZ twin pairs.
Differences in brain activation to information conflict in discordant high compared to low risk twins. STG = superior temporal gyrus; FFG = fusiform gyrus; ACC = anterior cingulate cortex; MFG = middle frontal gyrus.
| Twin with high versus co-twin with low CBCL-AP scores | ||||||||||
|---|---|---|---|---|---|---|---|---|---|---|
| Stroop | flanker | |||||||||
| Test | Location | MNI coord’s | Z score | Location | MNI coord’s | Z score | ||||
| x | y | z | x | y | z | |||||
| high < low | L. STG | -60 | -24 | 0 | 4.02 | No significant clusters | ||||
| R. STG | 63 | -45 | 6 | 3.63 | ||||||
| R. FFG | 36 | -42 | -21 | 3.54 | ||||||
| R. precuneus | 6 | -36 | 45 | 3.17 | ||||||
| high > low | No significant clusters | L. Premotor | -48 | -12 | 33 | 3.95 | ||||
| ACC | 3 | 33 | 0 | 3.74 | ||||||
| R. Premotor | 42 | -9 | 33 | 3.48 | ||||||
| R. MFG | 9 | 54 | -3 | 3.14 | ||||||
High risk discordant twins also had areas of increased activation during response interference, but exclusively in the flanker task. Similar to findings in concordant high risk twins, one cluster was located in the left premotor cortex. In addition there was evidence for increased activation in the right premotor cortex, right middle frontal gyrus and anterior cingulate.
DISCUSSION
To examine functional brain changes related to genetic and environmentally mediated risk for ADHD, we measured functional MRI during performance of the Stroop and flanker tasks in genetically identical twins concordant or discordant for CBCL-AP attention and hyperactivity problem scores. High-risk concordant twin pairs are considered at higher genetic risk for ADHD than low-risk concordant twin pairs, while high-risk twins from discordant pairs are considered at higher environmental risk for ADHD than their low-risk co-twins (Castellanos et al., 2003; van ’t Ent et al., 2007).
Analysis of task-related behavior indicated classical effects of response interference on reaction times and response accuracy for both the Stroop and flanker task. There was only marginal evidence for enhanced interference in children who were rated high on the CBCL-AP scale compared to children who were rated low on the CBCL-AP scale. That is, for the flanker task the negative effect of information conflict on reaction accuracy was significantly larger for high-risk twins from concordant pairs. Performance deficits in executive functioning for individuals with ADHD have been observed in several previous studies (for overviews see e.g., (Sergeant et al., 2002; Doyle, 2006) including different versions of the Stroop task (Homack and Riccio, 2004) and flanker task (Mullane et al., 2008). However, a recent meta-analysis by van Mourik et al. did not confirm the presence of impaired Stroop interference in ADHD patients (van Mourik et al., 2005). There may be several reasons for inconsistent findings with regard to task performance such as differences in task instructions, performance measures or the format of the experimental task. For example, with regard to the Stroop task, Lansbergen et al. (Lansbergen et al., 2007) concluded from a recent meta-analysis that Stroop performance is more reliably affected in ADHD subjects when time based measures such as reaction time per item are used (although this disagrees with our findings) but also indicated more consistent behavioral impairment when the task is administered using a computerized version, instead of a set of cards.
The fMRI main effects of our study, across a large number of subjects (54 twins in total), at the same time of day for every individual and on the same scanner with the same scanning parameters, indicated that highly similar brain processes were active during Stroop and flanker task performance. CBCL-AP status clearly affected this brain activation such that high-risk twins from concordant and discordant pairs generally showed decreased activation during response interference compared to low-risk twins in frontal, parietal and temporal brain regions. Involvement of these brain areas generally corresponds with earlier functional imaging studies of ADHD, both with regard to hypofrontality (Bush et al., 2005; Dickstein et al., 2006; Rubia et al., 2008; Smith et al., 2008), and reduced parietal and temporal brain activation (Vaidya et al., 2005; Vance et al., 2007; Cao et al., 2008).
Genetic contrast
Relative to concordant low-risk twins, concordant high-risk twins showed hypoactivation to response interference in the left dorsolateral prefrontal cortex (dlPFC) for the Stroop task and right parietal cortex for the flanker task. Reduced prefrontal cortex activation during a Stroop-like paradigm has also been found in boys with ADHD (Zang et al., 2005), in combination with hypoactivation of the anterior cingulate cortex (ACC). In addition, Bush et al., (Bush et al., 1999) reported hypofrontality in adult ADHD patients during a counting Stroop, but their main focus was on the ACC. Reduced parietal cortex activation during the flanker task is in line with a study by Vaidya et al. (Vaidya et al., 2005) that found a reduction in frontal-striatal-temporal-parietal network engagement in ADHD children during flanker interference suppression. Konrad et al. (Konrad et al., 2006) also reported reduced brain activation in ADHD children during a modified flanker task, but restricted to frontostriatal brain regions.
Our results are only in partial agreement with results of family based studies by Durston and Mulder and colleagues (Durston et al., 2006; Mulder et al., 2008) to chart the effects of genetic vulnerability to ADHD on functional brain activation. In these studies that applied fMRI during a go no-go paradigm it was found that familial risk for ADHD was associated with hypoactivation on no-go trials in ventral prefrontal and inferior parietal cortical regions (Durston et al., 2006) and anterior cingulate cortex (Mulder et al., 2008). Durston et al. (Durston et al., 2008) also recently showed that the DAT1 dopamine transporter genotype interacts with the familiar risk of ADHD to influence activation of the striatum during this task. The present findings do not provide similar evidence for genetic impairment of the striatum or more medial-ventral regions of the frontal brain such as the ACC and inferior prefrontal cortex. This fits however with the notion that impairment of frontostriatal networks in ADHD is evident more consistently during tasks with specific emphasis on motor inhibition, such as the go no-go task (Booth et al., 2005; Smith et al., 2006).
The discrepancy between activation differences observed for the present Stroop and flanker tasks is somewhat surprising given the high correspondence between brain activation in response to the two tasks (see figure 1). However, the Stroop task may be more sensitive to AP-related effects on prefrontal brain areas than the flanker task. Correct Stroop performance seems to require a higher level of prefrontal brain involvement, as is supported by the fact that we found more consistent evidence for involvement of frontopolar brain regions during the Stroop task. Conversely, the flanker task may be more sensitive to AP related effects on parietal activation. This agrees with recent studies that measured the electroencephalogram (EEG) during the flanker task and found that arrow stimuli not only induce lateralized response activation, as indicated by the lateralized readiness potential, but also lateralized activation over parietal areas (Wascher et al., 1999; Willemssen et al., 2004). Parietal lateralization in the flanker task was interpreted as possibly indicative of an earlier coding of response side or lateralized stimulus- or attention related factors. In the present study we also found more robust statistical significance values in parietal lobe regions for main effects of interference in the flanker relative to Stroop task (compare Z score values for the response interference contrast of left and right parietal cortex clusters in Tables 3 and 4).
Increased functional activation to response interference in concordant high compared to concordant low risk twins, which may indicate compensatory mechanisms (Fassbender and Schweitzer, 2006), was noted in the left thalamus pulvinar for the Stroop task, and a left premotor region for the flanker task. The pulvinar is regarded as an important structure for visual attention function by facilitating communication between subcortical as well cortical structures related to visual processing (Leh et al., 2008), and damage to this structure results in visual attention deficit (Arend et al., 2008). Involvement of the thalamus in the genetic etiology of ADHD is in line with a recent study of resting-state brain function (Zhu et al., 2008), while increased probability of left thalamus activation associated with ADHD was also reported in a recent meta-analysis on 16 ADHD neuroimaging studies (Dickstein et al., 2006). Furthermore, in specific agreement with our present results, thalamic hyperactivation together with frontal underactivation in ADHD adolescents was recently observed in the context of a sustained attention task (Rubia et al., 2009). Thalamic hyperactivation may be more readily evident in the Stroop compared to the flanker task, because the Stroop paradigm requires a higher level of visual analysis. Conversely, increased premotor activation observed in the flanker task, may be more obvious because in this task there is a more direct coupling between the visual stimulus and required motoric action.
An interesting question is whether the brain areas that showed AP related functional activation differences are in agreement with our previous findings on AP related neuroanatomical differences between high- and low-risk twins (van ’t Ent et al., 2007). In interpreting this correspondence it should be recognized that the relation between functional and structural brain changes is complex. Changes of brain function may relate to morphological alterations of gray or white matter or both, and the direction of functional and structural brain changes is not clearly defined, i.e., functional hypoactivation (and hyperactivation) may be associated with local brain tissue decrement or increment. In addition, our sMRI study included only a subset of the twin samples from the present study. Nonetheless, a close correspondence was found for some areas. The present cluster of dlPFC hypoactivation, for instance, is located near a region of CBCL-AP related prefrontal gray matter increase (van ’t Ent et al., 2007: cluster labeled G in fig. 2, euclidean distance = 1.4 cm) and white matter decrease (van ’t Ent et al., 2007: cluster J in fig. 3, distance = 1.3 cm). In other areas the correspondence between structural and functional findings was less immediate. The regions of deviant parietal lobe activation were at a relatively large distance (> 4 cm) compared to parietal gray and white matter reductions observed in our sMRI study which were located closer to the midline (van ’t Ent et al., 2007: clusters A in fig. 2 and fig. 3). The present loci of hyperactivation in the left thalamus and left premotor cortex were not replicated in our structural MRI study. Structural changes in brain areas related to sensorimotor processing were found, but only in the right hemisphere (van ’t Ent et al., 2007: increased gray and white matter in sensorimotor regions; cluster F in fig. 2 and cluster L in fig. 3).
Environmental contrast
Difference in brain activation related to CBCL-AP scores in the discordant twin pairs were distinct from the functional changes observed between high- and low-risk twins from concordant pairs. Hypoactivation to response interference for discordant high risk twins was noted exclusively for the Stroop task and primarily restricted to regions of the temporal lobes, with an additional cluster in the right parietal precuneus. In particular temporal lobe changes may be evident primarily for the Stroop task due to the word processing requirements of this paradigm (Constable et al., 2004). Agreement of task-related hypoactivation with anatomical brain changes in high- relative to low-risk twins from discordant pairs was highest for the cluster in the left superior temporal gyrus (STG: close to a region of relative mid temporal white matter decrease for high-risk twins in van ’t Ent et al. 2007: cluster A in fig. 5; distance = 1.4 cm).
Similar to what was found for high-risk twins from concordant pairs, clusters of hyperactivation were found in the high-risk twins from discordant pairs in cortical premotor regions. This is consistent with the theory that, as a result of impaired higher order processing (e.g., of the prefrontal brain), neural compensation in ADHD may be accomplished through enhanced recruitment of processes more proximal to the (visuo-)motor demands of the experimental task (Fassbender and Schweitzer, 2006). This appears to apply equally to AP of either genetic and environmental origin. High risk discordant twins further showed increased activation in regions of the right middle frontal gyrus and anterior cingulate cortex (ACC). This finding stands in sharp contrast to the frontal hypoactivations generally reported in ADHD (Bush et al., 2005; Dickstein et al., 2006). In particular, hypoactivation of the ACC has been noted repeatedly in ADHD patients for different executive tasks and in children/adolescents (Rubia et al., 1999; Durston et al., 2003; Tamm et al., 2004) as well as adults (Zametkin et al., 1990; Bush et al., 1999). Considering the major genetic component in ADHD these samples may have largely consisted of individuals at high genetic risk. Indeed, decreased frontal activation was found in the present study for concordant twins at high genetic risk, although not in the ACC but restricted to the left dlPFC. The contrast between decreased frontal activation in ADHD patient populations (and the high-risk twins from concordant pairs in this study) and increased frontal activation in high-risk twins from discordant pairs suggests a clear distinction in the underlying neurobiology of genetically and environmentally mediated attention/hyperactivity problems.
Correspondence between the present functional hyperactivations and our previous sMRI findings in high-risk twins from discordant pairs were highest for the cluster in the left premotor cortex (near a cluster of decreased white matter in the left sensorimotor area, van ’t Ent et al. 2007: cluster B in fig. 5, distance = 1.6 cm).
To summarize, the present functional neuroimaging study demonstrates decreases as well as increases in the amount of BOLD activation during the inhibition of distracting information that are related to parental report of inattention and hyperactivity symptoms. Furthermore, these AP related differences depended on the type of executive task used (color-word Stroop versus flanker task). In general agreement with neuroanatomical differences in twins with high relative to low CBCL-AP scores (van ’t Ent et al., 2007), functional hypoactivation to response interference associated with high inattention/hyperactivity scores was primarily located in frontal, parietal and temporal brain regions. Functional hyperactivation, presumably related to compensatory mechanisms, was primarily found for brain regions involved in premotor (and visual selective attention) processing.
Comparison of the brain activation in the twins at genetic (high versus low concordant MZ pairs) or environmental risk (high-low discordant MZ pairs) for ADHD showed that different areas of the brain were affected by genetic and environmental risk factors. Consistent with previous findings in ADHD patients, attention deficit/hyperactivity problems of genetic origin were characterized by decreased activation of frontal brain regions (in the Stroop task) as well as parietal lobe regions (in the flanker task). In contrast, for attention deficit/hyperactivity problems of environmental origin there was evidence for increased, instead of decreased, activation of frontal brain regions and decreased activation was primarily restricted to areas of the temporal lobes. We conclude, that genetic and environmental risk factors for attention/hyperactivity problems act on partly different brain structures, and can influence the same structures in opposite ways.
Acknowledgments
We thank Hanne Lehn, Niels van Strien, Hester van den Akker and Marit de Haas for help with MRI data collection.
Funded by NWO/SPI 56-464-14192; NIMH, RO1 MH58799-03; NIH R21 MH66148-01.
Footnotes
Intended for: Special Issue “Linking Genes to Brain Function in Health and Disease” Journal: Neuroscience, section A. General issues (handling editor: Tobias Sommer)
Publisher's Disclaimer: This is a PDF file of an unedited manuscript that has been accepted for publication. As a service to our customers we are providing this early version of the manuscript. The manuscript will undergo copyediting, typesetting, and review of the resulting proof before it is published in its final citable form. Please note that during the production process errors may be discovered which could affect the content, and all legal disclaimers that apply to the journal pertain.
References
- Achenbach TM, Dumenci L, Rescorla LA. DSM-oriented and empirically based approaches to constructing scales from the same item pools. J Clin Child Adolesc Psychol. 2003;32:328–340. doi: 10.1207/S15374424JCCP3203_02. [DOI] [PubMed] [Google Scholar]
- Achenbach TM, Howell CT, Quay HC, Conners CK. National survey of problems and competencies among four- to sixteen-year-olds: parents’ reports for normative and clinical samples. Monogr Soc Res Child Dev. 1991;56:1–131. [PubMed] [Google Scholar]
- American Psychiatric Association. Diagnostic and statistical manual of mental disorder: DSM-IV. 4. Washington, DC: American Psychiatric Association; 1994. [Google Scholar]
- Arend I, Rafal R, Ward R. Spatial and temporal deficits are regionally dissociable in patients with pulvinar lesions. Brain. 2008;131:2140–2152. doi: 10.1093/brain/awn135. [DOI] [PubMed] [Google Scholar]
- Auerbach JG, Benjamin J, Faroy M, Geller V, Ebstein R. DRD4 related to infant attention and information processing: a developmental link to ADHD? Psychiatr Genet. 2001;11:31–35. doi: 10.1097/00041444-200103000-00006. [DOI] [PubMed] [Google Scholar]
- Barkley RA. Behavioral inhibition, sustained attention, and executive functions: constructing a unifying theory of ADHD. Psychol Bull. 1997;121:65–94. doi: 10.1037/0033-2909.121.1.65. [DOI] [PubMed] [Google Scholar]
- Bhutta AT, Anand KJ. Abnormal cognition and behavior in preterm neonates linked to smaller brain volumes. Trends Neurosci. 2001;24:129–130. doi: 10.1016/s0166-2236(00)01747-1. [DOI] [PubMed] [Google Scholar]
- Boomsma D, Busjahn A, Peltonen L. Classical twin studies and beyond. Nat Rev Genet. 2002a;3:872–882. doi: 10.1038/nrg932. [DOI] [PubMed] [Google Scholar]
- Boomsma DI, Vink JM, van Beijsterveldt TC, De Geus EJ, Beem AL, Mulder EJ, Derks EM, Riese H, Willemsen GA, Bartels M, van den BM, Kupper NH, Polderman TJ, Posthuma D, Rietveld MJ, Stubbe JH, Knol LI, Stroet T, van Baal GC. Netherlands Twin Register: a focus on longitudinal research. Twin Res. 2002b;5:401–406. doi: 10.1375/136905202320906174. [DOI] [PubMed] [Google Scholar]
- Booth JR, Burman DD, Meyer JR, Lei Z, Trommer BL, Davenport ND, Li W, Parrish TB, Gitelman DR, Mesulam MM. Larger deficits in brain networks for response inhibition than for visual selective attention in attention deficit hyperactivity disorder (ADHD) J Child Psychol Psychiatry. 2005;46:94–111. doi: 10.1111/j.1469-7610.2004.00337.x. [DOI] [PubMed] [Google Scholar]
- Brieber S, Neufang S, Bruning N, Kamp-Becker I, Remschmidt H, Herpertz-Dahlmann B, Fink GR, Konrad K. Structural brain abnormalities in adolescents with autism spectrum disorder and patients with attention deficit/hyperactivity disorder. J Child Psychol Psychiatry. 2007;48:1251–1258. doi: 10.1111/j.1469-7610.2007.01799.x. [DOI] [PubMed] [Google Scholar]
- Brookes K, Xu X, Chen W, Zhou K, Neale B, Lowe N, Anney R, Franke B, Gill M, Ebstein R, Buitelaar J, Sham P, Campbell D, Knight J, Andreou P, Altink M, Arnold R, Boer F, Buschgens C, Butler L, Christiansen H, Feldman L, Fleischman K, Fliers E, Howe-Forbes R, Goldfarb A, Heise A, Gabriels I, Korn-Lubetzki I, Johansson L, Marco R, Medad S, Minderaa R, Mulas F, Muller U, Mulligan A, Rabin K, Rommelse N, Sethna V, Sorohan J, Uebel H, Psychogiou L, Weeks A, Barrett R, Craig I, Banaschewski T, Sonuga-Barke E, Eisenberg J, Kuntsi J, Manor I, McGuffin P, Miranda A, Oades RD, Plomin R, Roeyers H, Rothenberger A, Sergeant J, Steinhausen HC, Taylor E, Thompson M, Faraone SV, Asherson P. The analysis of 51 genes in DSM-IV combined type attention deficit hyperactivity disorder: association signals in DRD4, DAT1 and 16 other genes. Mol Psychiatry. 2006a;11:934–953. doi: 10.1038/sj.mp.4001869. [DOI] [PubMed] [Google Scholar]
- Brookes KJ, Mill J, Guindalini C, Curran S, Xu X, Knight J, Chen CK, Huang YS, Sethna V, Taylor E, Chen W, Breen G, Asherson P. A common haplotype of the dopamine transporter gene associated with attention-deficit/hyperactivity disorder and interacting with maternal use of alcohol during pregnancy. Arch Gen Psychiatry. 2006b;63:74–81. doi: 10.1001/archpsyc.63.1.74. [DOI] [PubMed] [Google Scholar]
- Buitelaar JK, Kooij JJ. Attention deficit hyperactivity disorder (ADHD): etiology, diagnosis and treatment. Ned Tijdschr Geneeskd. 2000;144:1716–1723. [PubMed] [Google Scholar]
- Bush G, Frazier JA, Rauch SL, Seidman LJ, Whalen PJ, Jenike MA, Rosen BR, Biederman J. Anterior cingulate cortex dysfunction in attention-deficit/hyperactivity disorder revealed by fMRI and the Counting Stroop. Biol Psychiatry. 1999;45:1542–1552. doi: 10.1016/s0006-3223(99)00083-9. [DOI] [PubMed] [Google Scholar]
- Bush G, Valera EM, Seidman LJ. Functional neuroimaging of attention-deficit/hyperactivity disorder: a review and suggested future directions. Biol Psychiatry. 2005;57:1273–1284. doi: 10.1016/j.biopsych.2005.01.034. [DOI] [PubMed] [Google Scholar]
- Cao Q, Zang Y, Zhu C, Cao X, Sun L, Zhou X, Wang Y. Alerting deficits in children with attention deficit/hyperactivity disorder: event-related fMRI evidence. Brain Res. 2008;1219:159–168. doi: 10.1016/j.brainres.2008.04.028. [DOI] [PubMed] [Google Scholar]
- Carmona S, Vilarroya O, Bielsa A, Tremols V, Soliva JC, Rovira M, Tomas J, Raheb C, Gispert JD, Batlle S, Bulbena A. Global and regional gray matter reductions in ADHD: a voxel-based morphometric study. Neurosci Lett. 2005;389:88–93. doi: 10.1016/j.neulet.2005.07.020. [DOI] [PubMed] [Google Scholar]
- Castellanos FX, Lee PP, Sharp W, Jeffries NO, Greenstein DK, Clasen LS, Blumenthal JD, James RS, Ebens CL, Walter JM, Zijdenbos A, Evans AC, Giedd JN, Rapoport JL. Developmental trajectories of brain volume abnormalities in children and adolescents with attention-deficit/hyperactivity disorder. JAMA. 2002;288:1740–1748. doi: 10.1001/jama.288.14.1740. [DOI] [PubMed] [Google Scholar]
- Castellanos FX, Sharp WS, Gottesman RF, Greenstein DK, Giedd JN, Rapoport JL. Anatomic brain abnormalities in monozygotic twins discordant for attention deficit hyperactivity disorder. Am J Psychiatry. 2003;160:1693–1696. doi: 10.1176/appi.ajp.160.9.1693. [DOI] [PubMed] [Google Scholar]
- Castellanos FX, Sonuga-Barke EJ, Milham MP, Tannock R. Characterizing cognition in ADHD: beyond executive dysfunction. Trends Cogn Sci. 2006;10:117–123. doi: 10.1016/j.tics.2006.01.011. [DOI] [PubMed] [Google Scholar]
- Chen WJ, Faraone SV, Biederman J, Tsuang MT. Diagnostic accuracy of the Child Behavior Checklist scales for attention-deficit hyperactivity disorder: a receiver-operating characteristic analysis. J Consult Clin Psychol. 1994;62:1017–1025. doi: 10.1037/0022-006X.62.5.1017. [DOI] [PubMed] [Google Scholar]
- Constable RT, Pugh KR, Berroya E, Mencl WE, Westerveld M, Ni W, Shankweiler D. Sentence complexity and input modality effects in sentence comprehension: an fMRI study. Neuroimage. 2004;22:11–21. doi: 10.1016/j.neuroimage.2004.01.001. [DOI] [PubMed] [Google Scholar]
- Derks EM, Hudziak JJ, Dolan CV, Ferdinand RF, Boomsma DI. The relations between DISC-IV DSM diagnoses of ADHD and multi-informant CBCL-AP syndrome scores. Compr Psychiatry. 2006;47:116–122. doi: 10.1016/j.comppsych.2005.05.006. [DOI] [PubMed] [Google Scholar]
- Derks EM, Hudziak JJ, Dolan CV, van Beijsterveldt TC, Verhulst FC, Boomsma DI. Genetic and environmental influences on the relation between attention problems and attention deficit hyperactivity disorder. Behav Genet. 2008;38:11–23. doi: 10.1007/s10519-007-9178-8. [DOI] [PMC free article] [PubMed] [Google Scholar]
- Dickstein SG, Bannon K, Castellanos FX, Milham MP. The neural correlates of attention deficit hyperactivity disorder: an ALE meta-analysis. J Child Psychol Psychiatry. 2006;47:1051–1062. doi: 10.1111/j.1469-7610.2006.01671.x. [DOI] [PubMed] [Google Scholar]
- Doyle AE. Executive functions in attention-deficit/hyperactivity disorder. J Clin Psychiatry. 2006;67(Suppl 8):21–26. [PubMed] [Google Scholar]
- Durston S. A review of the biological bases of ADHD: what have we learned from imaging studies? Ment Retard Dev Disabil Res Rev. 2003;9:184–195. doi: 10.1002/mrdd.10079. [DOI] [PubMed] [Google Scholar]
- Durston S, Fossella JA, Casey BJ, Hulshoff Pol HE, Galvan A, Schnack HG, Steenhuis MP, Minderaa RB, Buitelaar JK, Kahn RS, van Engeland H. Differential effects of DRD4 and DAT1 genotype on fronto-striatal gray matter volumes in a sample of subjects with attention deficit hyperactivity disorder, their unaffected siblings, and controls. Mol Psychiatry. 2005;10:678–685. doi: 10.1038/sj.mp.4001649. [DOI] [PubMed] [Google Scholar]
- Durston S, Fossella JA, Mulder MJ, Casey BJ, Ziermans TB, Vessaz MN, van Engeland H. Dopamine transporter genotype conveys familial risk of attention-deficit/hyperactivity disorder through striatal activation. J Am Acad Child Adolesc Psychiatry. 2008;47:61–67. doi: 10.1097/chi.0b013e31815a5f17. [DOI] [PubMed] [Google Scholar]
- Durston S, Hulshoff Pol HE, Schnack HG, Buitelaar JK, Steenhuis MP, Minderaa RB, Kahn RS, van Engeland H. Magnetic resonance imaging of boys with attention-deficit/hyperactivity disorder and their unaffected siblings. J Am Acad Child Adolesc Psychiatry. 2004;43:332–340. doi: 10.1097/00004583-200403000-00016. [DOI] [PubMed] [Google Scholar]
- Durston S, Mulder M, Casey BJ, Ziermans T, van Engeland H. Activation in ventral prefrontal cortex is sensitive to genetic vulnerability for attention-deficit hyperactivity disorder. Biol Psychiatry. 2006;60:1062–1070. doi: 10.1016/j.biopsych.2005.12.020. [DOI] [PubMed] [Google Scholar]
- Durston S, Tottenham NT, Thomas KM, Davidson MC, Eigsti IM, Yang Y, Ulug AM, Casey BJ. Differential patterns of striatal activation in young children with and without ADHD. Biol Psychiatry. 2003;53:871–878. doi: 10.1016/s0006-3223(02)01904-2. [DOI] [PubMed] [Google Scholar]
- Ellison-Wright I, Ellison-Wright Z, Bullmore E. Structural brain change in Attention Deficit Hyperactivity Disorder identified by meta-analysis. BMC Psychiatry. 2008;8:51. doi: 10.1186/1471-244X-8-51. [DOI] [PMC free article] [PubMed] [Google Scholar]
- Eriksen BA, Eriksen CW. Effects of Noise Letters Upon Identification of A Target Letter in A Nonsearch Task. Perception & Psychophysics. 1974;16:143–149. [Google Scholar]
- Fassbender C, Schweitzer JB. Is there evidence for neural compensation in attention deficit hyperactivity disorder? A review of the functional neuroimaging literature. Clin Psychol Rev. 2006;26:445–465. doi: 10.1016/j.cpr.2006.01.003. [DOI] [PMC free article] [PubMed] [Google Scholar]
- Filipek PA, Semrud-Clikeman M, Steingard RJ, Renshaw PF, Kennedy DN, Biederman J. Volumetric MRI analysis comparing subjects having attention-deficit hyperactivity disorder with normal controls. Neurology. 1997;48:589–601. doi: 10.1212/wnl.48.3.589. [DOI] [PubMed] [Google Scholar]
- Gerring J, Brady K, Chen A, Quinn C, Herskovits E, Bandeen-Roche K, Denckla MB, Bryan RN. Neuroimaging variables related to development of Secondary Attention Deficit Hyperactivity Disorder after closed head injury in children and adolescents. Brain Inj. 2000;14:205–218. doi: 10.1080/026990500120682. [DOI] [PubMed] [Google Scholar]
- Giedd JN, Blumenthal J, Molloy E, Castellanos FX. Brain imaging of attention deficit/hyperactivity disorder. Ann N Y Acad Sci. 2001;931:33–49. doi: 10.1111/j.1749-6632.2001.tb05772.x. [DOI] [PubMed] [Google Scholar]
- Goldman LS, Genel M, Bezman RJ, Slanetz PJ. Diagnosis and treatment of attention-deficit/hyperactivity disorder in children and adolescents. Council on Scientific Affairs, American Medical Association. JAMA. 1998;279:1100–1107. doi: 10.1001/jama.279.14.1100. [DOI] [PubMed] [Google Scholar]
- Herskovits EH, Megalooikonomou V, Davatzikos C, Chen A, Bryan RN, Gerring JP. Is the spatial distribution of brain lesions associated with closed-head injury predictive of subsequent development of attention-deficit/hyperactivity disorder? Analysis with brain-image database. Radiology. 1999;213:389–394. doi: 10.1148/radiology.213.2.r99nv45389. [DOI] [PubMed] [Google Scholar]
- Hill DE, Yeo RA, Campbell RA, Hart B, Vigil J, Brooks W. Magnetic resonance imaging correlates of attention-deficit/hyperactivity disorder in children. Neuropsychology. 2003;17:496–506. doi: 10.1037/0894-4105.17.3.496. [DOI] [PubMed] [Google Scholar]
- Homack S, Riccio CA. A meta-analysis of the sensitivity and specificity of the Stroop Color and Word Test with children. Arch Clin Neuropsychol. 2004;19:725–743. doi: 10.1016/j.acn.2003.09.003. [DOI] [PubMed] [Google Scholar]
- Hudziak JJ, Copeland W, Stanger C, Wadsworth M. Screening for DSM-IV externalizing disorders with the Child Behavior Checklist: a receiver-operating characteristic analysis. J Child Psychol Psychiatry. 2004;45:1299–1307. doi: 10.1111/j.1469-7610.2004.00314.x. [DOI] [PubMed] [Google Scholar]
- Hudziak JJ, Derks EM, Althoff RR, Rettew DC, Boomsma DI. The genetic and environmental contributions to attention deficit hyperactivity disorder as measured by the Conners’ Rating Scales--Revised. Am J Psychiatry. 2005;162:1614–1620. doi: 10.1176/appi.ajp.162.9.1614. [DOI] [PubMed] [Google Scholar]
- Hudziak JJ, Rudiger LP, Neale MC, Heath AC, Todd RD. A twin study of inattentive, aggressive, and anxious/depressed behaviors. J Am Acad Child Adolesc Psychiatry. 2000;39:469–476. doi: 10.1097/00004583-200004000-00016. [DOI] [PubMed] [Google Scholar]
- Huizink AC, Mulder EJ. Maternal smoking, drinking or cannabis use during pregnancy and neurobehavioral and cognitive functioning in human offspring. Neurosci Biobehav Rev. 2006;30:24–41. doi: 10.1016/j.neubiorev.2005.04.005. [DOI] [PubMed] [Google Scholar]
- Huttenlocher PR. Synaptic density in human frontal cortex - developmental changes and effects of aging. Brain Res. 1979;163:195–205. doi: 10.1016/0006-8993(79)90349-4. [DOI] [PubMed] [Google Scholar]
- Kahn RS, Khoury J, Nichols WC, Lanphear BP. Role of dopamine transporter genotype and maternal prenatal smoking in childhood hyperactive-impulsive, inattentive, and oppositional behaviors. J Pediatr. 2003;143:104–110. doi: 10.1016/S0022-3476(03)00208-7. [DOI] [PubMed] [Google Scholar]
- Kates WR, Frederikse M, Mostofsky SH, Folley BS, Cooper K, Mazur-Hopkins P, Kofman O, Singer HS, Denckla MB, Pearlson GD, Kaufmann WE. MRI parcellation of the frontal lobe in boys with attention deficit hyperactivity disorder or Tourette syndrome. Psychiatry Res. 2002;116:63–81. doi: 10.1016/s0925-4927(02)00066-5. [DOI] [PubMed] [Google Scholar]
- Konrad K, Neufang S, Hanisch C, Fink GR, Herpertz-Dahlmann B. Dysfunctional attentional networks in children with attention deficit/hyperactivity disorder: evidence from an event-related functional magnetic resonance imaging study. Biol Psychiatry. 2006;59:643–651. doi: 10.1016/j.biopsych.2005.08.013. [DOI] [PubMed] [Google Scholar]
- Krain AL, Castellanos FX. Brain development and ADHD. Clin Psychol Rev. 2006;26:433–444. doi: 10.1016/j.cpr.2006.01.005. [DOI] [PubMed] [Google Scholar]
- Lansbergen MM, Kenemans JL, van Engeland H. Stroop interference and attention-deficit/hyperactivity disorder: a review and meta-analysis. Neuropsychology. 2007;21:251–262. doi: 10.1037/0894-4105.21.2.251. [DOI] [PubMed] [Google Scholar]
- Lasky-Su J, Neale BM, Franke B, Anney RJ, Zhou K, Maller JB, Vasquez AA, Chen W, Asherson P, Buitelaar J, Banaschewski T, Ebstein R, Gill M, Miranda A, Mulas F, Oades RD, Roeyers H, Rothenberger A, Sergeant J, Sonuga-Barke E, Steinhausen HC, Taylor E, Daly M, Laird N, Lange C, Faraone SV. Genome-wide association scan of quantitative traits for attention deficit hyperactivity disorder identifies novel associations and confirms candidate gene associations. Am J Med Genet B Neuropsychiatr Genet. 2008;147B:1345–1354. doi: 10.1002/ajmg.b.30867. [DOI] [PubMed] [Google Scholar]
- Leh SE, Chakravarty MM, Ptito A. The connectivity of the human pulvinar: a diffusion tensor imaging tractography study. Int J Biomed Imaging. 2008;2008:789539. doi: 10.1155/2008/789539. [DOI] [PMC free article] [PubMed] [Google Scholar]
- Lehn H, Derks EM, Hudziak JJ, Heutink P, van Beijsterveldt TC, Boomsma DI. Attention problems and attention-deficit/hyperactivity disorder in discordant and concordant monozygotic twins: evidence of environmental mediators. J Am Acad Child Adolesc Psychiatry. 2007;46:83–91. doi: 10.1097/01.chi.0000242244.00174.d9. [DOI] [PubMed] [Google Scholar]
- Linnet KM, Dalsgaard S, Obel C, Wisborg K, Henriksen TB, Rodriguez A, Kotimaa A, Moilanen I, Thomsen PH, Olsen J, Jarvelin MR. Maternal lifestyle factors in pregnancy risk of attention deficit hyperactivity disorder and associated behaviors: review of the current evidence. Am J Psychiatry. 2003;160:1028–1040. doi: 10.1176/appi.ajp.160.6.1028. [DOI] [PubMed] [Google Scholar]
- Lou HC, Rosa P, Pryds O, Karrebaek H, Lunding J, Cumming P, Gjedde A. ADHD: increased dopamine receptor availability linked to attention deficit and low neonatal cerebral blood flow. Dev Med Child Neurol. 2004;46:179–183. doi: 10.1017/s0012162204000313. [DOI] [PubMed] [Google Scholar]
- Max JE, Fox PT, Lancaster JL, Kochunov P, Mathews K, Manes FF, Robertson BA, Arndt S, Robin DA, Lansing AE. Putamen lesions and the development of attention-deficit/hyperactivity symptomatology. J Am Acad Child Adolesc Psychiatry. 2002;41:563–571. doi: 10.1097/00004583-200205000-00014. [DOI] [PubMed] [Google Scholar]
- Max JE, Manes FF, Robertson BA, Mathews K, Fox PT, Lancaster J. Prefrontal and executive attention network lesions and the development of attention-deficit/hyperactivity symptomatology. J Am Acad Child Adolesc Psychiatry. 2005a;44:443–450. doi: 10.1097/01.chi.0000156661.38576.0f. [DOI] [PubMed] [Google Scholar]
- Max JE, Schachar RJ, Levin HS, Ewing-Cobbs L, Chapman SB, Dennis M, Saunders A, Landis J. Predictors of attention-deficit/hyperactivity disorder within 6 months after pediatric traumatic brain injury. J Am Acad Child Adolesc Psychiatry. 2005b;44:1032–1040. doi: 10.1097/01.chi.0000173293.05817.b1. [DOI] [PubMed] [Google Scholar]
- Mulder MJ, Baeyens D, Davidson MC, Casey BJ, van den BE, van Engeland H, Durston S. Familial vulnerability to ADHD affects activity in the cerebellum in addition to the prefrontal systems. J Am Acad Child Adolesc Psychiatry. 2008;47:68–75. doi: 10.1097/chi.0b013e31815a56dc. [DOI] [PubMed] [Google Scholar]
- Mullane JC, Corkum PV, Klein RM, McLaughlin E. Interference Control in Children with and without ADHD: A Systematic Review of Flanker and Simon Task Performance. Child Neuropsychol. 2008:1–22. doi: 10.1080/09297040802348028. [DOI] [PubMed] [Google Scholar]
- Neuman RJ, Todd RD, Heath AC, Reich W, Hudziak JJ, Bucholz KK, Madden PA, Begleiter H, Porjesz B, Kuperman S, Hesselbrock V, Reich T. Evaluation of ADHD typology in three contrasting samples: a latent class approach. J Am Acad Child Adolesc Psychiatry. 1999;38:25–33. doi: 10.1097/00004583-199901000-00016. [DOI] [PubMed] [Google Scholar]
- Overmeyer S, Bullmore ET, Suckling J, Simmons A, Williams SC, Santosh PJ, Taylor E. Distributed grey and white matter deficits in hyperkinetic disorder: MRI evidence for anatomical abnormality in an attentional network. Psychol Med. 2001;31:1425–1435. doi: 10.1017/s0033291701004706. [DOI] [PubMed] [Google Scholar]
- Peterson BS, Leckman JF, Tucker D, Scahill L, Staib L, Zhang H, King R, Cohen DJ, Gore JC, Lombroso P. Preliminary findings of antistreptococcal antibody titers and basal ganglia volumes in tic, obsessive-compulsive, and attention deficit/hyperactivity disorders. Arch Gen Psychiatry. 2000;57:364–372. doi: 10.1001/archpsyc.57.4.364. [DOI] [PubMed] [Google Scholar]
- Powell AL, Yudd A, Zee P, Mandelbaum DE. Attention deficit hyperactivity disorder associated with orbitofrontal epilepsy in a father and a son. Neuropsychiatry Neuropsychol Behav Neurol. 1997;10:151–154. [PubMed] [Google Scholar]
- Qiu A, Crocetti D, Adler M, Mahone EM, Denckla MB, Miller MI, Mostofsky SH. Basal Ganglia volume and shape in children with attention deficit hyperactivity disorder. Am J Psychiatry. 2009;166:74–82. doi: 10.1176/appi.ajp.2008.08030426. [DOI] [PMC free article] [PubMed] [Google Scholar]
- Rietveld MJ, Hudziak JJ, Bartels M, van Beijsterveldt CE, Boomsma DI. Heritability of attention problems in children: I. cross-sectional results from a study of twins, age 3-12 years. Am J Med Genet B Neuropsychiatr Genet. 2003;117B:102–113. doi: 10.1002/ajmg.b.10024. [DOI] [PubMed] [Google Scholar]
- Rietveld MJ, Hudziak JJ, Bartels M, van Beijsterveldt CE, Boomsma DI. Heritability of attention problems in children: longitudinal results from a study of twins, age 3 to 12. J Child Psychol Psychiatry. 2004;45:577–588. doi: 10.1111/j.1469-7610.2004.00247.x. [DOI] [PubMed] [Google Scholar]
- Rubia K, Halari R, Smith AB, Mohammed M, Scott S, Giampietro V, Taylor E, Brammer MJ. Dissociated functional brain abnormalities of inhibition in boys with pure conduct disorder and in boys with pure attention deficit hyperactivity disorder. Am J Psychiatry. 2008;165:889–897. doi: 10.1176/appi.ajp.2008.07071084. [DOI] [PubMed] [Google Scholar]
- Rubia K, Overmeyer S, Taylor E, Brammer M, Williams SC, Simmons A, Bullmore ET. Hypofrontality in attention deficit hyperactivity disorder during higher-order motor control: a study with functional MRI. Am J Psychiatry. 1999;156:891–896. doi: 10.1176/ajp.156.6.891. [DOI] [PubMed] [Google Scholar]
- Rubia K, Smith AB, Halari R, Matsukura F, Mohammad M, Taylor E, Brammer MJ. Disorder-specific dissociation of orbitofrontal dysfunction in boys with pure conduct disorder during reward and ventrolateral prefrontal dysfunction in boys with pure ADHD during sustained attention. Am J Psychiatry. 2009;166:83–94. doi: 10.1176/appi.ajp.2008.08020212. [DOI] [PubMed] [Google Scholar]
- Schubert R. Attention deficit disorder and epilepsy. Pediatr Neurol. 2005;32:1–10. doi: 10.1016/j.pediatrneurol.2004.06.007. [DOI] [PubMed] [Google Scholar]
- Seidman LJ, Valera EM, Makris N. Structural brain imaging of attention-deficit/hyperactivity disorder. Biol Psychiatry. 2005;57:1263–1272. doi: 10.1016/j.biopsych.2004.11.019. [DOI] [PubMed] [Google Scholar]
- Semrud-Clikeman M, Steingard RJ, Filipek P, Biederman J, Bekken K, Renshaw PF. Using MRI to examine brain-behavior relationships in males with attention deficit disorder with hyperactivity. J Am Acad Child Adolesc Psychiatry. 2000;39:477–484. doi: 10.1097/00004583-200004000-00017. [DOI] [PubMed] [Google Scholar]
- Sergeant JA, Geurts H, Oosterlaan J. How specific is a deficit of executive functioning for attention-deficit/hyperactivity disorder? Behav Brain Res. 2002;130:3–28. doi: 10.1016/s0166-4328(01)00430-2. [DOI] [PubMed] [Google Scholar]
- Shaffer D, Schwab-Stone M, Fisher P, Cohen P, Piacentini J, Davies M, Conners CK, Regier D. The Diagnostic Interview Schedule for Children-Revised Version (DISC-R): I. Preparation, field testing, interrater reliability, and acceptability. J Am Acad Child Adolesc Psychiatry. 1993;32:643–650. doi: 10.1097/00004583-199305000-00023. [DOI] [PubMed] [Google Scholar]
- Shaw P, Eckstrand K, Sharp W, Blumenthal J, Lerch JP, Greenstein D, Clasen L, Evans A, Giedd J, Rapoport JL. Attention-deficit/hyperactivity disorder is characterized by a delay in cortical maturation. Proc Natl Acad Sci U S A. 2007a;104:19649–19654. doi: 10.1073/pnas.0707741104. [DOI] [PMC free article] [PubMed] [Google Scholar]
- Shaw P, Gornick M, Lerch J, Addington A, Seal J, Greenstein D, Sharp W, Evans A, Giedd JN, Castellanos FX, Rapoport JL. Polymorphisms of the dopamine D4 receptor, clinical outcome, and cortical structure in attention-deficit/hyperactivity disorder. Arch Gen Psychiatry. 2007b;64:921–931. doi: 10.1001/archpsyc.64.8.921. [DOI] [PubMed] [Google Scholar]
- Smith AB, Taylor E, Brammer M, Halari R, Rubia K. Reduced activation in right lateral prefrontal cortex and anterior cingulate gyrus in medication-naive adolescents with attention deficit hyperactivity disorder during time discrimination. J Child Psychol Psychiatry. 2008;49:977–985. doi: 10.1111/j.1469-7610.2008.01870.x. [DOI] [PubMed] [Google Scholar]
- Smith AB, Taylor E, Brammer M, Toone B, Rubia K. Task-specific hypoactivation in prefrontal and temporoparietal brain regions during motor inhibition and task switching in medication-naive children and adolescents with attention deficit hyperactivity disorder. Am J Psychiatry. 2006;163:1044–1051. doi: 10.1176/ajp.2006.163.6.1044. [DOI] [PubMed] [Google Scholar]
- Sowell ER, Thompson PM, Welcome SE, Henkenius AL, Toga AW, Peterson BS. Cortical abnormalities in children and adolescents with attention-deficit hyperactivity disorder. Lancet. 2003;362:1699–1707. doi: 10.1016/S0140-6736(03)14842-8. [DOI] [PubMed] [Google Scholar]
- Stins JF, Polderman JC, Boomsma DI, De Geus EJ. Response interference and working memory in 12-year-old children. Child Neuropsychol. 2005;11:191–201. doi: 10.1080/092970490911351. [DOI] [PubMed] [Google Scholar]
- Stroop JR. Studies of interference in serial verbal reactions. Journal of Experimental Psychology. 1935;18:643–662. [Google Scholar]
- Tamm L, Menon V, Ringel J, Reiss AL. Event-related FMRI evidence of frontotemporal involvement in aberrant response inhibition and task switching in attention-deficit/hyperactivity disorder. J Am Acad Child Adolesc Psychiatry. 2004;43:1430–1440. doi: 10.1097/01.chi.0000140452.51205.8d. [DOI] [PubMed] [Google Scholar]
- Thapar A, Holmes J, Poulton K, Harrington R. Genetic basis of attention deficit and hyperactivity. Br J Psychiatry. 1999;174:105–111. doi: 10.1192/bjp.174.2.105. [DOI] [PubMed] [Google Scholar]
- Vaidya CJ, Bunge SA, Dudukovic NM, Zalecki CA, Elliott GR, Gabrieli JD. Altered neural substrates of cognitive control in childhood ADHD: evidence from functional magnetic resonance imaging. Am J Psychiatry. 2005;162:1605–1613. doi: 10.1176/appi.ajp.162.9.1605. [DOI] [PMC free article] [PubMed] [Google Scholar]
- Valera EM, Faraone SV, Murray KE, Seidman LJ. Meta-analysis of structural imaging findings in attention-deficit/hyperactivity disorder. Biol Psychiatry. 2007;61:1361–1369. doi: 10.1016/j.biopsych.2006.06.011. [DOI] [PubMed] [Google Scholar]
- van ’t Ent D, Lehn H, Derks EM, Hudziak JJ, Van Strien NM, Veltman DJ, De Geus EJ, Todd RD, Boomsma DI. A structural MRI study in monozygotic twins concordant or discordant for attention/hyperactivity problems: evidence for genetic and environmental heterogeneity in the developing brain. Neuroimage. 2007;35:1004–1020. doi: 10.1016/j.neuroimage.2007.01.037. [DOI] [PMC free article] [PubMed] [Google Scholar]
- van Mourik R, Oosterlaan J, Sergeant JA. The Stroop revisited: a meta-analysis of interference control in AD/HD. J Child Psychol Psychiatry. 2005;46:150–165. doi: 10.1111/j.1469-7610.2004.00345.x. [DOI] [PubMed] [Google Scholar]
- Vance A, Silk TJ, Casey M, Rinehart NJ, Bradshaw JL, Bellgrove MA, Cunnington R. Right parietal dysfunction in children with attention deficit hyperactivity disorder, combined type: a functional MRI study. Mol Psychiatry. 2007;12:826–32. 793. doi: 10.1038/sj.mp.4001999. [DOI] [PubMed] [Google Scholar]
- Verhulst FC, van der Ende J, Koot HM. Handleiding Voor de CBCL/4-18. Rotterdam: Sophia Children’s Hospital/Erasmus University, Department of Child Psychiatry; 1996. [Google Scholar]
- Wait JW, Stanton L, Schoeman JF. Tuberculosis meningitis and attention deficit hyperactivity disorder in children. J Trop Pediatr. 2002;48:294–299. doi: 10.1093/tropej/48.5.294. [DOI] [PubMed] [Google Scholar]
- Wang J, Jiang T, Cao Q, Wang Y. Characterizing anatomic differences in boys with attention-deficit/hyperactivity disorder with the use of deformation-based morphometry. AJNR Am J Neuroradiol. 2007;28:543–547. [PMC free article] [PubMed] [Google Scholar]
- Wascher E, Reinhard M, Wauschkuhn B, Verleger R. Spatial S-R compatibility with centrally presented stimuli. An event-related asymmetry study on dimensional overlap. J Cogn Neurosci. 1999;11:214–229. doi: 10.1162/089892999563346. [DOI] [PubMed] [Google Scholar]
- Willemssen R, Hoormann J, Hohnsbein J, Falkenstein M. Central and parietal event-related lateralizations in a flanker task. Psychophysiology. 2004;41:762–771. doi: 10.1111/j.1469-8986.2004.00201.x. [DOI] [PubMed] [Google Scholar]
- Zametkin AJ, Nordahl TE, Gross M, King AC, Semple WE, Rumsey J, Hamburger S, Cohen RM. Cerebral glucose metabolism in adults with hyperactivity of childhood onset. N Engl J Med. 1990;323:1361–1366. doi: 10.1056/NEJM199011153232001. [DOI] [PubMed] [Google Scholar]
- Zang YF, Jin Z, Weng XC, Zhang L, Zeng YW, Yang L, Wang YF, Seidman LJ, Faraone SV. Functional MRI in attention-deficit hyperactivity disorder: evidence for hypofrontality. Brain Dev. 2005;27:544–550. doi: 10.1016/j.braindev.2004.11.009. [DOI] [PubMed] [Google Scholar]
- Zhu CZ, Zang YF, Cao QJ, Yan CG, He Y, Jiang TZ, Sui MQ, Wang YF. Fisher discriminative analysis of resting-state brain function for attention-deficit/hyperactivity disorder. Neuroimage. 2008;40:110–120. doi: 10.1016/j.neuroimage.2007.11.029. [DOI] [PubMed] [Google Scholar]