Abstract
In cultured cells, exposure to the nucleoside reverse transcriptase inhibitor (NRTI) zidovudine (AZT) induces genomic instability, cell cycle arrest, micronuclei, sister chromatid exchanges, and shortened telomeres. In previous studies, we demonstrated AZT-induced centrosome amplification (>2 centrosomes/cell). Here, we investigate centrosome amplification in cells exposed to other commonly used NRTIs. Experiments were performed using Chinese Hamster Ovary (CHO) cells, and two Normal Human Mammary Epithelial Cell (NHMEC) strains: M99005 and M98040, which are high and low incorporators of AZT into DNA, respectively. Cells were exposed for 24 hr to lamivudine (3TC), stavudine (d4T), didanosine (ddI), and thymidine, and stained with anti-pericentrin antibody. Dose response curves were performed to determine cytotoxicity and a lower concentration at near plasma levels and a 10-fold higher concentration were chosen for the experiments. In CHO cells, there was a concentration-dependent, significant (p < 0.05) increase in centrosome amplification for each of the NRTIs. In NHMEC strain M99005, an NRTI-induced increase (p < 0.05) in centrosome amplification was observed for the high concentrations of each NRTI and the low doses of 3TC and ddI. In NHMEC strain M98040, the high doses of ddI and d4T showed significant increases in centrosome amplification. Functional viability of amplified centrosomes was assessed by arresting microtubule nucleation with nocodazole. In cells with > 2 centrosomes, the ability to recover microtubule nucleation was similar to that of unexposed cells. We conclude that centrosome amplification is a consequence of exposure to NRTIs and that cells with centrosome amplification are able to accomplish cell division.
Introduction
The centrosome is a small but vital organelle central to the cellular mechanisms that regulate chromosomal segregation during cell division. Characterized by a pair of centrioles embedded in a matrix of pericentriolar material, the centrosome acts as the principal microtubule organizing center. In addition, this organelle is involved in the control of cell cycle progression [Hinchcliffe et al., 2001; Piel et al., 2001]. Typically, the centrosome duplicates once in a normal cell cycle. In a dividing cell, two orthogonally placed centrioles separate, becoming two new centrosomes, which migrate to become spindle poles. Failure of the centrosome to duplicate may result in abnormal chromosome segregation. Since too many spindle poles can lead to the unequal segregation of chromosomes, it is critical for the cell to contain no more than two centrosomes. An increase in the number of centrosomes, or centrosome amplification, can lead to multi-polar spindles, aneuploidy and genetic instability [Ghadimi et al., 2000; Nigg, 2002; Pihan et al., 1998]. This type of defect has been found in multiple types of cancer [D'Assoro et al., 2002; Levine et al., 1991; Lingle et al., 1998; Pihan et al., 2001].
The most current treatment for HIV-1 is combination therapy, or Highly Active Antiretroviral Therapy, which typically consists of at least two NRTIs and a protease inhibitor. AZT, the first and most commonly-used NRTI, induces several types of genotoxic damage partly as a result of being incorporated into DNA in place of thymidine; these include micronuclei, chromosomal instability, and telomere shortening [IARC, 2000; Olivero, 2007]. AZT is frequently used in combination with a second NRTI, either 3TC or ddI [IARC, 2000]. In a previous study [Borojerdi et al., 2009], AZT was shown, for the first time, to induce centrosome amplification in Chinese Hamster Ovary (CHO) cells and Normal Human Mammary Epithelial Cells (NHMECs). In this study, we report centrosome amplification induced in CHO cells and NHMECs by the NRTIs 3TC, ddI, and d4T; and, for that purpose, CHO cells and two NHMEC strains, M99005 and M98040, have been examined [Olivero et al., 2008]. In addition to centrosome amplification, we found disruptions in tubulin distribution in NHMECs. Therefore, centrosome amplification appears to be a common phenomenon induced by 3TC, d4T, and ddI in hamster and human cells. Also, amplified centrosomes are able to nucleate microtubules and participate in spindle formation.
Materials and Methods
Cells and Exposure
CHO cells were obtained from the American Type Culture Collection (ATCC, Manassas, VA) and propagated at 37°C and 5% CO2 in HAM F-12 Nutrient Mixture (Lonza, Walkersville, MD) supplemented with 10 % Fetal Bovine Serum (ATCC). NHMEC strains were cultured from tissue-derived organoids obtained at reduction mammoplasty and provided by the Cooperative Human Tissue Network [Keshava et al., 2005]. Two human cell strains, NHMEC M99005 and NHMEC M98040 were propagated at 37°C and 5% CO2 in serum-free Mammary Epithelial Growth Media (MEGM) (Lonza) supplemented with growth factors, cytokines, and other supplements in the MEGM SingleQuots (Lonza). 3TC (Moravek Biochemicals, Brea, CA), d4T (Sigma-Aldrich, St. Louis, MO), and ddI (Sigma-Aldrich) were all dissolved in phosphate buffered saline (PBS) pH 7.4 (Invitrogen, Carlsbad, CA) and final concentrations were calculated from absorbances at 270 nm, 266 nm and 250 nm, respectively.
Cytotoxicity and Experimental Concentrations
CHO and NHMEC strains M99005 and M98040 were used to determine cytotoxicity of 3TC, d4T, ddI, and thymidine. Cells were grown on 4-well Culture Slides (BD Falcon, Bedford, MA) and were exposed at 75% confluency to NRTIs for 24 hr. Dose response studies using 5 concentrations of each NRTI were performed. The agents and concentrations used for the dose response experiment were as follows: for 3TC, 0, 6.1, 12.2, 24.4, 122.0 and 244.0 μM; for d4T, 0, 4.5, 8.9, 17.8, 89.0 and 178.0 μM; and for ddI, 0, 5.1, 10.2, 20.3, 102.0 and 203.0 μM. Based on the cytotoxicity data, two non-toxic exposure levels were chosen for each compound. The low concentration was in the range of normal peak human plasma concentrations and the high concentration was 10-fold higher. Final concentrations to be used in subsequent experiments were: for 3TC, 12.2 and 122.0 μM; for d4T, 8.9 and 89.0 μM; and for ddI, 10.2 and 102.0 μM. A dose response curve for thymidine was determined using 9.9 and 99.0 μM. Hamster and human cells were grown on 24-well Cell Culture Cluster plates (Corning Inc., Corning, NY) in triplicates and treated with both concentrations of each NRTI and thymidine for 24 hr. The plates were washed thrice with DPBS w/o calcium and magnesium (Invitrogen) to wash off floating dead cells. The attached remaining cells were trypsinized and counted using a Z1 Coulter Particle Counter (Beckman Coulter, Fullerton, CA). Percent survival was determined by comparing treated cell numbers to controls with control cells at 100% cell survival.
Immunofluorescent detection of pericentrin and β-tubulin
CHO cells and NHMEC cell strains were grown on 4-well Culture Slides and treated with NRTIs or thymidine for 24 hr. Media was removed and cells were washed with PBS-Tween (0.05%) and fixed in ice cold methanol for 30 min at −20°C. Cells were washed, extracted using 0.1% Triton-X 100 in 1X PBS for 4 minutes, and washed again. Slides were blocked with 2% bovine serum albumin in 1X PBS for 1 hr. Cells were then incubated with either anti-Pericentrin (rabbit, polyclonal, Covance, Emeryville, CA) at a 1:300 dilution, or anti-β-tubulin (mouse, monoclonal, Sigma-Aldrich) at a 1:200 dilution. Antibodies were diluted in 2% bovine serum albumin in 1X PBS. Slides were incubated with primary antibodies for 2 hrs at room temperature, washed with PBS-Tween and incubated with Alexa-Fluor 594 anti-mouse (Invitrogen) and Alexa-Fluor 488 anti-rabbit (Invitrogen) secondary antibodies for 30 min. On the same slides, DNA was stained with 4', 6-diamindino-2-phenylindole (DAPI) (Sigma-Aldrich). Experiments were repeated 3 times per treatment for each cell type.
Microtubule Nucleation
CHO cells were grown for 24 hr on 4-well Culture Slides using the high concentration for each NRTI. The NRTI was removed and cells were incubated in media containing the NRTI plus 10 μg/ml nocodazole (Sigma-Aldrich) for 1.5 hr at 37°C and washed five times with media containing no NRTIs or nocodazole at room temperature. Cells were then incubated for 30 sec, 5 min, 15 min, 30 min and fixed in methanol for 30 min at −20°C. Centrosomes and microtubules were localized as described above and DNA was visualized with DAPI. The ability of the centrosomes to nucleate microtubules was established by colocalization of pericentrin and β-tubulin signals. Experiments were repeated 2 times.
Fluorescence and Confocal Microscopy
For both CHO and NHMEC cells, 1000 cells per exposure group were scored by fluorescence microscopy, and cells containing more than two centrosomes were counted as having amplified centrosomes. Stained cells were scored by fluorescence microscopy using a Nikon Eclipse E-400 (Nikon, Inc, Melville, NY) microscope with a Plan Apo 100x objective. Slides were photographed on a Zeiss Axiovert 100M microscope equipped with a Zeiss Plan Apochromat 100x/1.4 oil Dichromatic objective.
Statistical Analysis
Results were expressed as the mean ± standard error (SE) of three separate experiments. The Student's t-test was used to determine statistical significance for the scoring of amplified centrosomes in all cells, and for analysis of aberrant β-tubulin distribution. P-values < 0.05 were considered significant
Results
CHO cell and NHMEC Strain Cytotoxicity
For 3TC, d4T, ddI and thymidine-exposed CHO cells, the survival rates were no lower than 74% (Table 1A). For 3TC, d4T, ddI and thymidine-exposed NHMEC M99005 cells, survival rates were no lower than 71% (Table 1B). For 3TC, d4T, ddI and thymidine-exposed NHMEC M98040 cells, survival rates were no lower than 72% (Table 1C).
Table I.
Cell survival determined in CHO and NHMEC cells exposed for 24 hr to NRTI or thymidine
| A-CHO cells | ||||||||
|---|---|---|---|---|---|---|---|---|
| Treatment | 3TC | D4T | ddI | Thymidine | ||||
|
| ||||||||
| Dose (μM) | 12.2 | 122.0 | 8.9 | 89.0 | 10.2 | 102.0 | 9.9 | 99.0 |
|
| ||||||||
| % Control | 88 | 74 | 92 | 80 | 92 | 86 | 104 | 101 |
| B - NHMEC strain M99005 | ||||||||
|---|---|---|---|---|---|---|---|---|
| Treatment | 3TC | D4T | ddI | Thymidine | ||||
|
| ||||||||
| Dose (μM) | 12.2 | 122.0 | 8.9 | 89.0 | 10.2 | 102.0 | 9.9 | 99.0 |
|
| ||||||||
| % Control | 77 | 77 | 73 | 71 | 97 | 85 | 96 | 92 |
| C - NHMEC strain M98040 | ||||||||
|---|---|---|---|---|---|---|---|---|
| Treatment | 3TC | D4T | ddI | Thymidine | ||||
|
| ||||||||
| Dose (μM) | 12.2 | 122.0 | 8.9 | 89.0 | 10.2 | 102.0 | 9.9 | 99.0 |
|
| ||||||||
| % Control | 89 | 87 | 73 | 72 | 90 | 89 | 99 | 91 |
Centrosome amplification in CHO cells
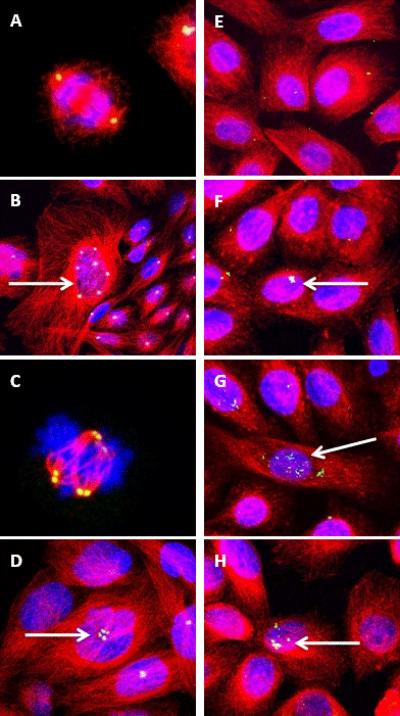
Most unexposed CHO cells contained no more than two centrosomes, resulting in normal bi-polar spindles (Figure 1A), while cells treated with 3TC (Figure 1B), d4T (Figure 1C), and ddI (Figure 1D) showed dose-dependent increases in centrosome amplification. Cells with supernumerary (>2) centrosomes have the ability to form multi-polar spindles during mitosis (Figure 1C).
Figure 1. NRTI-exposed CHO and NHMEC M99005 cells visualized by confocal microscopy.
(A–D): CHO cells incubated with an anti-pericentrin antibody + Alexa-Fluor 488 (green), an anti-β-tubulin antibody + Alexa-Fluor 594 (red), and DAPI for visualizing DNA (blue).
(Colocalization of pericentrin and β-tubulin appears yellow and colocalization of pericentrin, β-tubulin, and DAPI appears white.)
(A): Untreated cell with bipolar spindle in anaphase of mitosis.
(B): Cells treated with 122 μM 3TC; arrow shows cell with amplified centrosomes.
(C): CHO cell treated with 89 μM d4T with multi-polar spindles during anaphase of mitosis.
(D): CHO cells treated with 102 μM ddI. Arrow shows centrosome amplification.
(E–H): NHMEC M99005 cells incubated as in A–D. (Colocalization of pericentrin and β-tubulin appears yellow and colocalization of pericentrin, β-tubulin, and DAPI appears white.)
(E): Untreated NHMECs
(F): NHMECs treated with 122 μM 3TC showing centrosome amplification.
(G): NHMECs treated with 89 μM d4T showing centrosome amplification.
(H): NHMECs treated with 102 μM ddI showing centrosome amplification.
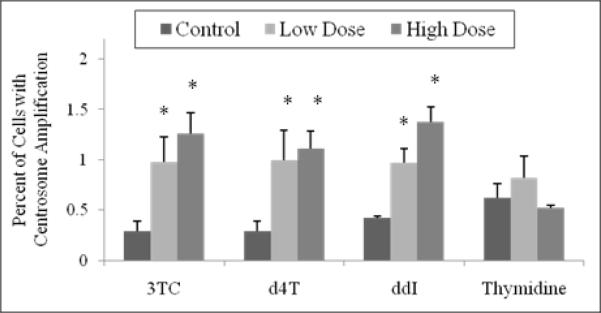
Quantification of centrosome amplification in CHO cells treated with NRTIs (Figure 2) showed an increase in number of cells with centrosome amplification compared to untreated cells. For 3TC, the percentage of cells showing supernumerary centrosomes increased from 0.29% in unexposed cells to 0.98% at 12.2 μM and 1.26% at 122 μM. For d4T, values were 0.29%, 1.0% and 1.11% at 0, 8.9 and 89.0 μM, respectively. For ddI, the values were 0.42%, 0.97% and 1.38% in cells exposed to 0, 10.2 and 102.0 μM, respectively. The high concentration for each compound was significantly (p < 0.05) different compared to the unexposed cells. CHO cells were also treated with 0, 9.9 and 99.0 μM thymidine, yielding 0.62%, 0.82%, and 0.52% of cells with centrosome amplification, respectively.
Figure 2. Percentage of CHO cells exhibiting centrosome amplification.
Cells were incubated with 12.2 μM and 122 μM 3TC, 8.9 μM and 89 μM d4T, 10.2 μM and 102 μM ddI, and 9.9 μM and 99 μM thymidine for 24 hr. Values are based on observation of 1000 cells. The stars indicate groups that are significantly different (p < 0.05) compared to unexposed control cells.
Centrosome amplification in NHMEC strains
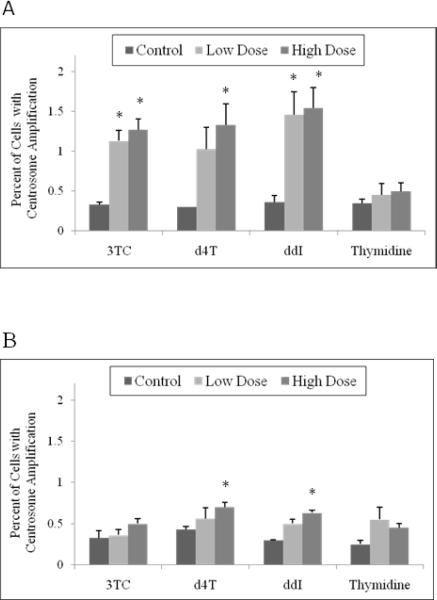
An NRTI-induced increase in centrosome amplification was observed in the NHMEC strain M99005. Untreated cells had no more than two centrosomes/cell (Figure 1E) and NRTI-treated cells showed increased ( >2 centrosomes/cell) centrosome amplification (Figures 1F, 1G, 1H). For 3TC, the percentage of cells with centrosome amplification increased from 0.33% in untreated cells to 1.13% at 12.2 μM and 1.27% at 122.0 μM. For d4T, values were 0.30%, 1.03% and1.33% at 0, 8.9 and 89.0 μM, respectively. For ddI, the values were 0.36%, 1.46%, and 1.54% in cells exposed to 0, 10.2, and 102.0 μM, respectively. All other exposures except for the d4T low concentration, were significantly (p < 0.05) higher than the controls (Figure 3A).
Figure 3. Percentage of NHMEC M99005 cells exhibiting centrosome amplification.
Values were based on observation of 1000 cells. The stars indicate statistical significance (p < 0.05) compared to unexposed control cells of each group.
(A): M99005 cells incubated with the same doses of NRTIs as shown in Figure 2.
(B): M98040 cells incubated with the same doses of NRTIs as shown in Figure 2.
In NHMEC strain M98040, only the high doses of ddI and d4T showed significant (p < 0.05) increases in centrosome amplification. In cells exposed to 3TC, amplification was 0.33% at 0 μM, 0.36% and 0.50% at 12.2 and 122 μM. For d4T, values were 0.43% at 0 μM, 0.56% and 0.70% at 8.9 and 89.0 μM. For ddI, the values were 0.30% for 0 μM, 0.50% and 0.63% at 10.2 and 102.0 μM. (Figure 3B).
Cells of both NHMEC strains were treated with 0, 9.9 and 99 μM thymidine, and no thymidine-induced increase in centrosome amplification was observed in either strain.
Microtubule Nucleation
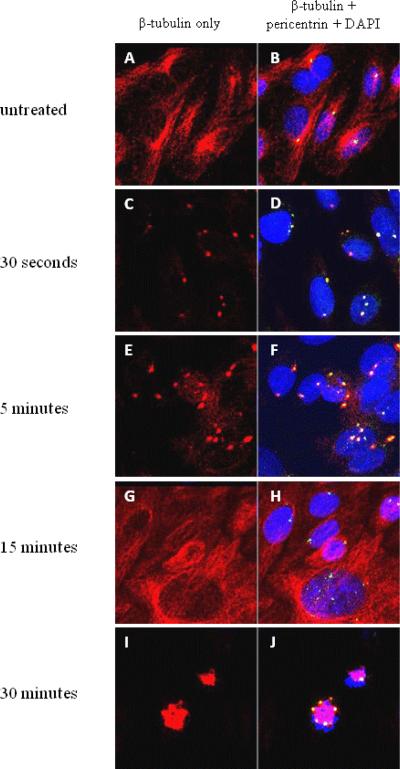
In cells with normal β-tubulin distribution, a cytoplasmic network of red microtubules surrounded the nucleus (Figure 4A, B). Immediately when microtubule polymerization was interrupted by nocodazole, there were no microtubules. However, after nocodazole was removed, microtubule nucleation appeared in the form of asters. In untreated cells, aster formation due to recovery of microtubules occurred as early as 30 seconds after incubation with nocodazole was removed (Figure 4C, D). The asters became progressively larger by 5 minutes (Figure 4E, F) and at 15 minutes, microtubule distribution had almost returned to normal (Figure 4G, H). Microtubule distribution was completely normal by 30 minutes after nocodazole removal (Figure 4I, J). In separate experiments in which cells were treated with each of the NRTIs, the same pattern was observed. Almost all normal and supernumerary centrosomes recovered nucleation function by 30 seconds after nocodazole was removed, and all cells regained normal microtubule distribution by 30 minutes.
Figure 4. Microtubule nucleation of CHO cell centrosomes.
CHO cells incubated with an anti-pericentrin antibody (green), an anti-β-tubulin antibody (red), and DAPI for DNA (blue). (Colocalization of pericentrin and β-tubulin appears yellow and colocalization of pericentrin, β-tubulin, and DAPI appears white.)
(A, B): Untreated CHO cells, without nocodazole incubation.
(C, D): 30 seconds after nocodazole removal. Centrosomes begin to recover microtubule aster formation.
(E, F): 5 minutes after nocodazole removal. Microtubule asters grow larger.
(G, H): 15 minutes after nocodazole removal. Normal microtubule distribution.
(I,J): 30 minutes after nocodazole removal. Cell division with multi-polar spindles.
B-tubulin abnormalities in NHMEC cells
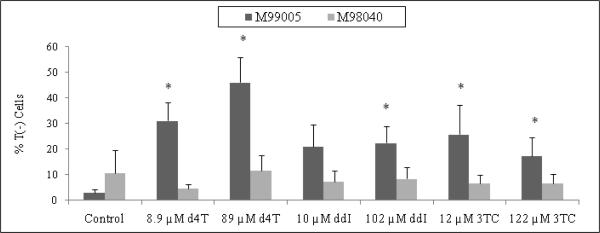
Centrosome amplification was frequently accompanied by other irregularities, including increase in cell size and centrosome fragmentation (data not shown). In addition, NRTI-exposed cells of both NHMEC strains showed subsets of cells lacking the red β-tubulin signal. Cells with normal β-tubulin had a strong cytoplasmic red signal, due to the intensity of the secondary antibody bound to anti-β-tubulin, and were labeled T(+) cells. In contrast, a subset of cells was visualized as lacking β-tubulin, and were labeled as T(−) cells. In M99005 cells, 2.86% of untreated cells were T(−), while values for T(−) cells among the NRTI-exposed cells were as high as 46% (Figure 5). NRTI-exposed M99005 cells exhibited higher numbers of T(−) cells for all treatments when compared to NRTI-exposed M98040 cells. The data suggests that, when treated with an NRTI, the M99005 cells, which are high incorporators of AZT into DNA, are unable to properly polymerize tubulin, but the M98040 cells, which do not incorporate AZT into DNA, have normal tubulin polymerization [Olivero et al., 2008].
Figure 5. Percentage of NHMEC M99005 and M98040 cells with unpolymerized β-tubulin.
Cells were incubated with 12.2 μM and 122 μM 3TC, 8.9 μM and 89 μM d4T, 10.2 μM and 102 μM ddI, and 9.9 μM and 99 μM thymidine for 24 hr. Values were based on observation of approximately 800 cells. The stars indicate statistical significance (p < 0.05) compared to unexposed control cells.
Discussion
In previous studies, we reported that AZT induced centrosome amplification in CHO cells and NHMECs [Borojerdi et al., 2009]. Here, we demonstrate centrosome amplification induced in hamster and human cells by three other NRTIs, 3TC, d4T and ddI. Through the arrest of tubulin polymerization, we showed that the amplified centrosomes are able to participate in spindle formation and contribute to the formation of multi-polar spindles. In addition to centrosome amplification, we observed the absence of polymerized tubulin in some NRTI-exposed NHMECs.
Of the two NHMEC strains chosen, one strain (M99005) incorporates AZT into DNA, but the second strain (M98040) does not. These NHMEC strains have a variable ability to induce thymidine kinase 1, the first enzyme in the metabolic pathway for AZT phosphorylation. Because the M98040 cells do not induce thymidine kinase 1 and do not incorporate AZT into DNA, it is presumed that the damage is associated with inability to polymerize β-tubulin in a normal fashion after exposure to NRTIs [Olivero et al., 2008]. Although 3TC, d4T, and ddI behave in a similar fashion to AZT in halting viral transcription, 3TC and ddI are not phosphorylated by thymidine kinase 1. We do not yet know the degree of NRTI-DNA incorporation for 3TC, d4T, and ddI into NHMECs M99005 and M98040 but experiments to elucidate that are in progress. It is unclear why the degree of NRTI-induced centrosomal damage and T(−) cells appear to depend on the cell's ability to incorporate AZT into DNA. It is possible that M98040 cells have more efficient mechanisms for recognition and removal of the drugs.
In this study, cells were treated with two NRTI concentrations, one at plasma level and one at 10x plasma level. Cells exposed to thymidine only were used to rule out the possibility that a nucleotide pool imbalance may have caused the centrosome amplification. The lack of centrosome amplification with thymidine alone indicates that the NRTI effect is independent of nucleotide pool imbalance. Statistically significant centrosome amplification was found in all NRTI-exposed CHO cells (Figure 3) and M99005 cells (Figure 4A). However, the M98040 strain, which did not incorporate AZT into DNA, showed no increase in centrosome amplification at the plasma-level concentrations (Figure 4B). In cells that experienced centrosome amplification, we saw an increase in aberrant cells that was small, although statistically significant. Through currently unpublished experiments, we have determined that cells experiencing centrosome amplification are fully capable of multi-polar division. Therefore, these cells have the ability to replicate and to become a larger population.
Since not all centrosomes are equal in terms of their microtubule nucleation capacity, there could be multiple scenarios for the fate of amplified centrosomes [Ghadimi et al., 2000]. Active centrosomes can be defined as those able to nucleate microtubules and form spindles for a successful mitosis. Some aberrant centrosomes may be inactive and therefore unable to nucleate microtubules and form spindle poles. To determine if supernumerary centrosomes induced by NRTIs are active, microtubule nucleation of NRTI-treated cells was inhibited with nocodazole, a disruptor of tubulin polymerization[Samson et al., 1979]. This set of experiments revealed that multiple centrosomes induced by NRTIs retained the ability to nucleate tubulin and form asters (Figure 4). These cells have >2 centrosomes with the potential to participate in spindle formation during mitosis and cause mis-segregation of chromosomes and consequently, aneuploidy.
In previous experiments in our laboratory, extracted AZT-treated cells were processed with an anti-β-tubulin antibody and showed a positive signal. Because the detergent extraction step in immunohistochemistry washes away un-polymerized tubulin, it was assumed that the lack of β-tubulin signal observed was based on the cell's inability to polymerize tubulin [Borojerdi et al., 2009]. In addition, NRTI-exposed NHMECs exhibited an abnormal lack of polymerized tubulin in some cells. Cells characterized as unable to polymerize tubulin T(−) were scored, and only NRTI-treated M99005 cells showed significant increases in T(−) cells when compared to untreated controls (Figure 5). Therefore, the ability of a cell to phosphorylate AZT and incorporate AZT into DNA correlates with the ability to successfully polymerize tubulin. By flow-cytometry, we have shown that T(−) cells progress through the cell cycle in a fashion similar to those cells with normal tubulin distribution [Borojerdi et al., 2009]. It is possible that the lack of polymerized microtubules occurred as a cellular response to centrosomal damage. Perhaps what we have observed is due to a stress response similar to that caused by the tumor supressor BRCA1, which blocks γ-tubulin function in an attempt to halt centrosome-based nucleation activity and centrosome reduplication as described in this issue by Dr. Parvin's review article [Parvin, 2009]. However, it is important to note that in M99005, where we saw significant increases in T(−) cells, the increases in NRTI-treated cells showing centrosome amplification were around 1–2% and the increases in T(−) cells were disproportionately large, ranging from 15–45%.
Centrosome amplification has become widely accepted as a mechanism leading to tumorigenesis. The centrosome is key to proper chromosomal segregation in mitosis and affects many other cellular processes related to tumorigenesis such as cytokinesis, cell cycle progression and motility [Saunders, 2005]. Centrosomal defects could result in an increase in centrosome number, excess centrosome volume, excess pericentriolar material, and abnormal microtubule nucleation. This type of abnormality was observed in a study of 35 human breast carcinomas but not in normal tissue [Lingle et al., 1998]. In addition, Bonatti et al. made similar observations on human and hamster cells exposed to the natural compound, rapamycin [Bonatti et al., 2005].
In a normal cell, the centrosome duplicates only once during cell cycle, generating 2 centrosomes. Centrosome amplification, the phenomenon by which a cell generates more than two centrosomes, is a potential cause of genetic instability, but little is known regarding causative mechanisms. If supernumerary centrosomes participate in spindle formation, chromosome mis-segregation will occur. Here, we showed that centrosome amplification is common in cells exposed to the NRTIs: 3TC, d4T, and ddI. In addition, in virtually all NRTI-treated CHO cells with amplified centrosomes, we found the ability to nucleate microtubules and form multi-polar spindles. The NRTIs studied here are not known carcinogens, but this study suggests that they have substantial genotoxic properties. Our next steps are to evaluate the genotoxic characteristics of these drugs and AZT together in the combinations they are usually used in the therapy of AIDS.
Acknowledgments
The authors would like to thank Dr. Ainsley Weston of the National Institute of Occupational Safety and Health, CDC for providing the NHMECs. The work was supported, in part, by the Intramural Research Program of the NIH, National Cancer Institute, Center for Cancer Research
Abbreviations
- 3TC
Lamivudine (2', 3'-dideoxy, 3'-thiacytidine)
- AZT
Azidothymidine (3'-Azido-3'-deoxythymidine)
- CHO
Chinese Hamster Ovary
- D4T
Stavudine (2', 3'-didehydro-3'-deoxythymidine)
- DAPI
4', 6-diamidino-2-phenylindole
- ddI
Didanosine (2', 3'-dideoxyinosine)
- NHMEC
Normal Human Mammary Epithelial Cell
- PBS
Phosphate Buffer Solution
- T (+)
Tubulin Positive
- T (−)
Tubulin Negative
References
- Bonatti S, Simili M, Benedetti PA, Morandi F, Menichini P, Del CR, Barale R, Abbondandolo A. Altered centrosomes in ataxia-telangiectasia cells and rapamycin-treated Chinese hamster cells. Environ Mol Mutagen. 2005;46:164–173. doi: 10.1002/em.20145. [DOI] [PubMed] [Google Scholar]
- Borojerdi JP, Ming J, Cooch C, Ward Y, Semino-Mora C, Yu M, Braun HM, Taylor BJ, Poirier MC, Olivero OA. Centrosomal amplification and aneuploidy induced by the antiretroviral drug AZT in hamster and human cells. Mutation Research. 2009 doi: 10.1016/j.mrfmmm.2009.03.004. [DOI] [PMC free article] [PubMed] [Google Scholar]
- D'Assoro AB, Barrett SL, Folk C, Negron VC, Boeneman K, Busby R, Whitehead C, Stivala F, Lingle WL, Salisbury JL. Amplified centrosomes in breast cancer: a potential indicator of tumor aggressiveness. Breast Cancer Res Treat. 2002;75:25–34. doi: 10.1023/a:1016550619925. [DOI] [PubMed] [Google Scholar]
- Ghadimi BM, Sackett DL, Difilippantonio MJ, Schrock E, Neumann T, Jauho A, Auer G, Ried T. Centrosome amplification and instability occurs exclusively in aneuploid, but not in diploid colorectal cancer cell lines, and correlates with numerical chromosomal aberrations. Genes Chromosomes Cancer. 2000;27:183–190. [PMC free article] [PubMed] [Google Scholar]
- Hinchcliffe EH, Miller FJ, Cham M, Khodjakov A, Sluder G. Requirement of a centrosomal activity for cell cycle progression through G1 into S phase. Science. 2001;291:1547–1550. doi: 10.1126/science.1056866. [DOI] [PubMed] [Google Scholar]
- IARC . Some antiviral and antineoplastic drugs, and other pharmaceutical agents. Vol 76. World Health Organization. International Agency for Research on Cancer; Lyon, France: 2000. Monographs on the Evaluation of Carcinogenic Risks to Humans; pp. 73–127. [Google Scholar]
- Keshava C, Whipkey D, Weston A. Transcriptional signatures of environmentally relevant exposures in normal human mammary epithelial cells: benzo[a]pyrene. Cancer Lett. 2005;221:201–211. doi: 10.1016/j.canlet.2004.08.037. [DOI] [PubMed] [Google Scholar]
- Levine DS, Sanchez CA, Rabinovitch PS, Reid BJ. Formation of the tetraploid intermediate is associated with the development of cells with more than four centrioles in the elastase-simian virus 40 tumor antigen transgenic mouse model of pancreatic cancer. Proc Natl Acad Sci U S A. 1991;88:6427–6431. doi: 10.1073/pnas.88.15.6427. [DOI] [PMC free article] [PubMed] [Google Scholar]
- Lingle WL, Lutz WH, Ingle JN, Maihle NJ, Salisbury JL. Centrosome hypertrophy in human breast tumors: implications for genomic stability and cell polarity. Proc Natl Acad Sci U S A. 1998;95:2950–2955. doi: 10.1073/pnas.95.6.2950. [DOI] [PMC free article] [PubMed] [Google Scholar]
- Nigg EA. Centrosome aberrations: cause or consequence of cancer progression? Nat Rev Cancer. 2002;2:815–825. doi: 10.1038/nrc924. [DOI] [PubMed] [Google Scholar]
- Olivero OA. Mechanisms of genotoxicity of nucleoside reverse transcriptase inhibitors. Environ Mol Mutagen. 2007;48:215–223. doi: 10.1002/em.20195. [DOI] [PubMed] [Google Scholar]
- Olivero OA, Ming JM, Das S, Vazquez IL, Richardson DL, Weston A, Poirier MC. Human inter-individual variability in metabolism and genotoxic response to zidovudine. Toxicol Appl Pharmacol. 2008;228:158–164. doi: 10.1016/j.taap.2007.12.005. [DOI] [PMC free article] [PubMed] [Google Scholar]
- Parvin JD. The BRCA1-dependent ubiquitin ligase, gamma-tubulin, and centrosomes 4. Environ Mol Mutagen. 2009 doi: 10.1002/em.20475. [DOI] [PubMed] [Google Scholar]
- Piel M, Nordberg J, Euteneuer U, Bornens M. Centrosome-dependent exit of cytokinesis in animal cells. Science. 2001;291:1550–1553. doi: 10.1126/science.1057330. [DOI] [PubMed] [Google Scholar]
- Pihan GA, Purohit A, Wallace J, Knecht H, Woda B, Quesenberry P, Doxsey SJ. Centrosome defects and genetic instability in malignant tumors. Cancer Res. 1998;58:3974–3985. [PubMed] [Google Scholar]
- Pihan GA, Purohit A, Wallace J, Malhotra R, Liotta L, Doxsey SJ. Centrosome defects can account for cellular and genetic changes that characterize prostate cancer progression. Cancer Res. 2001;61:2212–2219. [PubMed] [Google Scholar]
- Samson F, Donoso JA, Heller-Bettinger I, Watson D, Himes RH. Nocodazole action on tubulin assembly, axonal ultrastructure and fast axoplasmic transport. J Pharmacol Exp Ther. 1979;208:411–417. [PubMed] [Google Scholar]
- Saunders W. Centrosomal amplification and spindle multipolarity in cancer cells. Semin Cancer Biol. 2005;15:25–32. doi: 10.1016/j.semcancer.2004.09.003. [DOI] [PubMed] [Google Scholar]


