

Abstract
CYP19A1 encodes for aromatase, which irreversibly converts androgens to estrogens; therefore, variation in this gene may affect individual susceptibility to breast cancer and other sex hormone-dependent outcomes. In a case-control study nested within a breast self-examination trial conducted in Shanghai, China, we examined whether ten CYP19A1 polymorphisms (rs1870049, rs1004982, rs28566535, rs936306, rs11636639, rs767199, rs4775936, rs11575899, rs10046, rs4646) were associated with risk of breast cancer and fibrocystic breast conditions. Cases were diagnosed with breast cancer (n=614) or fibrocystic breast conditions (n=465) during 1989–2000. Controls were free of breast disease during the same time period (n=879). Proliferative changes within the extratumoral tissue of women with breast cancer and the lesions of women with fibrocystic conditions were assessed. None of the polymorphisms were associated with overall risk of breast cancer or fibrocystic breast conditions. Differences in breast cancer risk, however, were observed by proliferation status. The risk of breast cancer with (but not without) proliferative fibrocystic conditions was increased among women homozygous for the minor allele of rs1004982 (C), rs28566535 (C), rs936306 (T), and rs4775936 (C), relative to those homozygous for the major allele [age-adjusted odds ratios and 95% confidence intervals, respectively: 2.19 (1.24–3.85), 2.20 (1.27–3.82), 1.94 (1.13–3.30), and 1.95 (1.07–3.58)]. Also, haplotypes inferred using all polymorphisms were not associated with overall risk of either outcome, although some block-specific haplotypes were associated with an increased risk of breast cancer with concurrent proliferative fibrocystic conditions. Our findings suggest that CYP19A1 variation may enhance breast cancer development in some women, but further confirmation is warranted.
Keywords: CYP19A1, polymorphism, breast cancer, fibrocystic breast conditions, Chinese
INTRODUCTION
The critical role of endogenous estrogens in breast cancer etiology is widely accepted (1–3). Increased breast cancer risk has been linked to a number of factors representing greater lifetime exposure to endogenous estrogens, including early age at menarche, late age at first pregnancy, late age at menopause, nulliparity, and obesity. In particular, obesity is accompanied by greater estrogen biosynthesis through the conversion of adrenal androgens to estrogens by the cytochrome P450 enzyme aromatase in adipose tissue, and the aromatization of testosterone to estradiol and of androstenedione to estrone in adipose tissue is the major source of endogenous estrogens for postmenopausal women (4). Although the mechanisms by which estrogens contribute to breast cancer are not entirely clear, one possibility is their positive influence on cell proliferation and signal transduction; another is the genotoxic effects of the catechol estrogens, such as 4-OH estradiol, 4-OH estrone, 16 α-OH estradiol, and 16 α-OH estrone, as well as the reactive free radicals generated during estrogen catabolism (5–7).
Given that aromatase is a key enzyme involved in estrogen biosynthesis, interindividual differences in the CYP19A1 gene, which encodes for aromatase, may alter susceptibility to breast cancer by altering the levels of circulating estrogens. CYP19A1 is located at chromosome 15q21.1 and spans about 123 kb in length. It contains nine coding exons (II-X) and multiple untranslated first exons whose expression are regulated by tissue-specific promoters (8–11). Prior studies examining the associations of selected CYP19A1 variants, including the (TTTA)n repeat (12–27) and TCT insertion/deletion (rs11575899) (14, 17, 23, 27, 28) polymorphisms in intron 4, the nonsynonymous polymorphisms Trp39Arg (rs2236722) in exon 2 (16, 29–31) and Arg264Cys (rs700519) in exon 7 (16, 29, 32), and the C>T (rs10046) polymorphism in the 3’ untranslated region (28, 33, 34), with breast cancer risk have been inconclusive. More systematic investigations, which have employed haplotype-based approaches, have provided more consistent results (27, 35–37), with the most recent suggesting that susceptibility to breast cancer is unrelated to CYP19A1 gene variation (27, 36, 37).
However, fairly consistent evidence has been published linking the (TTTA)n repeat, TCT insertion/deletion, and rs10046 polymorphisms to notable differences in steroid hormone concentrations among postmenopausal, Caucasian women (15, 28, 34, 38). Only one known study has yielded contrary results, suggesting that these CYP19A1 polymorphisms might not be associated with plasma estradiol levels (39). In the most recently published study, single nucleotide polymorphisms (SNPs) tagging the CYP19A1 locus (which included rs10046) were associated with 10% to 20% increases in levels of circulating estradiol and estrone (36).
Fibrocystic breast conditions are comprised of a wide variety of histologic types, including nonproliferative breast disease, proliferative breast disease without atypia, and atypical hyperplasia. Little is known about their etiology, but women with proliferative breast disease (but not atypia) are reported to be almost twice as likely to develop breast cancer as women with non-proliferative breast disease (40–42). The extent to which these benign breast conditions are influenced by genetics has not been well studied.
Herein, we examine a set of CYP19A1 haplotype-tagging SNPs (htSNPs) (rs1870049, rs1004982, rs28566535, rs936306, rs11636639, rs767199, rs4775936, rs11575899, rs10046, and rs4646), previously identified among Caucasians (43), in relation to risk of breast cancer and of fibrocystic breast conditions in a case-control study conducted in Shanghai, China. We also evaluate whether these relationships are modified by histologic evidence of proliferative changes (in non-malignant epithelial tissue), menopausal status, and/or body mass index (BMI).
MATERIALS AND METHODS
Study Design
We conducted a case-control study of participants in a randomized trial of breast self-examination (BSE) that enrolled employees of the Shanghai Textile Industry Bureau (STIB), ages 30–64 years, from 1989 to 1991. A detailed description of the trial, as well as the methods used to select the current study population, are published elsewhere (44–46). Briefly, women who were diagnosed by biopsy with either a benign fibrocystic breast condition between September 1995 and July 2000 (n=622) or breast cancer between November 1989 and July 2000 (n=1,256) at STIB-affiliated hospitals were eligible as cases. Structured in-person interviews were completed for 551 (89% of the 622 eligible) women with fibrocystic breast conditions, of whom 470 provided a blood sample, and for 376 (88% of the 426 eligible) women with breast cancer, of whom 323 provided a blood sample, diagnosed between September 1995 and July 2000. Women in the BSE cohort diagnosed earlier with breast cancer were retrospectively recruited, with preferential selection of the cases under age 45 and an equal number of older cases. Among the 830 women who had developed breast cancer between November 1989 and September 1995, 153 of the 270 cases under age 45 and 147 of the 560 cases ages 45 and above were interviewed and provided a blood sample. Controls were women who were medically served by the same hospitals as the cases, presumably free of clinical breast disease, and randomly selected by matching to the cases on age. Of the 1,071 (75% of the eligible) controls interviewed, 911 provided a blood sample.
For cases diagnosed between September 1995 and July 2000, a single pathologist classified the non-cancerous breast tissue in the benign biopsies and surrounding the malignant tumors, according to the scheme developed by Stalsberg (47). Proliferative conditions included atypical hyperplasia, moderate or florid ductal hyperplasia, and moderate or predominant sclerosing adenosis, and non-proliferative conditions included mild or no ductal hyperplasia, mild or no sclerosing adenosis, and no atypia. The minimum requirement for classification was five scanning power fields containing benign epithelial breast tissue, excluding areas of fibroadenoma. About 75% of the genotyped women with breast cancer and 72% of the genotyped women with fibrocystic breast conditions diagnosed from September 1995 onward had sufficient tissue samples to assess proliferation status.
All participants provided their informed consent prior to interview. The study was approved by the Institutional Review Board of the Fred Hutchinson Cancer Research Center, the Station for Prevention and Treatment of Cancer of the STIB (in accordance with an assurance filed with the Office for Human Research Protections of the U.S. Department of Health and Human Services), and the Human Genetic Resources Administration Office of China.
Comparison of the D’ linkage disequilibrium (LD) patterns of the CYP19A1 gene between CEPH (Centre d’Etude du Polymorphism Humain) and Han Chinese populations
We created separate D’ LD plots of the CYP19A1 gene for the CEPH (Utah residents of northern and western European ancestry) and Han Chinese using the Genome Variation Server (GVS, version 2.05, http://pga.gs.washington.edu/), in order to examine the similarities and differences in the LD pattern of CYP19A1 between these two populations and to evaluate the suitability of carrying out our study using the htSNPs characterized in a Caucasian population by Paynter et al(43). We excluded one of the identified htSNPs, rs2008691, that has been mismapped. Only SNP data on the unrelated individuals from the CEPH and Han Chinese populations of the International HapMap Project (http://www.hapmap.org) were used (NCBI build 36, dbSNP build 126). The base pair range of 22,466 bp upstream to 29,500 bp downstream of the CYP19A1 gene was selected to match the SNP range of the LD plot published by Haiman et al (35).
Genotyping
Genomic DNA was isolated from buffy coat using a salt-precipitation (48) and/or phenol-chloroform method (49, 50). Genotyping was primarily conducted using buffy coat DNA, but when buffy coat DNA yield was inadequate, genomic DNA was subsequently isolated from whole blood using the QIAamp® DNA Blood Midi Kit (Qiagen, Alameda, CA). In addition, genotyping was conducted using genomic DNA isolated from whole blood when genotyping results from buffy coat DNA for a set of microsatellite polymorphisms indicated possible sample contamination. A total of 43 women (eight with breast cancer, three with fibrocystic breast conditions, and 32 controls) had mismatched genotyping results between paired buffy coat and whole blood aliquot DNA samples and were omitted from the analyses, as were three women (one with breast cancer and two with fibrocystic breast conditions) who were not genotyped due to insufficient amounts of DNA.
Applied Biosystems (ABI) TaqMan assays were used for rs1870049, rs1004982, rs28566535, rs936306, rs11636639, rs767199, and rs4775936. These assays were validated by genotyping and sequencing several in-house samples. The remaining three SNPs were assayed in a single SNaPshot reaction. SNPs rs10046 and rs4646 were coamplified with the forward and reverse primers 5’-CTG GAA CAC TAG AGA AGG CTG GTC AGT ACC-3’ and 5’-TTG TAG CCT GGT TCT CTG GTG TGA A-3’. SNP rs11575899 was amplified with the forward and reverse primers 5’-GCA TCG GTA TGC ATG AGA AA-3’ and 5’-AAA AGG CAC ATT CAT AGA CAA AA-3’. The respective SNaPshot probes were: rs10046: 5’-GAT GAG AAA TGC TCC AGA GT-3’; rs4646: 5’-CAC CAA GCT AGG TGC TAT T-3’; and rs11575899: 5’-AGG TAC TTA GTT AGC TAC AAT CTT-3’. In-house DNA samples of known genotypes were used as positive controls. Negative controls were prepared identically, but without template. Laboratory personnel were blinded to the case-control status of the samples.
Data Analysis
Departure from Hardy-Weinberg equilibrium among the controls was assessed using the chi-square test. Age-adjusted odds ratios (OR) and 95% confidence intervals (CI) for the genotypes of each polymorphism related to breast cancer and to fibrocystic breast conditions were calculated from unconditional logistic regression models in Stata® 9 (StataCorp, College Station, TX). Haplotype frequencies were estimated using the expectation-maximization algorithm, and age-adjusted differences in haplotype frequencies by case-control status were evaluated using the global score test. To further assess haplotype associations with breast cancer and fibrocystic breast conditions, age-adjusted ORs and 95% CIs for inferred haplotypes were calculated. Each of the less common haplotypes was compared to the most common haplotype, adjusted for the effects of the other haplotypes; an additive genetic model, which implicitly assumes the effect of two copies of a given haplotype is twice that of a single copy, was used. All haplotype analyses were conducted in R version 2.6.1 (http://www.R-project.org) with the haplo.stats package (51). Stratified analyses were also performed to evaluate whether the risk of breast cancer or fibrocystic breast conditions associated with each htSNP or haplotype differed by histologic evidence of proliferation in the non-cancerous epithelium (non-proliferative, proliferative), menopausal status (premenopausal, postmenopausal), or BMI (dichotomized using the median value of 23.0 kg/m2 among control subjects).
RESULTS
As shown in Figure 1, the LD patterns at the CYP19A1 locus were generally similar for Han Chinese and CEPH individuals. Utilizing the HapMap data, which currently includes seven of the ten polymorphisms that were genotyped, we estimated post hoc the amount of genetic variation captured by these seven polymorphisms across the 189.4-kb region specified by Haiman et al. (35), separately for Han Chinese and CEPH individuals, using the Tagger program in Haploview 4.0 (http://www.broad.mit.edu/mpg/haploview). With a minimum minor allele frequency of 5% and r2 threshold of 0.8, the seven polymorphisms (when defined as tag SNPs, not htSNPs) captured 48 of the 207 (23.2%) alleles in Han Chinese individuals and 55 of the 209 (26.3%) alleles in CEPH individuals. The amount of genetic variation represented by the remaining three polymorphisms could not be quantified, but it is unlikely to differ considerably between the two ethnic groups.
Figure 1. CYP19A1 linkage disequilibrium patterns in the HapMap CEPH and Han Chinese populations.
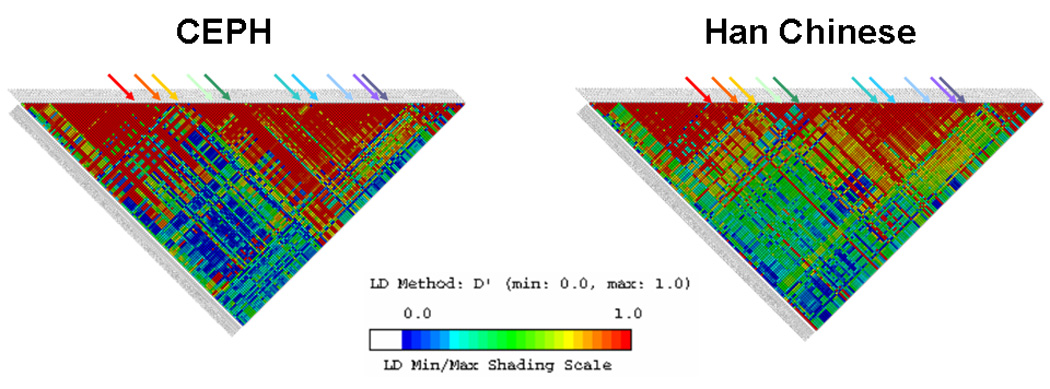
SNPs range from rs2445781 (chromosome pos: 49440552) to rs1122044 (chromosome pos: 49259537). SNPs shown have a minor allele frequency of > 5% in both HapMap CEPH and Han Chinese populations.
Quality control checks of the genotyping data were also conducted. Among control subjects, all polymorphisms were in Hardy-Weinberg equilibrium. The proportion of positive control samples with genotype calls ranged from 64.6% to 95.8%; three polymorphisms had genotype calls below 90% (64.4% for rs1004982, 83.7% for rs1870049, and 85.0% for rs4775936). For each polymorphism, however, all genotyping calls were 100% concordant with the known genotypes of the control samples.
No overall associations were found between any of the CYP19A1 variants and risk of either breast cancer or fibrocystic breast conditions (Table 1). These results remained unchanged when the prevalent breast cancer cases (i.e., cases diagnosed prior to September 1995) were excluded from the analysis. Stratifying by proliferation status, the risk of breast cancer was elevated among those women with concurrent proliferation in the extratumoral epithelium who carried two (vs. no) copies of the variant allele for rs1004982, rs28566535, rs936306, and rs4775936. In light of this observation, we additionally compared those women with breast cancer with concurrent proliferative fibrocystic conditions to women with proliferative fibrocystic conditions only, in order to estimate the risk of progression to breast cancer associated with these four CYP19A1 variants. The corresponding age-adjusted odds ratios associated with the homozygous variant genotype were 1.63 (95% CI: 0.78, 3.40) for rs1004982, 2.05 (95% CI: 0.96, 4.37) for rs28566535, 2.22 (95% CI: 1.03, 4.75) for rs936306, and 1.68 (95% CI: 0.81, 3.48) for rs4775936. There was suggestive evidence of an increased risk of breast cancer in postmenopausal, but not premenopausal women who carried two (vs. no) copies of the variant allele for rs28566535 (CC vs. AA: OR=1.63, 95% CI: 0.97, 2.74 for postmenopausal women; OR=0.83, 95% CI: 0.51, 1.38 for premenopausal women) and rs10046 (CC vs. TT: OR=1.35, 95% CI: 0.99, 2.45 for postmenopausal women; OR=0.91, 95% CI: 0.59, 1.39 for premenopausal women), and no evidence of effect modification by BMI (data not shown). The risk of fibrocystic breast conditions did not vary by proliferation status, menopausal status, or BMI.
Table 1.
Age-adjusted ORs and 95% CIs for CYP19A1 genotypes and risk of breast cancer and fibrocystic conditions, by proliferative status
| Breast cancer | Fibrocystic conditions | ||||||||||||||||||
|---|---|---|---|---|---|---|---|---|---|---|---|---|---|---|---|---|---|---|---|
| Controls | All | With non-proliferative fibrocystic conditions |
With proliferative fibrocystic conditions |
All | Non-proliferative | Proliferative | |||||||||||||
| n | n | OR | 95% CI | n | OR | 95% CI | n | OR | 95% CI | n | OR | 95% CI | n | OR | 95% CI | n | OR | 95% CI | |
| Block 1 SNPs | |||||||||||||||||||
| rs1870049 | |||||||||||||||||||
| TT | 548 | 371 | 1.00 | (ref) | 75 | 1.00 | (ref) | 67 | 1.00 | (ref) | 278 | 1.00 | (ref) | 99 | 1.00 | (ref) | 117 | 1.00 | (ref) |
| CT | 292 | 211 | 1.06 | (0.85–1.33) | 44 | 1.08 | (0.73–1.62) | 41 | 1.14 | (0.75–1.72) | 154 | 1.05 | (0.82–1.35) | 44 | 0.85 | (0.58–1.25) | 55 | 0.90 | (0.63–1.29) |
| CC | 38 | 30 | 1.18 | (0.72–1.94) | 5 | 1.02 | (0.39–2.69) | 8 | 1.78 | (0.79–3.98) | 32 | 1.48 | (0.89–2.43) | 11 | 1.38 | (0.68–2.82) | 10 | 1.12 | (0.54–2.33) |
| rs1004982 | |||||||||||||||||||
| TT | 410 | 291 | 1.00 | (ref) | 61 | 1.00 | (ref) | 44 | 1.00 | (ref) | 208 | 1.00 | (ref) | 75 | 1.00 | (ref) | 81 | 1.00 | (ref) |
| CT | 371 | 245 | 0.92 | (0.74–1.15) | 51 | 0.90 | (0.60–1.34) | 48 | 1.18 | (0.77–1.82) | 193 | 1.05 | (0.82–1.34) | 58 | 0.89 | (0.61–1.30) | 79 | 1.11 | (0.79–1.57) |
| CC | 90 | 72 | 1.13 | (0.80–1.60) | 12 | 0.93 | (0.48–1.80) | 21 | 2.19 | (1.24–3.85) | 63 | 1.31 | (0.91–1.90) | 21 | 1.21 | (0.70–2.08) | 21 | 1.15 | (0.67–1.97) |
| Block 2 SNPs | |||||||||||||||||||
| rs28566535 | |||||||||||||||||||
| AA | 404 | 278 | 1.00 | (ref) | 55 | 1.00 | (ref) | 45 | 1.00 | (ref) | 203 | 1.00 | (ref) | 73 | 1.00 | (ref) | 80 | 1.00 | (ref) |
| AC | 370 | 259 | 1.01 | (0.81–1.26) | 59 | 1.14 | (0.77–1.70) | 45 | 1.08 | (0.70–1.67) | 203 | 1.10 | (0.86–1.41) | 63 | 0.97 | (0.67–1.40) | 84 | 1.18 | (0.84–1.66) |
| CC | 94 | 71 | 1.09 | (0.78–1.54) | 11 | 0.87 | (0.44–1.72) | 23 | 2.20 | (1.27–3.82) | 55 | 1.10 | (0.75–1.61) | 18 | 1.01 | (0.57–1.77) | 17 | 0.89 | (0.50–1.58) |
| rs936306 | |||||||||||||||||||
| CC | 405 | 279 | 1.00 | (ref) | 58 | 1.00 | (ref) | 49 | 1.00 | (ref) | 205 | 1.00 | (ref) | 75 | 1.00 | (ref) | 80 | 1.00 | (ref) |
| CT | 368 | 257 | 1.01 | (0.81–1.26) | 54 | 1.00 | (0.67–1.48) | 42 | 0.93 | (0.60–1.44) | 208 | 1.15 | (0.90–1.47) | 59 | 0.91 | (0.62–1.32) | 87 | 1.24 | (0.88–1.74) |
| TT | 102 | 77 | 1.09 | (0.78–1.52) | 13 | 0.88 | (0.47–1.68) | 24 | 1.94 | (1.13–3.30) | 52 | 0.99 | (0.67–1.44) | 20 | 1.04 | (0.60–1.79) | 15 | 0.74 | (0.41–1.35) |
| Block 3 SNP | |||||||||||||||||||
| rs11636639 | |||||||||||||||||||
| GG | 244 | 173 | 1.00 | (ref) | 34 | 1.00 | (ref) | 31 | 1.00 | (ref) | 131 | 1.00 | (ref) | 44 | 1.00 | (ref) | 51 | 1.00 | (ref) |
| GT | 410 | 289 | 1.00 | (0.78–1.28) | 54 | 0.97 | (0.61–1.53) | 59 | 1.14 | (0.71–1.80) | 213 | 0.94 | (0.72–1.24) | 65 | 0.87 | (0.57–1.32) | 89 | 1.03 | (0.70–1.50) |
| TT | 198 | 140 | 1.01 | (0.75–1.35) | 32 | 1.24 | (0.74–2.10) | 25 | 1.02 | (0.58–1.80) | 110 | 0.97 | (0.70–1.34) | 40 | 1.07 | (0.67–1.72) | 38 | 0.87 | (0.55–1.39) |
| Block 4 SNPs | |||||||||||||||||||
| rs767199 | |||||||||||||||||||
| AA | 185 | 126 | 1.00 | (ref) | 31 | 1.00 | (ref) | 17 | 1.00 | (ref) | 97 | 1.00 | (ref) | 36 | 1.00 | (ref) | 34 | 1.00 | (ref) |
| AG | 438 | 294 | 0.98 | (0.75–1.28) | 57 | 0.76 | (0.47–1.21) | 59 | 1.45 | (0.82–2.55) | 219 | 0.98 | (0.72–1.32) | 68 | 0.83 | (0.53–1.29) | 88 | 1.12 | (0.72–1.73) |
| GG | 255 | 191 | 1.10 | (0.82–1.47) | 37 | 0.86 | (0.51–1.44) | 38 | 1.61 | (0.88–2.94) | 149 | 1.13 | (0.82–1.57) | 50 | 1.02 | (0.63–1.63) | 60 | 1.32 | (0.83–2.10) |
| rs4775936 | |||||||||||||||||||
| TT | 174 | 114 | 1.00 | (ref) | 27 | 1.00 | (ref) | 16 | 1.00 | (ref) | 100 | 1.00 | (ref) | 36 | 1.00 | (ref) | 38 | 1.00 | (ref) |
| CT | 459 | 302 | 1.00 | (0.76–1.32) | 52 | 0.71 | (0.43–1.16) | 55 | 1.28 | (0.71–2.30) | 221 | 0.86 | (0.64–1.16) | 65 | 0.71 | (0.46–1.12) | 89 | 0.92 | (0.61–1.41) |
| CC | 243 | 196 | 1.23 | (0.91–1.66) | 46 | 1.21 | (0.72–2.02) | 44 | 1.95 | (1.07–3.58) | 144 | 1.03 | (0.74–1.43) | 53 | 1.03 | (0.64–1.66) | 55 | 1.05 | (0.66–1.66) |
| rs11575899 | |||||||||||||||||||
| INS/INS | 453 | 309 | 1.00 | (ref) | 66 | 1.00 | (ref) | 57 | 1.00 | (ref) | 247 | 1.00 | (ref) | 81 | 1.00 | (ref) | 92 | 1.00 | (ref) |
| INS/DEL | 358 | 252 | 1.03 | (0.83–1.28) | 52 | 1.01 | (0.68–1.49) | 45 | 1.01 | (0.66–1.52) | 174 | 0.87 | (0.68–1.11) | 57 | 0.87 | (0.60–1.26) | 71 | 0.96 | (0.68–1.35) |
| DEL/DEL | 65 | 50 | 1.14 | (0.76–1.69) | 7 | 0.76 | (0.34–1.74) | 12 | 1.50 | (0.76–2.95) | 42 | 1.12 | (0.73–1.72) | 15 | 1.21 | (0.65–2.24) | 18 | 1.25 | (0.71–2.23) |
| rs10046 | |||||||||||||||||||
| TT | 277 | 178 | 1.00 | (ref) | 46 | 1.00 | (ref) | 30 | 1.00 | (ref) | 152 | 1.00 | (ref) | 55 | 1.00 | (ref) | 54 | 1.00 | (ref) |
| CT | 436 | 308 | 1.10 | (0.86–1.39) | 52 | 0.71 | (0.47–1.09) | 67 | 1.41 | (0.89–2.22) | 210 | 0.88 | (0.67–1.14) | 62 | 0.72 | (0.48–1.07) | 84 | 0.99 | (0.68–1.45) |
| CC | 163 | 125 | 1.19 | (0.88–1.61) | 27 | 1.01 | (0.60–1.69) | 17 | 0.97 | (0.52–1.81) | 99 | 1.08 | (0.78–1.50) | 34 | 0.99 | (0.62–1.60) | 43 | 1.34 | (0.86–2.10) |
| rs4646 | |||||||||||||||||||
| GG | 441 | 298 | 1.00 | (ref) | 64 | 1.00 | (ref) | 56 | 1.00 | (ref) | 240 | 1.00 | (ref) | 81 | 1.00 | (ref) | 87 | 1.00 | (ref) |
| GT | 358 | 260 | 1.08 | (0.87–1.34) | 53 | 1.04 | (0.70–1.53) | 50 | 1.10 | (0.73–1.65) | 177 | 0.89 | (0.70–1.14) | 57 | 0.85 | (0.59–1.24) | 72 | 1.01 | (0.71–1.42) |
| TT | 77 | 53 | 1.03 | (0.70–1.50) | 8 | 0.75 | (0.34–1.62) | 8 | 0.83 | (0.38–1.82) | 45 | 1.03 | (0.68–1.54) | 14 | 0.92 | (0.49–1.72) | 22 | 1.36 | (0.80–2.32) |
Inferring haplotypes using unphased genotype data for all ten SNPs, we observed six common haplotypes that occurred at a frequency of 5% or greater in the control group or either case group. The frequencies of each haplotype for both case groups were similar to the control group, and none of the haplotypes were associated with overall risk of breast cancer or fibrocystic breast conditions. When we examined haplotypes by block structure as previously characterized by Haiman et al. (35), we again noted no associations with individual block-specific haplotypes (range of global score test p-values: 0.31 to 0.87). However, as shown in Table 2 and akin to the SNP-based analysis, we observed an elevated risk of breast cancer in women with concurrent proliferative fibrocystic conditions carrying the haplotypes TC (vs. TT) for rs1870049 and rs1004982 in block 1; CC (vs. AC) for rs28566535 and rs936306 in block 2; and GCITG and GCDTG (vs. ATITG) for rs767199, rs4775936, rs11575899, rs10046, and rs4646 in block 4. Each of these haplotypes included at least one variant allele of the four SNPs found to confer risk. The p-values of the global score test for blocks 1, 2, and 4 were 0.11, 0.007, and 0.055, respectively, when the analysis was limited to this subgroup of breast cancer cases.
Table 2.
Age-adjusted ORs and 95% CIs for CYP19A1 haplotypes and risk of breast cancer and fibrocystic conditions, by proliferative status
| Breast cancer | Fibrocystic Breast Conditions | ||||||||||||||
|---|---|---|---|---|---|---|---|---|---|---|---|---|---|---|---|
| Control | Overall | With non-proliferative fibrocystic conditions |
With proliferative fibrocystic conditions |
Control | Overall | Non-proliferative | Proliferative | ||||||||
| Haplotype | Freq. | Freq.* | OR (95% CI) | Freq.* | OR (95% CI) | Freq.* | OR (95% CI) | Freq. | Freq.* | OR (95% CI) | Freq.* | OR (95% CI) | Freq.* | OR (95% CI) | |
| Block 1 (rs1870049, rs1004982) | |||||||||||||||
| 00 | TT | 0.67 | 0.67 | 1.00 (ref) | 0.68 | 1.00 (ref) | 0.60 | 1.00 (ref) | 0.67 | 0.64 | 1.00 (ref) | 0.66 | 1.00 (ref) | 0.65 | 1.00 (ref) |
| 11 | CC | 0.20 | 0.21 | 1.07 (0.89,1.28) | 0.21 | 1.02 (0.73,1.44) | 0.24 | 1.36 (0.97,1.91) | 0.20 | 0.22 | 1.13 (0.92,1.38) | 0.20 | 1.00 (0.73,1.36) | 0.19 | 0.99 (0.74,1.34) |
| 01 | TC | 0.12 | 0.11 | 0.94 (0.74,1.18) | 0.10 | 0.84 (0.53,1.31) | 0.16 | 1.45 (0.98,2.15) | 0.12 | 0.12 | 1.12 (0.87,1.44) | 0.12 | 1.11 (0.77,1.61) | 0.14 | 1.26 (0.91,1.75) |
| 10 | CT | 0.01 | 0.01 | 0.97 (0.47,2.02) | 0.01 | 1.21 (0.39,3.81) | 0.01 | 0.57 (0.08,3.91) | 0.01 | 0.01 | 1.37 (0.68,2.78) | 0.01 | 1.32 (0.50,3.47) | 0.01 | 1.22 (0.45,3.34) |
| Block 2 (rs28566535, rs93636) | |||||||||||||||
| 00 | AC | 0.66 | 0.64 | 1.00 (ref) | 0.66 | 1.00 (ref) | 0.57 | 1.00 (ref) | 0.66 | 0.65 | 1.00 (ref) | 0.66 | 1.00 (ref) | 0.66 | 1.00 (ref) |
| 11 | CT | 0.31 | 0.31 | 1.02 (0.87,1.20) | 0.30 | 0.98 (0.73,1.31) | 0.36 | 1.35 (1.01,1.81) | 0.31 | 0.32 | 1.05 (0.89,1.25) | 0.30 | 0.99 (0.76,1.28) | 0.31 | 1.01 (0.79,1.29) |
| 01 | AT | 0.02 | 0.03 | 1.36 (0.88,2.12) | 0.02 | 0.99 (0.41,2.37) | 0.03 | 1.64 (0.78,3.47) | 0.02 | 0.02 | 0.86 (0.48,1.56) | 0.02 | 1.09 (0.48,2.46) | 0.01 | 0.49 (0.15,1.53) |
| 10 | CC | 0.01 | 0.02 | 1.44 (0.85,2.43) | 0.02 | 1.66 (0.70,3.93) | 0.04 | 2.81 (1.37,5.77) | 0.01 | 0.02 | 1.10 (0.60,1.99) | 0.02 | 1.21 (0.52,2.80) | 0.01 | 0.89 (0.35,2.26) |
| Block 3 (rs11636639) | |||||||||||||||
| 0 | G | 0.53 | 0.53 | 1.00 (ref) | 0.51 | 1.00 (ref) | 0.53 | 1.00 (ref) | 0.53 | 0.52 | 1.00 (ref) | 0.51 | 1.00 (ref) | 0.54 | 1.00 (ref) |
| 1 | T | 0.47 | 0.47 | 1.01 (0.87,1.17) | 0.49 | 1.12 (0.85,1.46) | 0.47 | 1.02 (0.77,1.34) | 0.47 | 0.48 | 0.98 (0.83,1.16) | 0.49 | 1.03 (0.80,1.32) | 0.46 | 0.94 (0.75,1.18) |
| Block 4 (rs767199, rs4775936, rs11575899 (ins-del), rs10046, rs4646) | |||||||||||||||
| 00000 | ATITG | 0.41 | 0.39 | 1.00 (ref) | 0.41 | 1.00 (ref) | 0.35 | 1.00 (ref) | 0.41 | 0.40 | 1.00 (ref) | 0.42 | 1.00 (ref) | 0.40 | 1.00 (ref) |
| 11111 | CGDCT | 0.24 | 0.25 | 1.09 (0.90,1.32) | 0.23 | 1.01 (0.71,1.44) | 0.23 | 1.16 (0.79,1.70) | 0.24 | 0.24 | 1.00 (0.81,1.24) | 0.26 | 1.04 (0.76,1.42) | 0.25 | 1.09 (0.81,1.46) |
| 11010 | GCICG | 0.13 | 0.14 | 1.12 (0.89,1.42) | 0.14 | 1.07 (0.70,1.62) | 0.13 | 1.20 (0.76,1.90) | 0.13 | 0.14 | 1.08 (0.83,1.39) | 0.14 | 1.04 (0.71,1.53) | 0.13 | 1.07 (0.74,1.55) |
| 11000 | GCITG | 0.08 | 0.08 | 0.97 (0.73,1.30) | 0.07 | 0.87 (0.50,1.51) | 0.12 | 1.72 (1.06,2.80) | 0.08 | 0.10 | 1.33 (0.98,1.81) | 0.10 | 1.32 (0.84,2.07) | 0.10 | 1.38 (0.90,2.11) |
| 01000 | ACITG | 0.03 | 0.04 | 1.25 (0.84,1.86) | 0.06 | 1.87 (1.07,3.26) | 0.03 | 1.37 (0.64,2.93) | 0.02 | 0.02 | 0.68 (0.41,1.15) | 0.02 | 0.70 (0.32,1.54) | 0.01 | 0.21 (0.05,0.86) |
| 11011 | GCICT | 0.03 | 0.03 | 1.33 (0.85,2.08) | 0.04 | 1.54 (0.73,3.26) | 0.03 | 1.68 (0.74,3.85) | 0.03 | 0.02 | 0.85 (0.47,1.53) | 0.01 | 0.27 (0.06,1.20) | 0.03 | 1.13 (0.53,2.39) |
| 10000 | GTITG | 0.02 | 0.02 | 1.12 (0.69,1.80) | 0.01 | 0.58 (0.17,1.95) | 0.01 | 0.79 (0.25,2.46) | 0.02 | 0.02 | 0.86 (0.48,1.56) | 0.01 | 0.61 (0.20,1.88) | 0.02 | 0.86 (0.37,2.01) |
| 11100 | GCDTG | 0.01 | 0.02 | 1.56 (0.86,2.80) | 0.01 | 1.66 (0.60,4.57) | 0.04 | 3.54 (1.59,7.89) | 0.01 | 0.01 | 0.96 (0.45,2.02) | 0.01 | 0.88 (0.28,2.74) | 0.01 | 0.40 (0.09,1.71) |
| 10111 | CTDCT | 0.01 | 0.01 | 1.03 (0.51,2.09) | 0.01 | 0.65 (0.16,2.70) | 0.01 | 1.02 (0.38,2.77) | |||||||
| Others | 0.04 | 0.04 | 0.02 | 0.05 | 0.04 | 0.03 | 0.02 | 0.04 | |||||||
All p-values of the global score test were greater than 0.05, except for block 2 when restricted to breast cancer cases with concurrent proliferative fibrocystic conditions (p=0.007).
Given these observations, we further explored whether the associations might be modified by menopausal status or BMI among breast cancer cases with concurrent proliferative fibrocystic conditions. Although the number of cases and controls in these strata were extremely small, the same patterns of SNP and haplotype-based results were generally limited to women who were postmenopausal or who had a higher BMI; the one exception was the GCDTG haplotype in block 4, which corresponded to increased risks in premenopausal women and women with a BMI <23.0 kg/m2 (Table 3 and Table 4).
Table 3.
Age-adjusted ORs and 95% CIs for CYP19A1 genotypes and risk of breast cancer with proliferative fibrocystic conditions, by menopausal status and BMI
| By menopausal status | By BMI | |||||||||||||||
|---|---|---|---|---|---|---|---|---|---|---|---|---|---|---|---|---|
| Controls | Breast cancer cases with proliferative fibrocystic conditions |
Controls | Breast cancer cases with proliferative fibrocystic conditions |
|||||||||||||
| Pre | Post | Premenopausal | Postmenopausal | <23 | 23+ | <23 kg/m2 | 23+ kg/m2 | |||||||||
| n | n | n | OR | 95% CI | n | OR | 95% CI | n | n | n | OR | 95% CI | n | OR | 95% CI | |
| Block 1 | ||||||||||||||||
| rs1870049 | ||||||||||||||||
| TT | 333 | 215 | 41 | 1.00 | (ref) | 26 | 1.00 | (ref) | 242 | 306 | 25 | 1.00 | (ref) | 41 | 1.00 | (ref) |
| CT | 166 | 126 | 21 | 1.04 | (0.60–1.82) | 20 | 1.30 | (0.70–2.42) | 127 | 165 | 13 | 0.98 | (0.48–1.99) | 28 | 1.26 | (0.75–2.12) |
| CC | 29 | 9 | 6 | 1.64 | (0.64–4.19) | 2 | 1.90 | (0.39–9.34) | 16 | 22 | 4 | 2.42 | (0.75–7.82) | 4 | 1.41 | (0.46–4.33) |
| rs1870049 | ||||||||||||||||
| TT | 256 | 154 | 30 | 1.00 | (ref) | 14 | 1.00 | (ref) | 186 | 224 | 21 | 1.00 | (ref) | 22 | 1.00 | (ref) |
| CT | 210 | 161 | 25 | 1.03 | (0.58–1.80) | 23 | 1.54 | (0.76–3.10) | 161 | 210 | 11 | 0.59 | (0.28–1.27) | 37 | 1.78 | (1.01–3.11) |
| CC | 59 | 31 | 11 | 1.53 | (0.72–3.25) | 10 | 3.66 | (1.48–9.02) | 35 | 55 | 9 | 2.29 | (0.97–5.42) | 12 | 2.23 | (1.04–4.78) |
| Block 2 | ||||||||||||||||
| rs28566535 | ||||||||||||||||
| AA | 245 | 159 | 28 | 1.00 | (ref) | 17 | 1.00 | (ref) | 187 | 217 | 20 | 1.00 | (ref) | 25 | 1.00 | (ref) |
| AC | 214 | 156 | 29 | 1.16 | (0.67–2.02) | 16 | 0.93 | (0.46–1.92) | 160 | 210 | 14 | 0.81 | (0.40–1.66) | 30 | 1.23 | (0.70–2.17) |
| CC | 63 | 31 | 10 | 1.33 | (0.61–2.89) | 13 | 4.03 | (1.77–9.18) | 33 | 61 | 8 | 2.27 | (0.92–5.59) | 15 | 2.15 | (1.07–4.33) |
| rs936306 | ||||||||||||||||
| CC | 250 | 155 | 29 | 1.00 | (ref) | 20 | 1.00 | (ref) | 185 | 220 | 20 | 1.00 | (ref) | 29 | 1.00 | (ref) |
| CT | 212 | 156 | 28 | 1.11 | (0.64–1.93) | 14 | 0.68 | (0.33–1.39) | 161 | 207 | 15 | 0.86 | (0.42–1.73) | 26 | 0.94 | (0.54–1.66) |
| TT | 65 | 37 | 10 | 1.27 | (0.59–2.75) | 14 | 3.00 | (1.38–6.51) | 38 | 64 | 7 | 1.71 | (0.67–4.33) | 17 | 2.01 | (1.04–3.89) |
| Block 3 | ||||||||||||||||
| rs11636639 | ||||||||||||||||
| GG | 145 | 99 | 18 | 1.00 | (ref) | 13 | 1.00 | (ref) | 102 | 142 | 13 | 1.00 | (ref) | 17 | 1.00 | (ref) |
| GT | 243 | 167 | 33 | 1.15 | (0.62–2.14) | 26 | 1.18 | (0.58–2.40) | 184 | 226 | 20 | 0.86 | (0.41–1.82) | 39 | 1.42 | (0.77–2.61) |
| TT | 130 | 68 | 16 | 1.00 | (0.49–2.04) | 9 | 1.08 | (0.43–2.69) | 91 | 107 | 9 | 0.79 | (0.32–1.95) | 16 | 1.27 | (0.61–2.63) |
| Block 4 | ||||||||||||||||
| rs767199 | ||||||||||||||||
| AA | 116 | 69 | 12 | 1.00 | (ref) | 5 | 1.00 | (ref) | 80 | 105 | 8 | 1.00 | (ref) | 9 | 1.00 | (ref) |
| AG | 254 | 184 | 36 | 1.44 | (0.72–2.89) | 23 | 1.69 | (0.62–4.63) | 198 | 240 | 24 | 1.21 | (0.52–2.81) | 35 | 1.68 | (0.78–3.62) |
| GG | 158 | 97 | 19 | 1.16 | (0.54–2.49) | 19 | 2.65 | (0.94–7.46) | 107 | 148 | 10 | 0.93 | (0.35–2.47) | 27 | 2.12 | (0.96–4.69) |
| rs4775936 | ||||||||||||||||
| TT | 110 | 64 | 12 | 1.00 | (ref) | 4 | 1.00 | (ref) | 73 | 101 | 6 | 1.00 | (ref) | 10 | 1.00 | (ref) |
| CT | 262 | 197 | 31 | 1.10 | (0.55–2.23) | 24 | 1.91 | (0.64–5.73) | 205 | 254 | 23 | 1.37 | (0.54–3.51) | 32 | 1.23 | (0.58–2.60) |
| CC | 155 | 88 | 24 | 1.42 | (0.68–2.97) | 20 | 3.57 | (1.16–10.97) | 106 | 137 | 13 | 1.50 | (0.54–4.13) | 30 | 2.17 | (1.01–4.65) |
| rs11575899 | ||||||||||||||||
| INS/INS | 272 | 181 | 33 | 1.00 | (ref) | 24 | 1.00 | (ref) | 194 | 259 | 19 | 1.00 | (ref) | 38 | 1.00 | (ref) |
| INS/DEL | 211 | 147 | 25 | 0.98 | (0.57–1.71) | 20 | 1.05 | (0.56–1.99) | 158 | 200 | 17 | 1.10 | (0.55–2.18) | 27 | 0.93 | (0.55–1.57) |
| DEL/DEL | 45 | 20 | 9 | 1.69 | (0.76–3.78) | 3 | 1.13 | (0.31–4.10) | 31 | 34 | 5 | 1.65 | (0.57–4.74) | 7 | 1.43 | (0.59–3.46) |
| rs10046 | ||||||||||||||||
| TT | 168 | 109 | 21 | 1.00 | (ref) | 9 | 1.00 | (ref) | 120 | 157 | 10 | 1.00 | (ref) | 20 | 1.00 | (ref) |
| CT | 253 | 183 | 38 | 1.25 | (0.70–2.21) | 29 | 1.89 | (0.86–4.16) | 190 | 246 | 28 | 1.77 | (0.83–3.77) | 39 | 1.23 | (0.69–2.18) |
| CC | 107 | 56 | 8 | 0.60 | (0.25–1.40) | 9 | 1.96 | (0.74–5.22) | 73 | 90 | 3 | 0.49 | (0.13–1.85) | 13 | 1.14 | (0.54–2.40) |
| rs4646 | ||||||||||||||||
| GG | 264 | 177 | 35 | 1.00 | (ref) | 21 | 1.00 | (ref) | 183 | 258 | 20 | 1.00 | (ref) | 36 | 1.00 | (ref) |
| GT | 210 | 148 | 27 | 0.97 | (0.57–1.66) | 23 | 1.33 | (0.71–2.51) | 164 | 194 | 20 | 1.12 | (0.58–2.15) | 29 | 1.07 | (0.64–1.81) |
| TT | 54 | 23 | 5 | 0.71 | (0.27–1.91) | 3 | 1.09 | (0.30–3.94) | 36 | 41 | 1 | 0.25 | (0.03–1.95) | 7 | 1.25 | (0.52–2.99) |
Table 4.
Age-adjusted ORs and 95% CIs for CYP19A1 haplotypes and risk of breast cancer with proliferative fibrocystic conditions, by menopausal status and BMI
| Breast cancer with proliferative fibrocystic conditions | |||||||||
|---|---|---|---|---|---|---|---|---|---|
| Premenopausal | Postmenopausal | BMI <23.0 kg/m2 | BMI 23.0+ kg/m2 | ||||||
| Haplotype | Freq.* | OR (95%CI) | Freq.* | OR (95%CI) | Freq.* | OR (95%CI) | Freq.* | OR (95%CI) | |
| Block 1 (rs1870049, rs1004982) | |||||||||
| 00 | TT | 0.64 | 1.00 (ref) | 0.53 | 1.00 (ref) | 0.64 | 1.00 (ref) | 0.57 | 1.00 (ref) |
| 11 | CC | 0.24 | 1.23 (0.82,1.87) | 0.24 | 1.56 (0.87,2.80) | 0.25 | 1.36 (0.80,2.32) | 0.24 | 1.38 (0.89,2.13) |
| 01 | TC | 0.11 | 1.06 (0.60,1.85) | 0.22 | 2.15 (1.21,3.84) | 0.11 | 1.08 (0.53,2.22) | 0.19 | 1.70 (1.05,2.75) |
| 10 | CT | -- | 0.01 | 1.34 (0.15,11.92) | -- | 0.00 | |||
| Block 2 (rs28566535, rs93636) | |||||||||
| 00 | AC | 0.60 | 1.00 (ref) | 0.52 | 1.00 (ref) | 0.62 | 1.00 (ref) | 0.54 | 1.00 (ref) |
| 11 | CT | 0.33 | 1.15 (0.78,1.68) | 0.40 | 1.69 (1.07,2.66) | 0.32 | 1.24 (0.76,2.02) | 0.38 | 1.39 (0.97,2.00) |
| 01 | AT | 0.03 | 1.67 (0.63,4.45) | 0.03 | 1.57 (0.49,5.00) | 0.02 | 1.26 (0.32,4.88) | 0.04 | 1.91 (0.77,4.73) |
| 10 | CC | 0.04 | 2.04 (0.82,5.06) | 0.05 | 5.11 (1.41,18.51) | 0.04 | 3.17 (0.89,11.32) | 0.04 | 2.62 (1.09,6.28) |
| Block 3 (rs11636639) | |||||||||
| 0 | G | 0.21 | 1.00 (ref) | 0.54 | 1.00 (ref) | 0.55 | 1.00 (ref) | 0.51 | 1.00 (ref) |
| 1 | T | 0.49 | 1.00 (0.70,1.44) | 0.46 | 1.05 (0.68,1.62) | 0.45 | 0.89 (0.56,1.40) | 0.49 | 1.14 (0.80,1.61) |
| Block 4 (rs767199, rs4775936, rs11575899 (ins-del), rs10046, rs4646) | |||||||||
| 00000 | ATITG | 0.39 | 1.00 (ref) | 0.30 | 1.00 (ref) | 0.42 | 1.00 (ref) | 0.32 | 1.00 (ref) |
| 11111 | CGDCT | 0.24 | 1.05 (0.65,1.68) | 0.20 | 1.26 (0.68,2.34) | 0.23 | 0.83 (0.44,1.59) | 0.23 | 1.31 (0.80,2.14) |
| 11010 | GCICG | 0.12 | 0.87 (0.47,1.61) | 0.17 | 1.75 (0.88,3.48) | 0.12 | 1.06 (0.49,2.33) | 0.13 | 1.26 (0.70,2.26) |
| 11000 | GCITG | 0.08 | 1.08 (0.52,2.23) | 0.18 | 2.66 (1.34,5.30) | 0.09 | 0.88 (0.35,2.22) | 0.15 | 2.62 (1.43,4.80) |
| 01000 | ACITG | 0.04 | 1.33 (0.59,3.02) | -- | 0.02 | 0.77 (0.17,3.45) | 0.03 | 1.86 (0.71,4.86) | |
| 11011 | GCICT | 0.03 | 0.85 (0.24,2.97) | 0.05 | 3.45 (1.09,11.46) | 0.03 | 0.96 (0.20,4.60) | 0.04 | 2.22 (0.79,6.19) |
| 10000 | GTITG | 0.02 | 0.76 (0.19,2.04) | 0.01 | 0.67 (0.09,5.04) | -- | 0.02 | 1.33 (0.41,4.34) | |
| 11100 | GCDTG | 0.06 | 4.24 (1.70,10.58) | 0.01 | 1.39 (0.20,9.63) | 0.06 | 11.19 (2.81,44.50) | 0.03 | 1.96 (0.65,5.89) |
| Others | 0.02 | 0.08 | 0.03 | 0.05 | |||||
Global score test p-values for premenopausal women: 0.60 (block 1), 0.33 (block 2), 0.10 (block 4)
Global score test p-values for postmenopausal women: 0.048 (block 1), 0.009 (block 2), 0.04 (block 4)
Global score test p-values for BMI <23 kg/m2: 0.57 (block 1), 0.26 (block 2), 0.02 (block 4)
Global score test p-values for BMI 23.0+ kg/m2: 0.12 (block 1), 0.043 (block 2), 0.07 (block 4)
DISCUSSION
In this study, we evaluated whether interindividual variation in the CYP19A1 gene alters susceptibility to breast cancer or fibrocystic breast conditions in Chinese women. Overall risk of either disease outcome was not related to any of the individual genotypes or block-specific haplotypes, although the risk of breast cancer associated with several gene variants differed according to proliferation status. The observed increases in risk among breast cancer cases with, but not without, concurrent proliferative fibrocystic conditions suggest that CYP19A1 variation may only influence breast cancer etiology in this specific subgroup of women.
A clear limitation of our study was the selection of SNPs identified to tag common haplotypes in Caucasian women. Different htSNPs would have been chosen if sequencing data for the Han Chinese population had been available for use at the time this study was conducted. Using genotype data for the Han Chinese and CEPH individuals from the International HapMap Project, we attempted post hoc to estimate the extent of common variation captured by the SNPs genotyped across the CYP19A1 locus in each ethnic group. Of the ten SNPs selected, the seven for which HapMap data were available captured approximately 23% of the CYP19A1 variation in the Han Chinese. Despite this very modest estimate of gene coverage, the corresponding estimate in the CEPH was only 3% higher, and our LD structure plots of the CYP19A1 gene for the CEPH and Han Chinese populations were generally similar (Figure 1). This observation is compatible with resequencing data published by Ma et al. (52) that show minor allele frequencies for Caucasian-American and Han Chinese-American individuals are comparable in some, although not all polymorphic regions of this gene. Therefore, due to this inherent limitation, we can only assess the risks of breast cancer and fibrocystic breast conditions in relation to each individual SNP alone and in combination with other SNPs (as defined by block-specific haplotypes).
Novel features of the present study were 1) the inclusion of women with fibrocystic breast conditions as a separate comparison group and 2) the classification of biopsied tissue according to the presence of proliferative changes in the non-malignant epithelium adjacent to the breast tumor or in the benign lesion. Although proliferation status was determined for a limited subset of cases, homozygous carriage of the minor allele, relative to that of the major allele, for four of the SNPs was associated with close to a twofold increased risk of breast cancer in the presence, but not absence of concurrent fibrocystic conditions. Assessing the validity of these results is challenging, since no known genetic association studies of breast cancer have collected data on fibrocystic changes in the extratumoral epithelium. With the small size of the biopsies taken, however, some non-differential misclassification of proliferation status likely occurred, and the true magnitude of risk could be even greater than observed.
Several recent studies, including another also conducted in Shanghai, have not been able to link CYP19A1 variation to breast cancer risk (27, 36, 37). Yet in one of these studies comprised of primarily Caucasian, postmenopausal women, associations were noted between tagging SNPs, particularly in blocks 3 and 4, and 10% to 20% increases in circulating estrogen levels (36). The strongest associations were reported for two SNPs that we did not genotype, rs749292 and rs727479. Again utilizing the HapMap data on the Han Chinese, we did not note strong pairwise correlations for either rs749292 or rs727479 with the three SNPs that were related to an increased risk of breast cancer with proliferative fibrocystic conditions (pairwise r2 ranged from 0.04 to 0.41). Therefore, the functional relevance of these three “at risk” SNPs is not clear.
Other investigations in Shanghai have produced some evidence linking CYP19A1 variation to related outcomes, including breast cancer mortality (53), endometrial cancer (54), and obesity (55). The same population of Chinese women, who were genotyped for 19 htSNPs identified previously for Japanese women in the Multiethnic Cohort Study (35), have been examined in the studies of breast cancer incidence (37), breast cancer mortality (53), and obesity (55). Of the 19 markers, four (rs28566535, rs936306, rs10046, and rs4646) were also selected as htSNPs in our study. In the Long et al. study of CYP19A1 variation and breast cancer mortality in Shanghai, poorer survival was associated with homozygous carriage of the minor allele, relative to that of the major allele, for all five SNPs examined in block 2 and a nonsynonymous SNP (Arg264Cys) in block 4 (53).
In our study, the risk-conferring variants for breast cancer with proliferative fibrocystic conditions were two of the same SNPs in block 2 (rs28566535 and rs936306), as well as one SNP each in blocks 1 and 4 that were not genotyped by Long et al. Also, compatible with our hypothesis that some proliferative fibrocystic lesions may represent precursor lesions for breast cancer, we found elevated odds ratios of breast cancer with proliferative fibrocystic conditions in relation to these four variants, when compared to proliferative fibrocystic conditions only. In light of these findings, the increased risk of breast cancer that has been previously reported in women with proliferative (but not non-proliferative) fibrocystic conditions may, at least in part, be explained by differences in CYP19A1 variation.
In exploratory analyses, we further found the increased risk of breast cancer with proliferative fibrocystic conditions in relation to certain CYP19A1 markers was pronounced among women who were postmenopausal or had a BMI ≥23 kg/m2. While these findings should be viewed as suggestive, the direction and magnitude of the odds ratio estimates are consistent with evidence that adipose tissue serves as the primary source of endogenous estrogens in postmenopausal women and that aromatase expression is upregulated in malignant relative to normal breast tissue (4).
Although the associations that we observed could be explained by chance due to the number of analyses conducted and comparisons made, there are data to suggest that the chromosomal region 15q21.1, where CYP19A1 is located, may influence breast cancer progression. Among patients with primary breast carcinoma, known predictors of poor prognosis have been strongly correlated with allelic imbalance at 15q21.1, and much higher frequencies of allelic imbalance in this genomic region, particularly at the TTTA repeat in intron 4 (block 4), have been found in more advanced tumors (56). Furthermore, multiple promoters, including those expressed in adipose tissue and breast cancer (i.e., I.3 and I.4), are located about 93 kb upstream of the coding exon II (4). Variants in haplotype blocks 1 to 3 are located in this region.
Our results, coupled with current knowledge about the biology of the CYP19A1 gene, suggest that CYP19A1 variation may contribute toward the origin of breast tumors in women with proliferative fibrocystic conditions. Until replicated by others, however, these findings should be interpreted cautiously. Well-designed studies examining CYP19A1 variation in relation to breast cancer risk in a cohort of women with benign proliferative fibrocystic breast conditions could be conducted to validate our results.
ACKNOWLEDGMENTS
This research is supported by the National Cancer Institute (R01 CA84141-01A1). We thank Wenwan Wang, Xu Wang Hong, and the medical and BSE workers of the Shanghai Textile Industry Bureau for their efforts in data collection; Drs. Fan Liang Chen, Guan Lin Zhao, Yong Wei Hu, and Lei Da Pan for their continued support of our research in Shanghai; and Judith Calman, Georgia Green, Ted Grichuchin, Jan Kikuchi, Wenjin Li, and Shirley Zhang for their technical and administrative support.
Abbreviations
- CYP19A1
cytochrome p450 19
- BSE
breast self-examination
- SNP
single nucleotide polymorphism
- PCR
polymerase chain reaction
- OR
odds ratio
- CI
confidence interval
REFERENCE
- 1.Henderson BE, Ross RK, Pike MC, Casagrande JT. Endogenous hormones as a major factor in human cancer. Cancer Res. 1982;42:3232–3239. [PubMed] [Google Scholar]
- 2.Thomas HV, Reeves GK, Key TJ. Endogenous estrogen and postmenopausal breast cancer: a quantitative review. Cancer Causes Control. 1997;8:922–928. doi: 10.1023/a:1018476631561. [DOI] [PubMed] [Google Scholar]
- 3.Hankinson SE, Willett WC, Manson JE, et al. Plasma sex steroid hormone levels and risk of breast cancer in postmenopausal women. J Natl Cancer Inst. 1998;90:1292–1299. doi: 10.1093/jnci/90.17.1292. [DOI] [PubMed] [Google Scholar]
- 4.Bulun SE, Chen D, Lu M, et al. Aromatase excess in cancers of breast, endometrium and ovary. J Steroid Biochem Mol Biol. 2007;106:81–96. doi: 10.1016/j.jsbmb.2007.05.027. [DOI] [PMC free article] [PubMed] [Google Scholar]
- 5.Cavalieri E, Frenkel K, Liehr JG, Rogan E, Roy D. Estrogens as endogenous genotoxic agents--DNA adducts and mutations. J Natl Cancer Inst Monographs. 2000:75–93. doi: 10.1093/oxfordjournals.jncimonographs.a024247. [DOI] [PubMed] [Google Scholar]
- 6.Devanesan P, Santen RJ, Bocchinfuso WP, Korach KS, Rogan EG, Cavalieri E. Catechol estrogen metabolites and conjugates in mammary tumors and hyperplastic tissue from estrogen receptor-alpha knock-out (ERKO)/Wnt-1 mice: implications for initiation of mammary tumors. Carcinogenesis. 2001;22:1573–1576. doi: 10.1093/carcin/22.9.1573. [DOI] [PubMed] [Google Scholar]
- 7.Yue W, Santen RJ, Wang JP, et al. Genotoxic metabolites of estradiol in breast: potential mechanism of estradiol induced carcinogenesis. J Steroid Biochem Mol Biol. 2003;86:477–486. doi: 10.1016/s0960-0760(03)00377-7. [DOI] [PubMed] [Google Scholar]
- 8.Harada N, Utsumi T, Takagi Y. Tissue-specific expression of the human aromatase cytochrome P-450 gene by alternative use of multiple exons 1 and promoters, and switching of tissue-specific exons 1 in carcinogenesis. Proc Natl Acad Sci U S A. 1993;90:11312–11316. doi: 10.1073/pnas.90.23.11312. [DOI] [PMC free article] [PubMed] [Google Scholar]
- 9.Mahendroo MS, Means GD, Mendelson CR, Simpson ER. Tissue-specific expression of human P-450AROM. The promoter responsible for expression in adipose tissue is different from that utilized in placenta. J Biol Chem. 1991;266:11276–11281. [PubMed] [Google Scholar]
- 10.Agarwal VR, Bulun SE, Leitch M, Rohrich R, Simpson ER. Use of alternative promoters to express the aromatase cytochrome P450 (CYP19) gene in breast adipose tissues of cancer-free and breast cancer patients. J Clin Endocrinol Metab. 1996;81:3843–3849. doi: 10.1210/jcem.81.11.8923826. [DOI] [PubMed] [Google Scholar]
- 11.Utsumi T, Harada N, Maruta M, Takagi Y. Presence of alternatively spliced transcripts of aromatase gene in human breast cancer. J Clin Endocrinol Metab. 1996;81:2344–2349. doi: 10.1210/jcem.81.6.8964875. [DOI] [PubMed] [Google Scholar]
- 12.Kristensen VN, Andersen TI, Lindblom A, Erikstein B, Magnus P, Borresendale AL. A rare CYP19 (aromatase) variant may increase the risk of breast cancer. Pharmacogenetics. 1998;8:43–48. doi: 10.1097/00008571-199802000-00006. [DOI] [PubMed] [Google Scholar]
- 13.Siegelmann-Danieli N, Buetow KH. Constitutional genetic variation at the human aromatase gene (Cyp19) and breast cancer risk. Br J Cancer. 1999;79:456–463. doi: 10.1038/sj.bjc.6690071. [DOI] [PMC free article] [PubMed] [Google Scholar]
- 14.Healey CS, Dunning AM, Durocher F, et al. Polymorphisms in the human aromatase cytochrome P450 gene (CYP19) and breast cancer risk. Carcinogenesis. 2000;21:189–193. doi: 10.1093/carcin/21.2.189. [DOI] [PubMed] [Google Scholar]
- 15.Haiman CA, Hankinson SE, Spiegelman D, et al. A tetranucleotide repeat polymorphism in CYP19 and breast cancer risk. Int J Cancer. 2000;87:204–210. [PubMed] [Google Scholar]
- 16.Miyoshi Y, Iwao K, Ikeda N, Egawa C, Noguchi S. Breast cancer risk associated with polymorphism in CYP19 in Japanese women. Int J Cancer. 2000;89:325–328. doi: 10.1002/1097-0215(20000720)89:4<325::aid-ijc2>3.0.co;2-3. [DOI] [PubMed] [Google Scholar]
- 17.Probst-Hensch NM, Ingles SA, Diep AT, et al. Aromatase and breast cancer susceptibility. Endocr Relat Cancer. 1999;6:165–173. doi: 10.1677/erc.0.0060165. [DOI] [PubMed] [Google Scholar]
- 18.Baxter SW, Choong DY, Eccles DM, Campbell IG. Polymorphic variation in CYP19 and the risk of breast cancer. Carcinogenesis. 2001;22:347–349. doi: 10.1093/carcin/22.2.347. [DOI] [PubMed] [Google Scholar]
- 19.Miyoshi Y, Ando A, Hasegawa S, et al. Association of genetic polymorphisms in CYP19 and CYP1A1 with the oestrogen receptor-positive breast cancer risk. Eur J Cancer. 2003;39:2531–2537. doi: 10.1016/j.ejca.2003.08.017. [DOI] [PubMed] [Google Scholar]
- 20.Dialyna I, Tzanakakis G, Dolapsakis G, Tsatsakis A. A tetranucleotide repeat polymorphism in the CYP19 gene and breast cancer susceptibility in a Greek population exposed and not exposed to pesticides. Toxicol Lett. 2004;151:267–271. doi: 10.1016/j.toxlet.2004.01.024. [DOI] [PubMed] [Google Scholar]
- 21.Ahsan H, Whittemore AS, Chen Y, et al. Variants in estrogen-biosynthesis genes CYP17 and CYP19 and breast cancer risk: a family-based genetic association study. Breast Cancer Res. 2005;7:R71–R81. doi: 10.1186/bcr951. [DOI] [PMC free article] [PubMed] [Google Scholar]
- 22.Ribeiro FS, de Amorim LM, de Almeida Simao T, Mendonca GA. CYP19 (TTTA)n polymorphism and breast cancer risk in Brazilian women. Toxicol Lett. 2006;164:90–95. doi: 10.1016/j.toxlet.2005.11.014. [DOI] [PubMed] [Google Scholar]
- 23.Suspitsin EN, Grigoriev MY, Togo AV, et al. Distinct prevalence of the CYP19 Delta3(TTTA)(7) allele in premenopausal versus postmenopausal breast cancer patients, but not in control individuals. Eur J Cancer. 2002;38:1911–1916. doi: 10.1016/s0959-8049(02)00149-1. [DOI] [PubMed] [Google Scholar]
- 24.Han DF, Zhou X, Hu MB, et al. Polymorphisms of estrogen-metabolizing genes and breast cancer risk: a multigenic study. Chin Med J. 2005;118:1507–1516. [PubMed] [Google Scholar]
- 25.Okobia MN, Bunker CH, Zmuda JM, et al. Simple tandem repeat (TTTA)n polymorphism in CYP19 (aromatase) gene and breast cancer risk in Nigerian women. J Carcinog. 2006;5:12. doi: 10.1186/1477-3163-5-12. [DOI] [PMC free article] [PubMed] [Google Scholar]
- 26.Thyagarajan B, Brott M, Mink P, et al. CYP1B1 and CYP19 gene polymorphisms and breast cancer incidence: no association in the ARIC study. Cancer Lett. 2004;207:183–189. doi: 10.1016/j.canlet.2003.12.009. [DOI] [PubMed] [Google Scholar]
- 27.Olson JE, Ingle JN, Ma CX, et al. A comprehensive examination of CYP19 variation and risk of breast cancer using two haplotype-tagging approaches. Breast Cancer Res Treat. 2007;102:237–247. doi: 10.1007/s10549-006-9324-7. [DOI] [PMC free article] [PubMed] [Google Scholar]
- 28.Dunning AM, Dowsett M, Healey CS, et al. Polymorphisms associated with circulating sex hormone levels in postmenopausal women. J Natl Cancer Inst. 2004;96:936–945. doi: 10.1093/jnci/djh167. [DOI] [PubMed] [Google Scholar]
- 29.Hefler LA, Tempfer CB, Grimm C, et al. Estrogen-metabolizing gene polymorphisms in the assessment of breast carcinoma risk and fibroadenoma risk in Caucasian women. Cancer. 2004;101:264–269. doi: 10.1002/cncr.20361. [DOI] [PubMed] [Google Scholar]
- 30.Hirose K, Matsuo K, Toyama T, Iwata H, Hamajima N, Tajima K. The CYP19 gene codon 39 Trp/Arg polymorphism increases breast cancer risk in subsets of premenopausal Japanese. Cancer Epidemiol Biomarkers Prev. 2004;13:1407–1411. [PubMed] [Google Scholar]
- 31.Hu MB, Xie W, Xiong B, et al. Study on the relationship between polymorphisms of genes (CYP17, CYP19 and SULT1A1) and susceptibility to breast cancer in Chinese women. Zhonghua Liu Xing Bing Xue Za Zhi. 2006;27:351–355. [PubMed] [Google Scholar]
- 32.Lee KM, Abel J, Ko Y, et al. Genetic polymorphisms of cytochrome P450 19 and 1B1, alcohol use, and breast cancer risk in Korean women. Br J Cancer. 2003;88:675–678. doi: 10.1038/sj.bjc.6600761. [DOI] [PMC free article] [PubMed] [Google Scholar]
- 33.Kristensen VN, Harada N, Yoshimura N, et al. Genetic variants of CYP19 (aromatase) and breast cancer risk. Oncogene. 2000;19:1329–1333. doi: 10.1038/sj.onc.1203425. [DOI] [PubMed] [Google Scholar]
- 34.Haiman CA, Hankinson SE, Spiegelman D, Brown M, Hunter DJ. No association between a single nucleotide polymorphism in CYP19 and breast cancer risk. Cancer Epidemiol Biomarkers Prev. 2002;11:215–216. [PubMed] [Google Scholar]
- 35.Haiman CA, Stram DO, Pike MC, et al. A comprehensive haplotype analysis of CYP19 and breast cancer risk: the Multiethnic Cohort. Hum Mol Genet. 2003;12:2679–2692. doi: 10.1093/hmg/ddg294. [DOI] [PubMed] [Google Scholar]
- 36.Haiman CA, Dossus L, Setiawan VW, et al. Genetic variation at the CYP19A1 locus predicts circulating estrogen levels by not breast cancer risk in postmenopausal women. Cancer Res. 2007;67:1893–1897. doi: 10.1158/0008-5472.CAN-06-4123. [DOI] [PubMed] [Google Scholar]
- 37.Cai Q, Kataoka N, Li C, et al. Haplotype Analyses of CYP19A1 Gene variants and breast cancer risk: results from the Shanghai Breast Cancer Study. Cancer Epidemiol Biiomarkers Prev. 2008;17:27–32. doi: 10.1158/1055-9965.EPI-07-0688. [DOI] [PMC free article] [PubMed] [Google Scholar]
- 38.Tworoger SS, Chubak J, Aiello EJ, et al. Association of CYP17, CYP19, CYP1B1, and COMT polymorphisms with serum and urinary sex hormone concentrations in postmenopausal women. Cancer Epidemiol Biomarkers Prev. 2004;13(1):94–101. doi: 10.1158/1055-9965.epi-03-0026. [DOI] [PubMed] [Google Scholar]
- 39.Travis RC, Churchman M, Edwards SA, et al. No association of polymorphisms in CYP17, CYP19, and HSD17-B1 with plasma estradiol concentrations in 1,090 British women. Cancer Epidemiol Biomarkers Prev. 2004;13:2282–2284. [PubMed] [Google Scholar]
- 40.Dupont WD, Page DL. Risk factors for breast cancer in women with proliferative breast disease. N Engl J Med. 1985;312:146–151. doi: 10.1056/NEJM198501173120303. [DOI] [PubMed] [Google Scholar]
- 41.Carter CL, Corle DK, Micozzi MS, Schatzkin A, Taylor PR. A prospective study of the development of breast cancer in 16,692 women with benign breast disease. Am J Epidemiol. 1988;128:467–477. doi: 10.1093/oxfordjournals.aje.a114995. [DOI] [PubMed] [Google Scholar]
- 42.London SJ, Connolly JL, Schnitt SJ, Colditz GA. A prospective study of benign breast disease and the risk of breast cancer. JAMA. 1992;267:941–944. [PubMed] [Google Scholar]
- 43.Paynter RA, Hankinson SE, Colditz GA, Kraft P, Hunter DJ, De Vivo I. CYP19 (aromatase) haplotypes and endometrial cancer risk. Int J Cancer. 2005;116:267–274. doi: 10.1002/ijc.21041. [DOI] [PubMed] [Google Scholar]
- 44.Thomas DB, Gao DL, Self SG, et al. Randomized Trial of Breast Self-examination in Shanghai: Methodology and Preliminary Results. J Natl Cancer Inst. 1997;89:355–365. doi: 10.1093/jnci/89.5.355. [DOI] [PubMed] [Google Scholar]
- 45.Thomas DB, Gao DL, Ray RM, et al. Randomized trial of breast self-examination in Shanghai: final results. J Natl Cancer Inst. 2002;94:1445–1457. doi: 10.1093/jnci/94.19.1445. [DOI] [PubMed] [Google Scholar]
- 46.Sakoda LC, Blackston CR, Xue K, et al. Glutathione S-transferase M1 and P1 polymorphisms and risk of breast cancer and fibrocystic breast conditions in Chinese women. Breast Cancer Res Treat. 2008;109:143–155. doi: 10.1007/s10549-007-9633-5. [DOI] [PMC free article] [PubMed] [Google Scholar]
- 47.Aaman TB, Stalsberg H, Thomas DB. Extratumoral breast tissue in breast cancer patients: a multinational study of variations with age and country of residence in low- and high-risk countries. WHO Collaborative Study of Neoplasia and Steroid Contraceptives. Int J Cancer. 1997;71:333–339. doi: 10.1002/(sici)1097-0215(19970502)71:3<333::aid-ijc4>3.0.co;2-z. [DOI] [PubMed] [Google Scholar]
- 48.Miller SA, Dykes DD, Polesky HF. A simple salting out procedure for extracting DNA from human nucleated cells. Nucleic Acids Res. 1988;16:1215. doi: 10.1093/nar/16.3.1215. [DOI] [PMC free article] [PubMed] [Google Scholar]
- 49.Suter NM, Ray RM, Hu YW, et al. BRCA1 and BRCA2 mutations in women from Shanghai China. Cancer Epidemiol Biomarkers Prev. 2004;13:181–189. doi: 10.1158/1055-9965.epi-03-0196. [DOI] [PubMed] [Google Scholar]
- 50.Bell GI, Karam JH, Rutter WJ. Polymorphic DNA region adjacent to the 5′ end of the human insulin gene. Proc Natl Acad Sci U S A. 1981;78:5769–5763. doi: 10.1073/pnas.78.9.5759. [DOI] [PMC free article] [PubMed] [Google Scholar]
- 51.Sinnwell JP, Schaid DJ, Yu Z. haplo.stats: statistical analysis of haplotypes with traits and covariates when linkage phase is ambiguous. R package version 1.3.1. ( http://mayoresearch.mayo.edu/mayo/research/schaid_lab/software.cfm) [Google Scholar]
- 52.Ma CX, Adjei AA, Salavaggione OE, Coronel J, Pelleymounter L. Human Aromatase: Gene Resequencing and Functional Genomics. Cancer Res. 2005;65:11071–11082. doi: 10.1158/0008-5472.CAN-05-1218. [DOI] [PubMed] [Google Scholar]
- 53.Long JR, Kataoka N, Shu XO, et al. Genetic polymorphisms of the CYP19A1 gene and breast cancer survival. Cancer Epidemiol Biomarkers Prev. 2006;15:2115–2122. doi: 10.1158/1055-9965.EPI-06-0464. [DOI] [PubMed] [Google Scholar]
- 54.Tao MH, Cai Q, Zhang ZF, et al. Polymorphisms in the CYP19A1 (aromatase) gene and endometrial cancer risk in Chinese women. Cancer Epidemiol Biomarkers Prev. 2007;16:943–949. doi: 10.1158/1055-9965.EPI-06-1012. [DOI] [PubMed] [Google Scholar]
- 55.Long JR, Shu XO, Cai Q, et al. CYP19A1 genetic polymorphisms may be associated with obesity-related phenotypes in Chinese women. Int J Obes. 2007;31:418–423. doi: 10.1038/sj.ijo.0803439. [DOI] [PubMed] [Google Scholar]
- 56.Rhiem K, Klein A, Munch M, et al. Chromosomal region 15q21.1 is a frequent target of allelic imbalance in advanced breast carcinomas. Int J Cancer. 2003;106:74–77. doi: 10.1002/ijc.11169. [DOI] [PubMed] [Google Scholar]