Abstract
Psychoacoustic experimentation shows that formant frequency shifts can give rise to more significant changes in phonetic vowel timber than differences in overall level, bandwidth, spectral tilt, and formant amplitudes. Carlson and Granström's perceptual and computational findings suggest that, in addition to spectral representations, the human ear uses temporal information on formant periodicities (‘Dominant Frequencies’) in building vowel timber percepts. The availability of such temporal coding in the cat's auditory nerve fibers has been demonstrated in numerous physiological investigations undertaken during recent decades. In this paper we explore, and provide further support for, the Dominant Frequency hypothesis using KONVERT, a computational auditory model. KONVERT provides auditory excitation patterns for vowels by performing a critical-band analysis. It simulates phase locking in auditory neurons and outputs DF histograms. The modeling supports the assumption that listeners judge phonetic distance among vowels on the basis formant frequency differences as determined primarily by a time-based analysis. However, when instructed to judge psychophysical distance among vowels, they can also use spectral differences such as formant bandwidth, formant amplitudes and spectral tilt. Although there has been considerable debate among psychoacousticians about the functional role of phase locking in monaural hearing, the present research suggests that detailed temporal information may nonetheless play a significant role in speech perception.
Keywords: Vowel quality perception, Auditory representation, Dominant Frequency
1. Acoustic bases of vowel percepts
Traditionally, vowel quality has been specified acoustically in terms of the first, second and third formant frequencies. F1 and F2 are the main determinants of vowel color. For back vowels the contribution of F3 is negligible, but including it makes it possible to characterize the F2–F3 proximity of retroflection and front rounded vowels. Higher formants seem more linked to individual voice characteristics.
The formant-based approach is validated by, among other things, the success of formant synthesizers. It is anchored in basic acoustic theory (Fant, 1960) which analyzes the transfer function of a vowel as the sum of the formant envelopes, source, radiation and higher-pole correction. Two numbers suffice to generate a formant curve: the frequency and the bandwidth of the formant. In a first approximation, the contributions from the source, radiation and higher-pole correction can be treated as constant. Bandwidth has been shown to vary lawfully as a function of formant frequency (Fant, 1972). Consequently, the only numbers needed to recreate a vowel spectrum are the frequencies of the lowest formants and the fundamental frequency.
The literature on speech perception richly documents a close relationship between formants and listener responses. Nevertheless, whether made automatically or by eye and hand, the measurement of formant frequencies in natural speech is complicated by a number of factors. For instance, in voiced sounds, the harmonic structure samples the spectral envelope at discrete frequencies which only occasionally coincide with the envelope peaks. As F0 increases this sampling gets less and less dense (see further discussion below) making the determination of envelope maxima a non-trivial, error-prone task.
Another problem is the presence of zeros associated with nasalization, aspiration and voice source characteristics. These antiformants tend to give rise to spurious spectral peaks at nearby higher frequencies. As is well known, to reduce measurement errors, acoustic analyses using wideband filtering or LPC must be used with caution and with all of these complications borne in mind.
In modeling experimental data on vowel perception, investigators have also explored the spectral patterns of vowels. A standard assumption is that the ear performs a running frequency analysis using a set of critical-bandwidth filters. In other words, it behaves like an auditorily calibrated spectrograph. In support of this idea Plomp (1970) reported that perceived differences in timber could be predicted from the spectral stimulus patterns produced at the output of a critical-band filter bank.
Inspired by Plomp's work and that of Schroeder et al. (1979) and Bladon and Lindblom (1981) explored such representations further in a study of vowels. With the aid of an auditory model they derived an auditory “excitation pattern” for each stimulus calibrated in sones/Bark versus Bark. A “perceptual distance” measure was calculated as follows for every vowel pair:
| (1.1) |
where Ei(x) and Ej(x) represent the excitation levels as a function of x (in Bark units) in the auditory spectra of vowels i and j. This formula successfully predicted the perceptual data collected in two experimental tasks: (i) adjusting the higher formant (“F2 prime”) of a two-formant vowel in response to a four-formant vowel until a match in vowel quality had been obtained and (ii) judging the ‘auditory distance’ between the members of different vowel pairs.
In (Lindblom, 1986) the critical-band model was applied to the problem of predicting vowel inventories. The results were in better agreement with the observed facts than those of an earlier study (Liljencrants and Lindblom, 1972). In the first step of the auditory modeling, amplitudes were adjusted in accordance with equal loudness contours (Fletcher and Munson, 1933), calibrated in phons. In a second step the phon units were converted into units of subjective loudness (sones). These steps had the effect of emphasizing the low frequencies of the auditory spectrum, i.e., the F1 region, at the expense of F2 and F3. In other words, the auditory distance measure (Eq. (1.1)) imposed a warping of the vowel space which effectively compressed the range of F2 and F3 variation among vowels relative to that of F1 variation (Figs. 2.5 and 2.6 in (Lindblom, 1986)). For inventories with more than 5 vowels the Liljencrants and Lindblom model predicted too many high vowels. For instance, the predicted 7-vowel system showed formant patterns corresponding to [i u ε ᵓ a], whereas the most favored observed pattern would typically have [i u e o ε ᵓ a] as exemplified by Tunica, Bambara, Italian and many others. As a result of the more realistic critical-band model the problem of “two many high vowels” was reduced – but not eliminated.
The output of critical-band models can be interpreted physiologically as reflecting the average firing rate as a function of the characteristic frequencies (CF's) of the neural channels. The relative success of these models would seem to indicate that essential aspects of auditory processing of vowels are satisfactorily captured by the whole-spectrum approach. It also suggests that limiting the analysis to formant frequencies alone ignores important information, e.g., on (local) spectral amplitude relations (Carlson et al., 1975).
Accounts of vowel perception still need to shed more light on the relative roles played by formant frequencies on the one hand and spectral shape on the other. This is a topic to which Carlson and Granström have contributed extensively and which we would like to address in this article.
Let us first review some basic facts about vowels. What are the rules governing the variation of formant levels in vowels? The answer is obtained by exploring the standard equations for vowel spectra (Fant, 1960, 1972).
For a set of vowels similar to that in (Lindblom, 1986) (left diagram of Fig. 1), spectral envelopes were derived using the KONVERT model (to be presented below). The rms values of the formant envelope peaks are indicated in the right panel of Fig. 1.1 The formant amplitudes of the vowels are plotted against their respective formant frequencies. As can be seen there is a considerable amplitude reduction as a function of formant number. The deviations from an average speech spectrum slope of −6 dB/octave are due to the fact that the specific formant frequency positions and bandwidths also affect amplitudes.
Fig. 1.
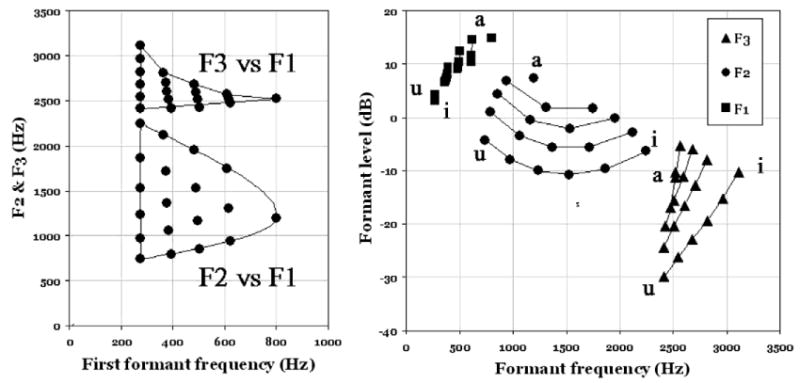
Formant data (left) and associated formant amplitudes (right) for a set of reference vowels.
A factor that can produce significant variation in formant amplitudes is the sparse F0-dependent sampling of the spectral envelope. As already mentioned, the envelope of a harmonic spectrum is defined only at discrete points corresponding to the frequencies of the harmonics. This phenomenon can sometimes affect the formant amplitudes and the overall intensity of a vowel in a rather drastic way as illustrated in Fig. 2.
Fig. 2.
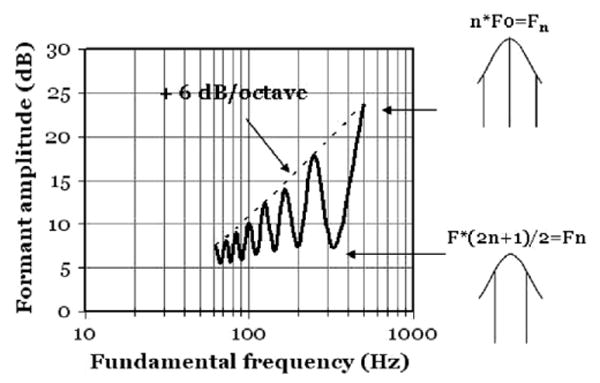
As F0 is varied from 63 to 500 Hz, the overall intensity of a synthetic four-formant vowel is seen to vary by more than 15 dB. The peaks of the oscillatory curve occur when a harmonic coincides with the resonance frequency; the minima correspond to situations where two harmonics straddle the peak. (Replication of Fig. 2 in (Fant et al., 1963).
The data of Fig. 2 were also calculated with the KONVERT model. The exercise was limited to a single vowel with formants at 500, 2500, 3500, 4500 Hz and a constant-amplitude and constant-shape glottal pulse. Harmonic power spectra were computed for all F0 values and the rms intensity of an individual glottal pulse was derived.
The oscillatory pattern arises from the interaction between the harmonics and the peak of the envelope. The peaks of the oscillatory curve occur when a harmonic coincides with the resonance frequency (top). This happens at n*F0 = Fn. The minima correspond to situations where F0*(2n + 1)/2 = Fn. This is the condition of two harmonics straddling the peak (bottom).
We conclude that formant amplitudes and vowel intensity are strongly F0-dependent in two ways. As F0 is doubled the number of glottal pulses within the window of computation similarly doubles. Hence the final curve shows a component of a +6 dB/octave rise. Moreover, superimposed on this there is the interaction with harmonic structure. These effects combined make the curve rise by more than 15 dB.
Finally, we should mention that vocal effort and phonation type add to the variability of spectral amplitudes since they influence the overall spectral tilt. For instance a breathy voice dominated by the first harmonic has a steeper source spectrum than modal voice. Pressed phonation on the other hand is associated with a marked closure of the vocal folds and thus its spectral slope tends to be less steep than modal voice.
2. Listener responses to formant and spectrum variations
The remarkable thing about all these amplitude variations is that, although they can be drastic and can be perceived, they seem to leave the timber/vowel quality component of the stimulus virtually unaltered.
For instance, in trying to recreate a recorded utterance by means of high-fidelity copy synthesis, phoneticians have noted that the percept of a vowel's “phonetic quality” that is, its “timber” transmitted in parallel with voice quality and channel characteristics – can be astonishingly impervious to significant changes in bandwidth, spectral tilt, and formant amplitudes. This was demonstrated in an investigation by Carlson et al. (1979) who undertook an experimental mapping of the relative salience of such acoustic manipulations.
Noting that the distance measures used by Plomp (1970) and Bladon and Lindblom (1981) are very sensitive to differences in overall level, bandwidth, spectral tilt, and formant amplitudes, Klatt published several papers where he discusses various ways of remedying the situation (Klatt, 1982a,b). He proposed the weighted spectral slope metric (WSM), a measure that, unlike the Plomp approach, does not assign equal weight to all frequencies but gives prominence to differences in formant peak frequencies. Klatt's measure and three other models were later experimentally evaluated by Assmann and Summerfield (1989) who found that the best performing metric was an elaboration of Klatt's slope-based WSM proposal.
Is it possible to make sense of all these observations by considering how the auditory system processes vowel waveforms?
3. Phase locking
Comparing the auditory system to an analog or simulated spectrograph highlights a significant difference between biological and current technological sound analysis. Whereas conventional speech spectrography averages the temporal output from the analysis filters, the auditory system takes the process further making ingenious use of this information. Simplifying we can say that the ear's operation is similar to a filter followed by a zero crossing counter.
Suppose we examine the output of a filter whose center frequency is near, but not identical to, a single resonance peak. What frequency does the zero crossing counter indicate? The center frequency of the filter? Or the frequency of the formant peak? The answer depends on several factors such as frequency distance to the formant and the filter bandwidth. The important point is that, for any critical-band analysis of a vowel, it will more often than not be the case that a given resonance frequency is picked up as the zero crossing frequency by a broad range of frequencies surrounding the resonance maximum.
The synchronization of the filter output periodicities to a nearby dominant spectral frequency is known as ‘phase locking’. It is a phenomenon well known in engineering. And, for frequencies less than 4–5 kHz, it has been demonstrated in numerous physiological experiments e.g., in the form of so-called PST (post-stimulus time) histograms, period histograms or inter-spike interval histograms (Rose et al., 1967; Sachs et al., 1982).
Fig. 3 is adapted from work by Delgutte and Kiang (1984) who stimulated the fibers of the auditory nerve in cats. The diagram presents the responses to an [ε]-like vowel stimulus. The plot shows the characteristic frequency of the auditory nerve fibers along the x-axis and the periodicity (“Dominant Frequency” (DF)) recorded in the respective fibers across the frequency range. As can be seen, the fundamental frequency and the first two formants are redundantly represented by broad range of units adjacent in frequency to the formant maxima (black thick horizontal bands).
Fig. 3.
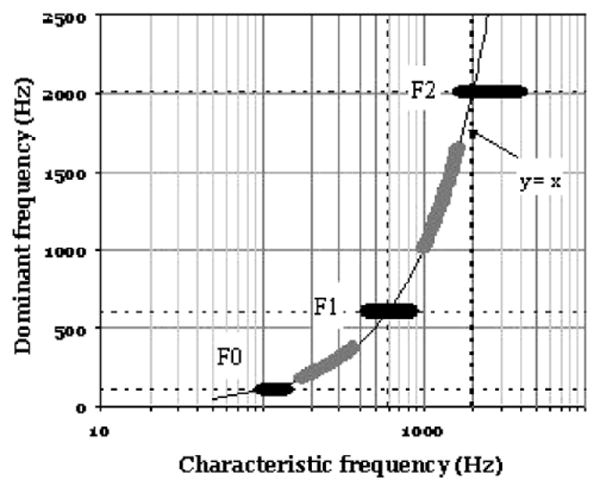
A schematic diagram summarizing the discharge pattern of auditory-nerve fibers in anesthetized cats. The x-axis shows the characteristic frequency (CF) of the nerve fiber. The y-axis indicates the frequency with which the fiber response is synchronized, i.e., the Dominant Frequency. The data were recorded in response to a steady-state two-formant vowel presented at 75 dB SPL. In particular, the dark horizontal bands of the diagram highlight the tendency for strong spectral components such the formant frequencies and the fundamental frequency to be represented by broad bands of fibers with adjacent CFs. (Adapted from (Delgutte and Kiang, 1984)).
The significance of phase locking for the study of speech perception may not have been fully appreciated yet. Nonetheless the availability of time-place information in the auditory system can be linked to the fact that speech perception remains robust also in noisy environments (Greenberg, 1998).
4. Computational models
4.1. DOMIN: an auditory spectrograph
Most public-domain software tools for speech analysis do not incorporate time-place representations. The “auditory” spectrograph described by Carlson and Granström (1982) is an exception. It was a pioneering effort. Spectrograms were produced using critical-band analysis, and filter outputs were displayed in phon/Bark units. Included in the model was a Dominant Frequency (DF) representation showing the number of channels dominated by (read: ‘phase locked to’) a certain frequency plotted against the center frequency of the analyzing channel.
When information obtained from such DF histograms was superimposed on spectrographic displays of utterances spoken by a male, it appeared as contours through the formant bands and the first few harmonics tracking their frequency variations over time.
Significantly for our discussion of the perceptual role of spectral amplitudes, DF traces could also be plotted during amplitude-weak portions of the spectrogram. For instance, the figures published by Carlson and Granström clearly show the second and third formants during the occlusion of a voiced stop which are not usually visible on spectrograms with normal settings of the analysis options.
4.2. The KONVERT model
In our own work we have been inspired by the DOMIN model and the experimental research that preceded it (Carlson et al., 1975; Carlson and Granström, 1979; Blomberg et al., 1984).
KONVERT is a software tool developed as a tool for deriving auditory representation of steady-state vowels from its acoustic specifications.
KONVERT computes the auditory spectrum of an arbitrary vowel in the following steps:
Its input is a table of formant frequencies for the vowels to be analyzed. In a second step it calculates formant bandwidths (Fant, 1972) and derives the harmonic spectrum of each vowel using standard assumptions about voice source, radiation, and higher-pole correction (Fant, 1960).
The amplitudes are calibrated in absolute dB. A reference value of 70 dB SPL is assigned to one of the input vowels. Frequencies in Hz are converted to Bark units.
The power spectrum of each input vowel is then convolved with an auditory filter function to produce an excitation pattern calibrated in dB/Bark versus Bark. A choice of an ERB filter (equivalent rectangular bandwidth, Moore and Glasberg, 1983), or a Schroeder-type curve (Schroeder et al., 1979), is available to simulate the smearing induced by basilar membrane mechanics and neural processing.
A correction for the ear's frequency response is introduced by means of the equal loudness contours (Fletcher and Munson, 1933). This calibrates the vowel spectra in phon/Bark versus Bark. Given this information a loudness density plot is constructed with sones/Bark on the y-axis and Bark on the abscissa (Zwicker and Feldtkeller, 1967; Schroeder et al., 1979).
As a complement to the above frequency domain approach, KONVERT can also provide a temporal analysis and identify phase locking and DFs at the output of the auditory filtering. This is done by applying the inverse Fourier transform (FFT) to the output of each auditory filter channel so as to create a set of time domain signals. The Dominant Frequencies are found by making separate counts of positive-going and negative-going zero crossings and by averaging the two [counts/(signal length)]. This procedure gives one DF for each Bark bin in each vowel. The result of this step can be displayed as a staircase diagram as in Fig. 3 or as a DF histogram with the number of channels versus channel frequency (Fig. 4).
Fig. 4.
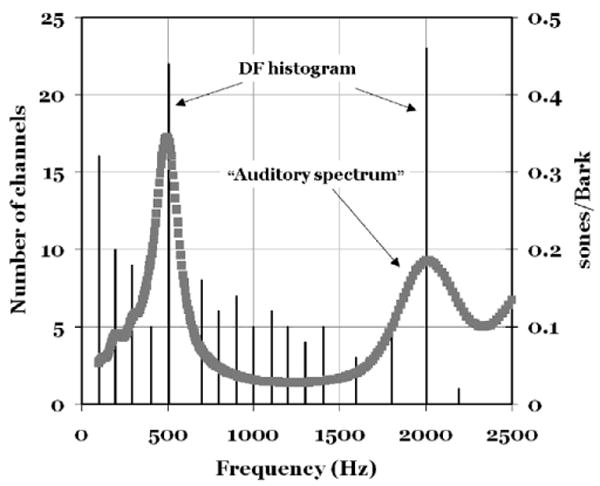
This figure shows examples of KONVERT output for a vowel with an [ε]-like formant pattern. Dominant Frequencies (DFs) are plotted as vertical lines. A given line indicates the number of channels that carry that line's frequency (in Hz). Superimposed is an “auditory spectrum” plotted with sone/Bark (on the right ordinate) versus frequency.
5. Some properties of DF representations
5.1. Formants
Fig. 4 combines two KONVERT representations: A DF histogram and a sone/Bark pattern. The vowel is [ε]-like computed with F1 = 500, F2 = 2000, F3 = 2700 and F4 = 3300 Hz and F0 = 100 Hz. The x-axis represents frequency (in Hz). Number of channels is represented on the left ordinate. The sone/Bark values should be read along the second y-axis (right). Ten bins per Bark were used.
It is immediately clear that the frequencies with the largest number of channels are located at the peaks in the spectrum curve. If we single out the tallest three lines, we find that they correspond to the fundamental frequency and the first and the second formants. Those are the most dominant DFs in this display.
We also note that there are lines at other frequencies. They look like “harmonics”. In fact, on close inspection, they appear in frequency bins identical with, or close to, the frequencies of the harmonics. This may at first seem puzzling since the auditory filtering uses critical bands that increase in size with frequency. Therefore should it really resolve individual harmonics? Should it not smear them?
A moment's reflection will convince us that harmonics can indeed survive broad-band filtering. In producing a broad-band spectral envelope, KONVERT applies the auditory filter at a particular Bark bin and performs an averaging to provide a single output number for that channel. In zero crossing detection that step is not taken. Instead the procedure examines the periodicity of the output which is determined by the strongest harmonic component at the frequency under analysis. Therefore, the DFs can be expected to lock to harmonics – an observation that is also readily made in the records of the physiological literature (Sachs et al., 1982).
We infer from Fig. 4 that, as a large number of channels lock on to F2 at 2000 Hz and to F1 at 500 Hz, the dominance of these frequencies pre-empts the default activity of neighboring channels and forces them to synchronize.
Is this result fortuitous? Or is it typical of DF detection as a mechanism for formant tracking? (See Fig. 5).
Fig. 5.
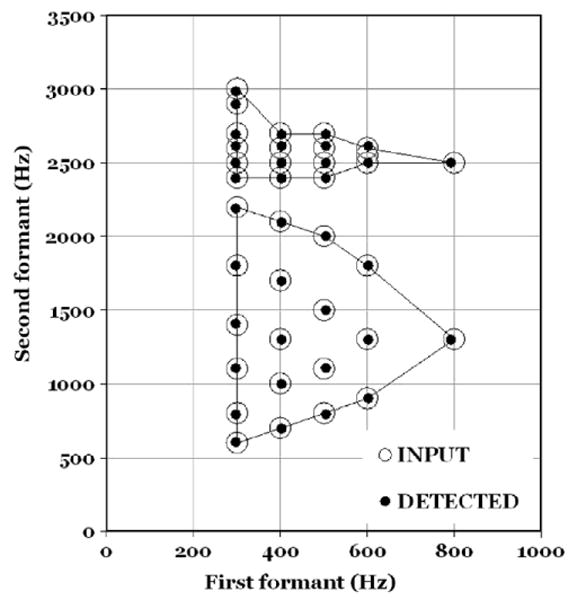
This figure shows a comparison of input formant patterns (large open circles) and the formant values as determined by a DF-based formant detection test.
We ran the following exploratory test. The input data file consisted of the formant patterns of the reference vowels in Fig. 1. In order to guarantee that every formant peak would coincide with a harmonic, an F0 of 100 Hz was chosen and formant frequencies were slightly adjusted to the value of the nearest multiple of F0. In other words, the definition of spectral peaks (more on this topic in connection with Fig. 6) was comparable for all vowels and frequencies.
Fig. 6.
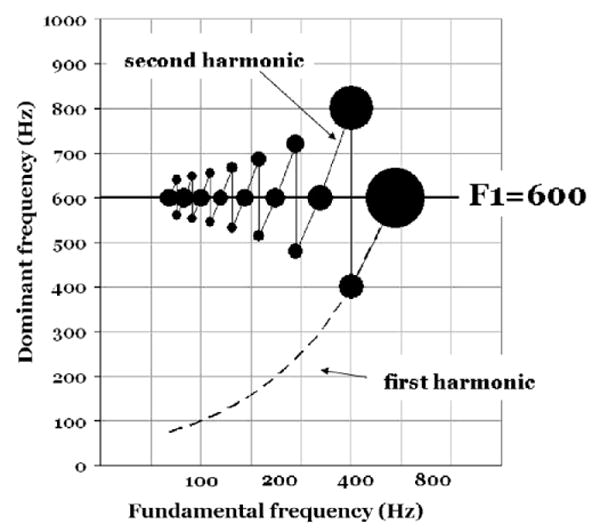
This figure shows how the DFs vary as F0 is changed from 75 Hz to 600 Hz in the region around a first formant at 600 Hz. DFs were measured for F0:s where the formant peak coincided with a harmonic and where two harmonics are symmetrically positioned above and below 600 Hz. The areas of the filled circles are proportional to the number channels at the indicated DF frequency.
Individual DF histograms were produced as tables with two columns: channel frequencies and their associated dominance scores (=the number of channels that carry a given channel's frequency). For each vowel the channel frequencies were rank ordered with respect to dominance – that is, from the maximum to the minimum number of channels. Only the top four scores were retained. Our question was: What channel frequencies would be the winners?
We found that the first four places were invariably occupied by channel frequencies corresponding to the first three formant peaks and to the fundamental frequency. These four parameters shifted their ranks from vowel to vowel but there were no intrusions by other DFs. When plotted in the format of Fig. 4 all the vowels show the strongest DFs at the maxima of the sone/Bark curve.
This result is valid only for vowels with coincidence between F0 multiples and formant peaks. So next we need to ask: How well do DFs perform on formant tracking under more general and natural conditions, for instance, when the F-pattern and F0 are varied independently and do not show cases of coincidence?
Fig. 6 illustrates how the DF pattern varies in the vicinity of a formant peak as F0 increases in frequency. Like Fig. 2 this diagram demonstrates the interaction between a steady-state formant and F0. In Fig. 2 the F0-dependence of vowel intensity was presented. Fig. 6 shifts the focus to the behavior of DFs under similar conditions.
The formant of interest was set at 600 Hz, the remaining formants at 2500, 3500 and 4500 Hz. F0 values were chosen in accordance with F0 = nFn (=peak − harmonic coincidence) and F0 = 2Fn/(2n +1) (=two harmonics equidistant from peak). The degree of dominance (number of channels) is coded in terms the areas of the black circles.
We see from Fig. 6 that the F0 = 2Fn/(2n + 1) condition tends to assign the available channels about evenly to two DFs surrounding the formant frequency. In cases of F0 = n*Fn, the harmonic at the resonance frequency is the clear winner. At F0 = 600 Hz a single harmonic is present below 1200 Hz. In such splendid isolation its frequency dominates all the channels in the neighborhood (cf size of circle).
Our conclusion is that the DFs do not track the F1 frequency at 600 Hz. Rather they appear to follow the strongest harmonic(s). Accordingly, the DFs should not literally be seen as formant trackers. Things are not that simple.
But they may come close when we look at DFs dynamically. Assume that there is a certain temporal persistence in the moment-to-moment DF record. Such a three-dimensional record with DF-dominance (number of channels), frequency and time could be used for reconstructing the spectral envelope and improving formant definition. This suggestion is supported by evidence in the experimental literature (Diehl et al., 1996) and might also offer a way of modeling vowel quality differences in a manner more independent of F0 (cf Klatt, 1982a).
5.2. Spectral amplitudes
We have several times referred to the fact that variation in formant frequencies produce much more drastic changes in phonetic vowel quality than differences in overall level, bandwidth, spectral tilt, and formant amplitudes.
We now have an opportunity to investigate how spectral amplitudes are represented by our auditory model KONVERT. We selected the [ε] vowel of Fig. 4 and had KONVERT impose 4 different degrees of spectral tilt on it. The [ε] spectrum was first filtered with spectral slopes of 0, +6 dB/, −6 and −12dB/octave and was then processed to produce DF histograms and sone/Bark patterns.
Our computational experiments indicate that the DF patterns remain pretty much unaltered by changes in spectral tilt. Fig. 7 illustrates that finding. This result is significant in that it parallels the perceptual constancy of vowel quality across moderate changes in spectral tilt.
Fig. 7.
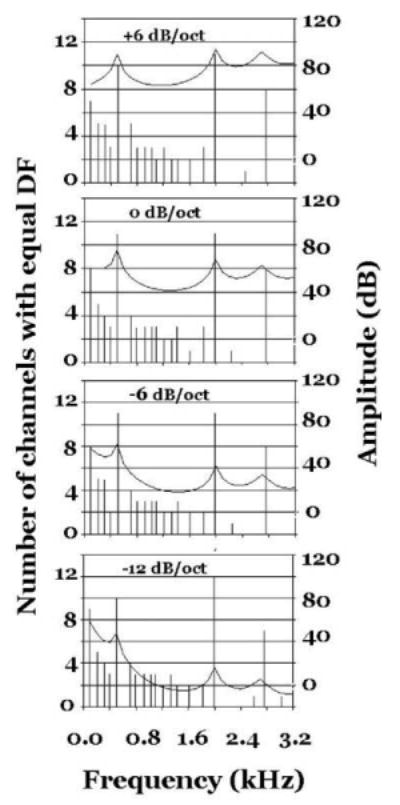
DF representations and spectral envelopes for the vowel [ε] as a function of spectral tilt (dB/oct). As the spectral slope varies the DF patterns remain practically constant. This result is interesting in that it parallels the perceptual constancy of vowel quality across moderate changes in spectral tilt.
6. Concluding Remarks
Building on the work of Carlson and Granström, we demonstrated how a realistic auditory model of vowel processing (KONVERT) can represent information about both whole spectra and formant patterns (i.e., F1, F2 and F3). Whole spectra are represented as the output of a critical-band filterbank (i.e., excitation patterns), whereas F0 and formants (as carried by their strong harmonics) are captured by Dominant Frequency histograms that model the effects of phase locking in auditory neurons.
Apart from its greater realism, the hybrid character of KONVERT's frequency coding has an important advantage over approaches that emphasize whole spectra alone, or formant patterns alone. Listener judgments of phonetic distances among vowels are affected mainly by formant pattern differences; however, judgments of psychophysical distances among vowels are also affected by other spectral differences such as formant bandwidth and spectral tilt (Carlson et al., 1970, 1979; Carlson and Granström, 1976; Klatt, 1982a,b). These observations are consistent with the following claims: (1) the auditory representation of vowels includes both whole-spectrum and formant pattern information, and (2) depending on the task and situational conditions, listeners can make use of either or both types of information.
Finally, it is worth noting that while temporal coding of frequency has been well documented by auditory physiologists, there has been considerable debate among psychoacousticians about the functional role of phase locking in monaural hearing (for a skeptical view, see Viemeister et al., 2002). The results of our modeling experiments suggest that the temporal fine structure of the signal may after all play a very significant role, viz., in the domain of speech perception.
Footnotes
Formant envelopes were computed according to Eq. (1.3)–(5b), page 53 in (Fant, 1960); Radiation and source by means of Eq. (1.3)–(2), page 49; Higher-pole correction was derived according to Eq. (1.3)–(4a), page 50; Bandwidths were calculated as in (Fant, 1972).
Publisher's Disclaimer: This article appeared in a journal published by Elsevier. The attached copy is furnished to the author for internal non-commercial research and education use, including for instruction at the authors institution and sharing with colleagues.
Other uses, including reproduction and distribution, or selling or licensing copies, or posting to personal, institutional or third party websites are prohibited.
In most cases authors are permitted to post their version of the article (e.g. in Word or Tex form) to their personal website or institutional repository. Authors requiring further information regarding Elsevier's archiving and manuscript policies are encouraged to visit: http://www.elsevier.com/copyright
Contributor Information
Björn Lindblom, Email: lindblom@ling.su.se.
Randy Diehl, Email: diehl@psy.utex-as.edu.
Carl Creeger, Email: creeger@psy.utexas.edu.
References
- Assmann, Summerfield Modeling the perception of concurrent vowels: vowels with the same fundamental frequency. J Acoust Soc Am. 1989;85(1):327–338. doi: 10.1121/1.397684. [DOI] [PubMed] [Google Scholar]
- Bladon RAW, Lindblom B. Modeling the judgment of vowel quality differences. J Acoust Soc Am. 1981;69:1414–1422. doi: 10.1121/1.385824. [DOI] [PubMed] [Google Scholar]
- Blomberg M, Carlson R, Elenius K, Granstrom B. Auditory models in isolated word recognition In: Acoustics, Speech, and Signal Processing. IEEE International Conference on ICASSP'84; 1984. pp. 33–36. [Google Scholar]
- Carlson R, Granström B. STL-QPSR. 23. Vol. 17. Royal Institute of Technology; Stockholm: 1976. Detectability of changes of level and spectral slope in vowels; pp. 1–4. Available at: < http://www.speech.kth.se/qpsr/ >. [Google Scholar]
- Carlson R, Granström B. STL-QPSR. 34. Vol. 20. Royal Institute of Technology; Stockholm: 1979. Model predictions of vowel dissimilarity; pp. 84–104. Available at: < http://www.speech.kth.se/qpsr/>. [Google Scholar]
- Carlson R, Granström B. Towards an auditory spectrograph. In: Carlson R, Granström B, editors. The Representation of Speech in the Peripheral Auditory System. Elsevier Biomedical; Amsterdam: 1982. pp. 109–114. [Google Scholar]
- Carlson R, Granström B, Fant G. STL-QPSR. 2-3. Royal Institute of Technology; Stockholm: 1970. Some studies concerning perception of isolated vowels; pp. 19–35. Available at: < http://www.speech.kth.se/qpsr/>. [Google Scholar]
- Carlson R, Fant G, Granström B. Two-formant models, pitch and vowel perception. In: Fant G, Tatham MAA, editors. Auditory Analysis and Perception of Speech. Academic Press; London: 1975. [Google Scholar]
- Carlson R, Granström B, Klatt DH. STL-QPSR. 3-4. Royal Institute of Technology; Stockholm: 1979. Vowel perception: the relative perceptual salience of selected acoustic manipulations; pp. 3–83. Available at: < http://www.speech.kth.se/qpsr/>. [Google Scholar]
- Delgutte B, Kiang N. Speech coding in the auditory nerve I: vowel-like sounds. J Acoust Soc Am. 1984;75:866–878. doi: 10.1121/1.390596. [DOI] [PubMed] [Google Scholar]
- Diehl RL, Lindblom B, Hoemeke KA, Fahey RP. On explaining certain male–female differences in the phonetic realization of vowel categories. J Phonetics. 1996;24:187–208. [Google Scholar]
- Fant G. Acoustic Theory of Speech Production. Mouton; The Hague, Netherlands: 1960. [Google Scholar]
- Fant G. STL-QPSR. 2-3. Royal Institute of Technology; Stockholm: 1972. Vocal tract wall effects, losses, and resonance bandwidths; pp. 28–52. Available at: < http://www.speech.kth.se/qpsr/>. [Google Scholar]
- Fant G, Fintoft K, Liljencrants J, Lindblom B, Martony J. Formant amplitude measurements. J Acoust Soc Am. 1963;35:1753–1761. [Google Scholar]
- Fletcher H, Munson WA. Loudness, its definition, measurement and calculation. J Acoust Soc Am. 1933;5:82–108. [Google Scholar]
- Greenberg S. Acoustic transduction in the auditory periphery. J Phonetics. 1998;16:3–17. [Google Scholar]
- Klatt DH. Speech processing strategies based on auditory models. In: Carlson R, Granström B, editors. The Representation of Speech in the Peripheral Auditory System. Elsevier Biomedical; Amsterdam: 1982a. pp. 181–196. [Google Scholar]
- Klatt DH. Predictions of perceived phonetic distance from critical-band spectra: a first step. IEEE ICASSP; 1982b. pp. 1278–1281. [Google Scholar]
- Liljencrants J, Lindblom B. Numerical simulation of vowel quality systems: the role of perceptual contrast. Language. 1972;48:839–862. [Google Scholar]
- Lindblom B. Phonetic universals in vowel systems. In: Ohala JJ, Jaeger J, editors. Experimental Phonology. Academic Press; Orlando, FL: 1986. pp. 13–44. [Google Scholar]
- Moore BCJ, Glasberg BR. Suggested formulae for calculating auditory-filter bandwidth and excitation patterns. J Acoust Soc Am. 1983;74:750–753. doi: 10.1121/1.389861. [DOI] [PubMed] [Google Scholar]
- Plomp R. Timbre as a multidimensional attribute of complex tones. In: Plomp R, Smoorenburg GF, editors. Frequency Analysis and Periodicity Detection in Hearing. Sijthoff; Leiden, The Netherlands: 1970. [Google Scholar]
- Rose JE, Brugge JF, Anderson DJ, Hind JE. Phase-locked response to low-frequency tones in single auditory nerve fibers of the squirrel monkey. J Neurophysiol. 1967;32:402–423. doi: 10.1152/jn.1967.30.4.769. [DOI] [PubMed] [Google Scholar]
- Sachs M, Young E, Miller M. Encoding of speech features in the auditory nerve. In: Carlson R, Granström B, editors. The Representation of Speech in the Peripheral Auditory System. Elsevier Biomedical; Amsterdam: 1982. pp. 115–130. [Google Scholar]
- Schroeder MR, Atal BS, Hall JL. Objective measure of certain speech signal degradations based on masking properties of human auditory perception. In: Lindblom B, Öhman S, editors. Frontiers of Speech Communication Research. Academic Press; London: 1979. pp. 217–229. [Google Scholar]
- Viemeister NF, Rickert M, Law M, Stellmack MA. Psychophysical and physiological aspects of auditory temporal processing. In: Tranebjaerg L, Christen-Dalsgaard J, Andersen T, Poulsen T, editors. Genetics and the Function of the Auditory System: Proceedings of the 19th Danavox Symposium; Denmark: Holmens Trykkeri; 2002. pp. 273–291. [Google Scholar]
- Zwicker E, Feldtkeller R. Das Ohr als Nachrichtenempfänger. Hirzel Verlag; Stuttgart: 1967. [Google Scholar]


