

Abstract
Background
Identification of genes involved in complex cardiovascular disease traits has proven challenging. Inbred animal models can facilitate genetic studies of disease traits. The spontaneously hypertensive rat (SHR) is an inbred model of hypertension that exists in several closely related, but genetically distinct lines.
Methods and Results
We used renal gene expression profiling across 3 distinct SHR lines to identify genes that show different expression in SHR than in the genetically related normotensive control strain, WKY. In order to ensure robust discovery of genes showing SHR-specific expression differences we considered only those genes in which differential expression is replicated in multiple animals of each of multiple hypertensive rat lines at multiple time points during the ontogeny of hypertension. Mutation analysis was performed on the identified genes to uncover allelic variation. We identified those genes where all SHR lines share a single allele of the gene while normotensive controls (WKY) have fixed the alternative allele. We then identified which of the differentially expressed genes show expression that is controlled by the alleleic variation present in and around the gene. Allelic expression was demonstrated by observing the effect on gene expression of alleles inherited in the freely segregating F2 progeny of a cross between SHR and WKY animals.
Conclusions
The result of these studies is the identification of several genes (Ptprj, Ela1, Dapk-2, Gstt2) in which each of 4 SHR lines examined have fixed the same allele and in which each of 2 WKY lines have a contrasting allele for which the inherited allele influences the level of gene expression. We further show that alleles of these genes lie in extensive haplotype blocks that have been inherited identical by descent in the hypertensive lines.
Keywords: Genetic hypertension, spontaneously hypertensive rat, gene expression, kidney, candidate genes, gene array, identical by descent, haplotype
Introduction
There is growing evidence that the evolution of organismal diversity arises from progressively more elaborate regulation of gene expression. Similarly, within a species, heritable effects on gene expression are an important element of phenotypic diversity. Such heritable effects can arise from sequence variation within a gene and its adjacent regulatory sequences, a condition termed alleleic expression In the present project we have sought to identify renal genes possessing alleleic expression that have been fixed during the selective inbreeding of rats sharing an important cardiovascular phenotype arising from the kidney: arterial hypertension. The spontaneously hypertensive rat (SHR) was generated from the outbred Wistar strain via selection to fix the trait of elevated arterial blood pressure. This was followed by brother-sister mating through multiple generations to achieve homozygosity 1. Fixation of alleles affecting gene expression in SHR may have occurred by chance, because the alleles lie in linkage disequilibrium with a gene subject to selection for the trait of interest (in which case they are positional markers of such genes) or because they contribute to the trait under selection.
In the studies reported here we have used genome-wide gene expression analysis in 3 distinct lines of SHR and the related normotensive line, Wistar-Kyoto (WKY) to identify genes that share differential expression in SHR lines compared with WKY. We have then examined these genes for sequence variation across SHR and WKY and determined which genes possess alleles shared by all the SHR lines, but not by WKY. We have then determined which SHR alleles affect gene expression in cis. This was performed in an F2 intercross by examining the relationship between inheritance of SHR alleles and gene expression. Finally, we have examined which of these genes lie in genomic blocks that have been inherited identical by descent (IBD) by all SHR lines in which the WKY region arise from a contrasting ancestral block. This work identifies chromosomal regions that are IBD in multiple lines of SHR that are not shared by the normotensive control line WKY, and may therefore include hypertension loci. In addition, it identifies individual genes lying within these IBD regions that can give rise to phenotypes via allelic expression.
Methods
An outline of the experimental approach and hypotheses tested in these studies is provided in a flow chart included as supplementary data (Supplemental File 1).
Animals and measurements
Studies were performed on 4, 8, 12 and 18 week-old male animals. We used Wistar-Kyoto (WKY-Heid) and spontaneously hypertensive-A3 rats (SHR-A3, SHRSP, SHR-stroke prone) that have been maintained in our facility for 8 years. We also used SHR-B2 and SHR-C animals bred from stocks generously provided to our laboratory in 2002 by Professor T. Suzuki, Kinki University School of Medicine, Japan that are descended from the original SHR lines reported by Okamoto 2. All animals used in the studies were produced in our breeding program and housed under controlled conditions in an AAALAC-approved animal facility. Animals were provided a standard rodent chow diet and drinking water ad libitum. We also obtained genomic DNA samples from SHR/NCrl and WKY/NCrl animals purchased from a commercial supplier (Charles River Laboratories, Wilmington, MA). We have represented the genealogical relationships between these SHR lines in a recent paper 3. Two F2 intercrosses were generated. One was derived from a cross between SHR-A3 male and WKY-Heid female animals. The other was produced by intercrossing SHR-A3 males with SHR-B2 females. Only male progeny were studied.
Blood pressure was measured by radiotelemetry (Data Sciences, St. Paul, MN) in adult animals 16-19 wks of age from SHR-A3 and SHR-B2 as well as the F1 and F2 progeny of an intercross of these lines. Telemetry catheters were implanted in the abdominal aorta in animals under isoflurane anesthesia. Recordings were begun 7 days after implantation and continued for 5-7 days.
For tissue collection, animals were anesthetized by isoflurane inhalation and kidneys were rapidly dissected via ventral laparotomy. Renal gene expression analysis was performed by microarray using total RNA preparations from axial renal segments including cortex and medulla. Ureteric pelvis and major vascular structures of the renal sinus were removed from the sample. Each sample from each animal was treated as an independent sample and no pooling was performed.
Gene array analysis
Transcript abundance was determined using the Affymetrix rat RG-U34A array containing probe sets for approximately 8,000 rat genes and EST's and the RG-E230A array containing probe sets for approximately 16,000 rat genes and EST's following the manufacturer's recommended protocols and our previously reported methods 4, 5. The RG-U34A arrays were used to interrogate gene expression in SHR-A3, SHR-B2, SHR-C and WKY-Heid animals at each of the 4 age groups studied with independent replicates of 3-4 animals per group, per age. This data set has been deposited in the NCBI Gene Expression Omnibus (GEO database) with series accession number GSE2104. Chip fluorescence data was analyzed using the Affymetrix MicroArray Suite 5.0 software package. Expression signals from each array were normalized to allow cross-sample ad group comparison using the procedure recommended by Affymetrix to multiply raw fluorescence signals by a scaling factor such that the trimmed mean (excluding 2% highest and 2% lowest) of signals is always the same. We used the E230A array to analyze kidney RNA from 4 SHR-A3 animals and 4 WKY animals (aged 4wks) as a means of validating expression differences observed using the RG U34A array. We also analyzed gene expression using the E230A array in kidney RNA samples from 10 individual 18 wk old F2 progeny of an SHR-A3 × WKY cross.
Polymorphism detection
We used denaturing HPLC (dHPLC, Transgenomic, Wave System, San Jose, CA) to survey the proximal 5′ regulatory region (∼1kb), entire exons and adjacent intron segments of persistently differentially expressed genes and EST sequences for sequence variation. PCR primers were designed to amplify genomic sequences of approximately 700bp. A single amplification reaction was performed with each primer pair using a mixture of equal amounts of genomic DNA from SHR-A3 and WKY-Heid animals and the resulting amplified DNA was analyzed directly for evidence of heteroduplex formation. Polymorphisms that could be detected using this screening approach included insertion and deletion polymorphisms and simple sequence length polymorphisms. The formation of heteroduplexes was indicated in dHPLC by presence of more than one DNA duplex peak with the main peak eluting at the time expected for its fully hybridized strands and with one or more earlier peaks presumed to represent reduced HPLC retention due partial denaturation around DNA duplex mismatches resulting from genetic dimorphism. Amplicons indicating heteroduplex formation were noted and the corresponding amplicons from SHR-A3 and WKY were amplified individually and submitted for re-sequencing to identify the dimorphic base residues.
Genotyping
We determined the allelic state of each polymorphic gene by genotyping genomic DNA from WKY-Heid WKY/NCrl, SHR-A3, SHR-B2, SHR-C and SHR/NCrl animals. Genotyping was also performed on F2 animals from a SHR-A3 × WKY-Heid cross. We used the Sequenom (Mass Array, Sequenom, San Diego, CA) implementation of genotyping by mass spectrometric analysis of oligonucleotides extended across single nucleotide polymorphisms in PCR amplified genomic DNA 6, 7.
Bioinformatics
We have exploited existing microsatellite (SSLP) and single nucleotide polymorphism (SNP) allele data to extend the interpretation of our findings. This data is derived from the Allele Characterization Project, a component of the Rat Genome Project and is available through the Rat Genome Database 8 and from Ensembl via the European Union Rat SNP project (http://www.snp-star.de/). Genomic SSLP data was available for two SHR lines (SHR/OlaHsd and SHRSP/Riv) and one WKY line (WKY/OlaHsd). These lines are closely related to, and may be identical to, the SHR/NCrl, SHR-A3 and WKY/NCrl lines, respectively, used in our studies. We used this data to assess the degree of allelic identity in these SSLP's among and across SHR and WKY lines. We further sought evidence that regions identified as IBD in our SHR lines that have non-identical counterparts in WKY could be further supported as regions of exclusive SHR IBD using SSLP data. We examined recently available genome-wide SNP data in the same manner, seeking evidence of extended haplotypes across additional WKY (WKY, WKY/Izm. WKY/NMna) and SHR lines (SHR, SHR/Izm, SHR/Kyo, SHR/NHsd, SHRSP, SHRSP/Ezo, SHRSP/Izm, SHRSP/Ngsk) in regions harboring allelic expression specific to SHR lines. This comparison was made using the Snplotyper tool (http://snplotyper.mcw.edu/) and provides higher marker density and strain representation than the SSLP data.
Statistical Analysis
A nominal p-value of 0.05 (Mann-Whitney test) was considered statistically significant for the purposes of comparison of gene expression array data between WKY and SHR lines at each age. Genes were selected for further study if this level of significance was reached when comparing each SHR line with WKY at all 4 ages tested. Thus each gene emerging from the overall analysis did so after achieving statistically significant expression differences across all 4 time points. The resulting high level of statistical significance required for follow up study (0.05)4 may have had the effect of elimination of genes that do in fact have allelic effects on expression. However, such genes are clearly subject to effects on expression from other regulatory mechanisms that diminish or make less persistent the allelic effect on expression. Such genes may not have the magnitude or persistence of effect to contribute to the strongly contrasting phenotype of blood pressure by which all SHRs are distinct from WKY lines. Thus, the risk from erroneously excluding such genes may not be large.
Results
Several published reports have indicated that systolic blood pressure is not a trait that segregates among the F2 progeny of intercrosses among SHR lines. This has been reported for crosses between SHR-A3 and SHR/N and between SHR-A3 and SHR-C 9-11. In each case, blood pressure was measured by tail cuff, a method no longer recommended in the present context 12 that can contribute to relatively large within group variances that reduce statistical power and can lead to Type II error. In the present studies using radiotelemetry measurements we observed that SHR-A3 have higher blood pressure the F2 progeny of an SHR-A3 × SHR-B2 cross (Table 1). However, no difference was found in all other inter-group comparisons. The distribution of blood pressure across these groups and crosses supports the expectation from genealogy that hypertension arises from a set of alleles largely shared by SHR lines and our results here support and extend prior evidence of hypertension allele sharing across these lines.
Table 1.
Blood pressure levels measure by radiotelemetry in SHR parental lines SHR-A3 and SHR-B2 and in the F2 progeny of a cross between these lines. The only statistically significant differences when comparing across the four groups of animals was between SHR-A3 and the F2 A3 XB2 (p<0.05). Statistical analysis in multiple group comparisons was performed by ANOVA followed by Tukey's HSD test of significance.
| Line/Cross | n | Systolic | SEM | Mean | SEM | Diastolic | SEM |
|---|---|---|---|---|---|---|---|
| SHR-A3 | 16 | 198.6 | 3.9 | 171.7 | 3.2 | 144.6 | 2.8 |
| SHR-B2 | 20 | 186.7 | 2.5 | 158.8 | 3.3 | 136.3 | 2.6 |
| F1 A3 × B2 | 13 | 195.0 | 4.6 | 160.1 | 1.7 | 133.8 | 2.0 |
| F2 A3 × B2 | 121 | 184.0 | 1.3 | 158.1 | 1.4 | 132.3 | 1.3 |
In SHR, hypertension is a phenotype that can be transmitted by renal transplantation 13, indicating that genes expressed in kidney are essential to the phenotype. Gene expression studies comparing renal gene expression in WKY-Heid with that in 3 SHR lines (SHR-A3, -B2 and -C) at 4 different ages: 4, 8, 12 and 18wks) using Affymetrix RG-U34A arrays revealed genes that are persistently differentially expressed at all 4 ages when WKY was compared to each SHR line 3. In the present study we obtained independent verification of differential gene expression with an alternative array hybridization platform (Affymetrix E230A array) that uses probe-sets derived from a different hybridization oligonucleotide selection method to determine expression of each gene. Table 2 indicates the 36 genes and EST's found to be differentially expressed between WKY and all SHR lines using the U34A array and indicates that 27 demonstrated statistically significant differences in expression (of similar direction) when tested on the E230A array. We were unable to confirm differences in the remaining 9 genes, 6 of which showed mean levels differing non-significantly, but in the same direction as previously observed. Only 2 genes showed expression levels on the E230 array whose mean values were in the opposite direction compared to that observed using the RG U34A array. In the case of Sod1, initial observation of differential expression was not confirmed, but was explained by polymorphism in the gene that we detected. Resequencing Sod1 in the two rat strains across the RGU34A hybridization probes revealed an insertion-deletion polymorphism in the transcribed sequence from which differential array hybridization signals arose.
Table 2.
Re-evaluation of 36 genes and EST's showing persistent differential gene expression between WKY and all SHR lines. The reproducibility of gene expression differences observed with the RG-U34A array was re-examined using the E230A array. All except the two shaded genes were found to have similar directional changes in expression. Among the other genes, Sod1 was found to have an indel polymorphism across hybridization probes used in the RGU34A array, but not in the E230A array, while 6 genes were found not to reach statistical significance in this comparison.
| Gene symbol | Gene | SHR-A3 | Sdev | WKY | Sdev | p |
|---|---|---|---|---|---|---|
| Afm | afamin | 739 | 72 | 1393 | 135 | 0.014 |
| Bhmt | betaine-homocysteine methyltransferase | 330 | 47 | 373 | 30 | 0.271 |
| Ddt | D-dopachrome tautomerase | 4041 | 509 | 4720 | 337 | 0.043 |
| Dpep1 | dipeptidase 1 | 714 | 83 | 1373 | 73 | 0.014 |
| Ela1 | elastase 1 | 251 | 53 | 2398 | 137 | 0.014 |
| Ephx2 | epoxide hydrolase 2, cytoplasmic | 247 | 98 | 1629 | 152 | 0.014 |
| Gsto1 | glutathione S-transferase omega 1 | 5236 | 624 | 7526 | 655 | 0.014 |
| Gstt2 | glutathione S-transferase, theta 2 | 530 | 18 | 783 | 62 | 0.014 |
| Hmox2 | heme oxygenase-2 | 798 | 48 | 885 | 49 | 0.157 |
| Homer2 | homer, neuronal immediate early gene, 2 | 197 | 40 | 276 | 42 | 0.086 |
| Lgals1 | lectin, galactose binding, soluble 1 | 412 | 37 | 652 | 62 | 0.014 |
| Mat2a | methionine adenosyltransferase II, alpha | 1505 | 248 | 1971 | 370 | 0.043 |
| Mep1b | meprin 1 beta | 1630 | 193 | 3005 | 385 | 0.014 |
| Mgll | monoglyceride lipase 1 | 2393 | 181 | 2355 | 82 | 1 |
| Ptprj | protein tyrosine phosphatase, type J | 71 | 47 | 543 | 20 | 0.014 |
| RoDHII | retinol dehydrogenase type II (RODH II) | 1309 | 291 | 476 | 102 | 0.014 |
| Rpl30 | ribosomal protein L30 | 529 | 81 | 823 | 90 | 0.014 |
| Sa | SA gene | 1624 | 82 | 242 | 31 | 0.014 |
| Slc17a1 | solute carrier family 17A1 | 1532 | 112 | 2382 | 75 | 0.014 |
| Slipr | scaffolding protein SLIPR | 493 | 32 | 445 | 31 | 0.014 |
| Sod1 | superoxide dismutase 1 | 12939 | 1065 | 12506 | 618 | 0.586 |
| Sparc | secreted acidic cysteine rich glycoprotein | 6201 | 248 | 4378 | 318 | 0.014 |
| Timm17a | translocator of inner mitochond membr 17a | 1169 | 54 | 1255 | 88 | 0.086 |
| Ugt1a6 | UDP glycosyltransferase 1, A6 | 2166 | 350 | 5126 | 5151 | 0.014 |
| AA799440 | EST | 1002 | 122 | 1017 | 85 | 0.786 |
| AA799567 | EST | 148 | 25 | 245 | 24 | 0.014 |
| AA800735 | Similar to supervillin | 423 | 27 | 434 | 11 | 0.786 |
| AA866432 | EST | 363 | 16 | 515 | 41 | 0.014 |
| AA892189 | EST | 81 | 47 | 1136 | 50 | 0.014 |
| AA892388 | Similar to death-associated kinase 2, dapk-2 | 49 | 40 | 467 | 94 | 0.014 |
| AA892762 | EST, Pleckstrin domain containing, H1 | 566 | 93 | 106 | 17 | 0.014 |
| AA892986 | EST | 656 | 62 | 1566 | 54 | 0.014 |
| AA893147 | EST | 716 | 12 | 507 | 35 | 0.014 |
| AA893984 | Similar to p53 inducible protein | 670 | 76 | 937 | 112 | 0.014 |
| AI638939 | Similar to transcription factor BBX | 384 | 54 | 406 | 36 | 0.586 |
| AI638974 | EST, FMS-like tyrosine kinase 1, Flt1 | 289 | 32 | 242 | 11 | 0.014 |
We screened all genes in Table 2 by dHPLC for evidence of sequence variation between SHR-A3 and WKY. Among the 36 genes and EST's surveyed, 21 have been found to be polymorphic between SHR-A3 and WKY. Genotyping assays were developed and used to determine which of these 21 genes share the same allele in all SHR lines (SHR-A3, -B2, -C and SHR/N), but contrast with two WKY lines (WKY-Heid and WKY/N). We found that 11 genes showed this consistent distribution of alleles. These genes identify chromosomal regions that have been inherited IBD by all SHR lines from the two animals that were founders of the SHR lines 2. Normotensive WKY lines have inherited contrasting DNA sequences in these chromosomal regions. Genes contributing to hypertension in SHR lie within such regions that are shared IBD by all hypertensive lines, but which are not IBD to SHR in related normotensive lines. Table 3 indicates the identity of these autozygous genes and their chromosomal locations. Expression of these genes across the 4 ages studies and 4 lines examined is provided in Supplementary File 2).
Table 3.
Differentially expressed genes that are polymorphic in SHR and WKY in which all SHR lines (SHR-A3, SHR-B2, SHR-C and SHR/N) share the same allele and contrast with both WKY-Heid and WKY/N. Shaded gene symbols indicate those genes whose differential expression is determined in cis. The p value of the regression analysis relating inheritance of SHR alleles of these genes with level of gene expression in 10 F2 animals is also indicated.
| Gene symbol | Gene | Band | Position | Expression inheritance in cis (p value) |
|---|---|---|---|---|
| Ddt | D-dopachrome tautomerase | 20p12 | chr20:13,592,013-13,594,480 | 0.142 |
| Ela1 | elastase 1 | 7q36 | chr7:139,515,742-139,529,176 | 0.001 |
| Gsto1 | glutathione S-transferase omega 1 | 1q54 | chr1:253,493,290-253,503,274 | 0.140 |
| Gstt2 | glutathione S-transferase, theta 2 | 20p12 | chr20:13,221,934-13,225,575 | 0.010 |
| Mat2a | methionine adenosyltransferase II, alpha | 4q33 | chr4:105,984,423-105,989,953 | 0.892 |
| Ptprj | protein tyrosine phosphatase, type J | 3q24 | chr3:74,693,135-74,831,912 | 0.001 |
| Slc17a1 | solute carrier family 17A1 | 17p11 | chr17:48,343,283-48,351,209 | 0.515 |
| Ugt1a6 | UDP glycosyltransferase 1, A6 | 9q35 | chr9:87,226,279-87,284,238 | 0.122 |
| AA866432 | EST | 8q11 | chr8:11,151,250-11,151,733 | 0.007 |
| AA892189 | EST | 3p13 | chr3:10,972,364-10,972,822 | 0.583 |
| AA892388 | EST derived from death-associated kinase 2 | 8q24 | chr8:70,581,319-70,585,265 | 0.001 |
Genes that are differentially expressed in all SHR lines and that share the same allele in these lines may contribute to the hypertensive trait. However, some genes may have these properties (differential expression, IBD, contrast with WKY alleles) because differential expression is due to trans-acting mechanisms arising from other genomic loci. We have assessed whether gene expression differences between SHR and WKY lines arise in cis or in trans. We measured the level of gene expression in the freely segregating F2 progeny of an SHR-A3 × WKY cross to examine the relationship between the number of SHR alleles of a gene that are inherited in F2 individuals and the level of gene expression in those individuals. This test was performed with kidney RNA from a group of 10 F2 animals evaluated with the E230A array and using regression analysis to assess the relationship between SHR alleles inherited and level of gene expression. Evidence of cis-mediated effects on expression was obtained for 5 of the 11 genes in which all SHR lines share the same allele (Table 3, Supplementary File 3). The concordance of these 5 genes with known rat QTL's was investigated using data summarized at the Rat Genome Database (http://rgd.mcw.edu). Of the 5 genes identified, 4 corresponded to rat blood pressure QTL's that had been identified in multiple crosses involving several rat models with divergent blood pressures, suggesting that these 4 genes lie within regions that affect blood pressure in several distinct rat strains, including SHR (see Supplementary File 4).
We used microsatellite data from the Allele Characterization Project (ACP) of the Rat Genome Project to estimate the genetic relationship between SHR and WKY. We calculated that 19% of the genomes of the 4 SHR lines are expected to be shared IBD and to not be shared with WKY (see Supplementary File 5). One target of our study has been the identification of genes possessing alleles common to multiple SHR lines, differing from WKY alleles of these genes and creating allelic expression as a means by which renal phenotypes can arise. We have identified 5 genes (Table 3) that manifest allelic expression in all 4 SHR lines. We sought to further test the robustness of our conclusion that these genes exist as alleles identical in SHR, but dissimilar in WKY. Using microsatellite (simple sequence length polymorphism, SSLP) genotype data from the Allele Characterization Project (ACP) of the Rat Genome Database (http://rgd.mcw.edu), we examined the genotypes of SSLP's in the ACP database adjacent to each of these 5 genes. A finding that SSLP's adjacent to the SNP polymorphisms common to SHR-A3, SHR-B2, SHR-C and SHR/N also possess the same allele in the two SHR lines characterized in ACP, while WKY possesses a different allele, provides further support that these genes lie in genomic regions shared IBD in all SHR lines. Each gene of the 5 genes was found to lie in haplotype blocks of allelic identity among SHR lines across which WKY possesses a different allele (Table 4). Thus, the candidacy of these SHR alleles for involvement in the hypertension trait through their expression phenotype is promoted by being integrated within haplotype blocks common to SHR lines.
Table 4.
Genes that possess SHR-specific alleles that manifest allelic expression are contained within haplotype blocks shared by SHR lines and distinct from WKY lines. This is demonstrated by examining the distribution of microsatellite marker alleles from the Allele Characterization Project of the Rat Genome Project. The table indicates the microsatellite allele sizes in each locus surrounding the 5 genes (outlined by boxing) that we have identified as possessing SHR allele-specific expression. In each case, the allelic expression genes are outlined in a block (shaded) in which both microsatellite alleles and alleles of the genes identified in this study share the same pattern of distribution between SHR and WKY. Each block is accompanied by the contiguous three markers up and downstream of the block (unshaded) and is defined by a shift in the immediately adjacent marker pattern so that the pattern of allele sharing among SHR, but not by WKY, is broken.
| RGD NAME | Chromosome | Position | SHRSP/Riv | SHR/OlaHsd | WKY/OlaHsd |
|---|---|---|---|---|---|
| D3Rat50 | 3 | 62,184,492 | 203 | 203 | 209 |
| D3Rat191 | 3 | 62,454,399 | 168 | 168 | 170 |
| D3Rat131 | 3 | 65,405,012 | 211 | 211 | 211 |
| D3Rat51 | 3 | 66,171,893 | 172 | 172 | 176 |
| D3Rat234 | 3 | 68,184,506 | 168 | 168 | 166 |
| D3Rat277 | 3 | 68,713,283 | 256 | 256 | 250 |
| Ptprj | 3 | 74,693,135 | S | S | W |
| D3Rat49 | 3 | 74,807,506 | 144 | 144 | 146 |
| D3Rat48 | 3 | 76,428,105 | 156 | 156 | 158 |
| D3Rat82 | 3 | 76,517,091 | 177 | 177 | 175 |
| D3Rat98 | 3 | 76,765,437 | 126 | 126 | 126 |
| D3Rat47 | 3 | 76,914,407 | 221 | 221 | 227 |
| D3Rat80 | 3 | 77,307,735 | 156 | 156 | 144 |
| D7Rat117 | 7 | 136,702,354 | 130 | 130 | 106 |
| D7Rat3 | 7 | 137,480,818 | 129 | 129 | 127 |
| D7Rat2 | 7 | 137,833,770 | 264 | 268 | 266 |
| D7Mit9 | 7 | 137,915,237 | 274 | 274 | 278 |
| D7Rat116 | 7 | 139,122,462 | 150 | 150 | 162 |
| Ela1 | 7 | 139,515,742 | S | S | W |
| D7Rat101 | 7 | 140,922,838 | 137 | 137 | 140 |
| D7Rat93 | 7 | 140,980,442 | 120 | 120 | 116 |
| D7Rat105 | 7 | 141,253,100 | 152 | 152 | 154 |
| D7Rat114 | 7 | 141,296,882 | 208 | 208 | 204 |
| D7Rat80 | 7 | 141,377,964 | 224 | 224 | 224 |
| D7Mit20 | 7 | 141,447,270 | 118 | 118 | 118 |
| D7Rat1 | 7 | 142,132,345 | 212 | 212 | 216 |
| D8Rat57 | 8 | 9,421,671 | 170 | 170 | 170 |
| D8Mit9 | 8 | 9,581,030 | 157 | 157 | 157 |
| D8Mit6 | 8 | 9,581,132 | 243 | 243 | 243 |
| AA866432 | 8 | 11,151,250 | S | S | W |
| D8Rat170 | 8 | 12,964,557 | 189 | 189 | 200 |
| D8Rat110 | 8 | 13,288,779 | 204 | 204 | 198 |
| D8Rat105 | 8 | 19,782,791 | 129 | 129 | 137 |
| D8Rat53 | 8 | 19,815,642 | 150 | 150 | 158 |
| D8Rat165 | 8 | 20,717,106 | 192 | 192 | 222 |
| D8Rat52 | 8 | 20,962,778 | 221 | 221 | 213 |
| D8Rat190 | 8 | 28,124,139 | 124 | 124 | 126 |
| D8Rat51 | 8 | 29,565,712 | 152 | 152 | 163 |
| D8Rat50 | 8 | 30,725,320 | 168 | 168 | 168 |
| D8Rat162 | 8 | 30,887,344 | 246 | 246 | 252 |
| D8Rat163 | 8 | 31,517,290 | 183 | 183 | 183 |
| D8Rat28 | 8 | 67,261,781 | 152 | 152 | 152 |
| D8Rat144 | 8 | 68,275,463 | 203 | 203 | 203 |
| D8Rat34 | 8 | 68,808,874 | 156 | 156 | 156 |
| D5Rat179 | 8 | 69,243,864 | 264 | 264 | 236 |
| D8Rat147 | 8 | 69,433,881 | 180 | 180 | 170 |
| D8Rat62 | 8 | 70,028,573 | 148 | 148 | 138 |
| D8Rat93 | 8 | 70,039,735 | 124 | 124 | 128 |
| AA892388 | 8 | 70,581,319 | S | S | W |
| D8Mgh5 | 8 | 71,363,751 | 128 | 128 | 130 |
| D8Rat101 | 8 | 71,842,326 | 240 | 240 | 246 |
| D8Arb15 | 8 | 71,862,682 | 147 | 147 | 133 |
| D8Rat79 | 8 | 72,444,991 | 123 | 123 | 135 |
| D8Rat206 | 8 | 72,544,435 | 231 | 231 | 233 |
| D8Rat84 | 8 | 72,621,519 | 162 | 162 | 154 |
| D8Mgh17 | 8 | 73,121,059 | 126 | 126 | 126 |
| D8Rat146 | 8 | 73,124,457 | 139 | 139 | 149 |
| D8Rat140 | 8 | 74,223,239 | 167 | 167 | 157 |
| D20Rat49 | 20 | 8,286,760 | 128 | 128 | 130 |
| D20Mgh5 | 20 | 9,302,201 | 120 | 120 | 118 |
| D20Rat31 | 20 | 10,410,231 | 227 | 219 | 227 |
| D20Rat59 | 20 | 11,035,835 | 104 | 104 | 90 |
| D20Rat4 | 20 | 12,141,648 | 167 | 167 | 171 |
| Gstt2 | 20 | 13,221,934 | S | S | W |
| D20Rat60 | 20 | 14,612,602 | 200 | 159 | 159 |
| D20Mit5 | 20 | 18,259,570 | 250 | 250 | 250 |
| D20Rat5 | 20 | 18,425,634 | 130 | 130 | 130 |
This IBD haplotype approach can now be further supported by the use of recently obtained high density SNP data available via Ensembl for a broad range of rat strains including several SHR and WKY lines. We have used this SNP data to increase the number of SHR and WKY lines in which IBD can be assessed across the 5 genes of interest. The resolution of these blocks is approximately 10 fold higher overall as a result of the increased marker density available using SNP genotypes compared to microsatellites. Figure 1 indicates the distribution of SNP alleles in a 3M base region around each of the 5 genes. Here again in each case there was strong evidence of haplotype block-sharing among all SHR lines and contrasting haplotypes in WKY lines.
Figure 1.
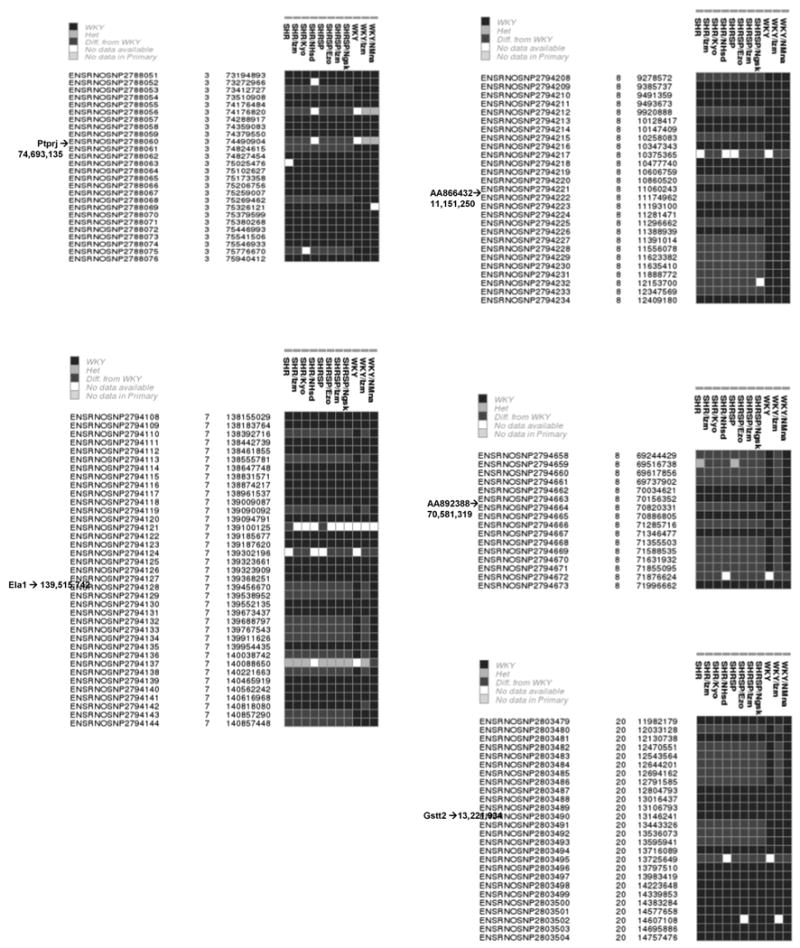
SNP haplotype blocks in SHR and WKY lines around genes showing allelic expression shared by SHR lines. The haplotype is the linear sequence of SNP's that is read as a vertical column for each line. WKY is used as the reference strain with its SNP genotype indicated as a black box. Contrasting SNP genotypes are indicated in gray. Occasional heterozygous alleles are observed (light gray) and occasional SNP genotypes are missing (white). The Ensembl database SNP ID's are indicated in the leftmost column, followed by the chromosome and base position in the rat 3.4 genome assembly.
Discussion
The SHR model, like other inbred rodent strains, offers an important opportunity for trait gene identification that arises from the multiple lines that were created during the development of the model. The genealogy of these lines is well recorded 2, 14 and lines have remained separated until present. The fact that all SHR lines experience hypertension due to a shared set of gene variants has been tested and supported by the creation of crosses among SHR lines. It has been reported that blood pressure does not segregate among the F2 progeny of such crosses 9-11, and this conclusion is generally supported by the blood pressure telemetry measurements made in the novel cross reported in the present study. This evidence supports the expectation from genealogy 2 that a common set of gene variants creates hypertension across all SHR lines.
Use of comprehensive gene expression analysis as a tool to refine mapped hypertension loci has been reported 15-20. The present approach combines a genetic with a genome-wide expression approach across multiple SHR lines and investigates heritability of gene expression in association with the hypertension trait. We have identified 5 genes that are consistently differentially expressed between SHR lines and WKY, that exist as allelic variants with one form common to 4 SHR lines and another to 2 WKY lines, in which the expression effect associated with the gene is inherited from the locus of the gene affected. The result is identification of a compact set of genes containing allelic variation affecting the expression of the genes that are IBD in multiple SHR lines and that include potential hypertension candidate genes.
There are three main explanations why a gene harboring allelic expression could be present in one allelic form in multiple SHR lines while the alternate allele is present in WKY. The first is that random assortment of alleles has produced this pattern by chance. The second is that the SHR allele of the gene contributes to hypertension and was subject to selection during breeding to fix the hypertension trait. The third is that the allele demonstrating allelic expression has been retained by SHR lines because it is in linkage disequilibrium with one or more nearby alleles that have been subject to selection because they influence the trait. Further work will be required to determine whether the genes identified in the present study are hypertension genes or whether they contribute to other phenotypic differences shared by spontaneously hypertensive rats.
The Sa gene illustrates one of the strengths of our design. The Sa gene has been very thoroughly studied after it was initially identified and shown to be highly differentially expressed using differential hybridization in SHR kidney 21. Our analysis finds that 3 out of 4 of SHR lines examined possess the high expressing allele originally identified in SHR. In addition to its differential expression, the Sa gene is located in a well substantiated SHR blood pressure locus 22-26, is expressed predominantly in the kidney, is polymorphic between SHR and WKY 27, 28 and there is evidence from human studies suggesting involvement of Sa in blood pressure determination 29-31. Recent rat congenic studies have not found support for the involvement of Sa in blood pressure regulation, but rather suggest that one or more genes in an adjacent locus is responsible for elevation of blood pressure 32, 33. The criteria arising from the rationale of our studies require that all SHR lines share the same allele in SHR for a gene to be considered further as a hypertension candidate. Sa gene fails this test using the approach we have applied.
The assignment of the remaining genes that have been identified in the present study to the three categories outlined above is less certain. However, because the product of our analysis is specific genes (rather than extensive chromosomal loci containing many genes) that are shown here to contain functional polymorphism, the path forward from these studies can be much more narrowly focused than follow-up studies of trait mapping. Such follow-up studies are made more compelling because of the functional attributes of many of the genes we have identified that indicate that they are potential hypertension genes. We have discussed the potential functional implications of the genes we have identified in the pathogenetic mechanisms of hypertension in SHR. This discussion is included as supplementary material (Supplementary File 6).
The use of recombinant inbred rat strains derived from a cross between SHR and Brown Norway rats to perform genome-wide mapping of the genetic control of gene expression has recently been reported 15. This study identified 7 genes for which both regulation of expression in cis was identified and for which gene sequence variation in SHR was identified. When the allelic distribution of these genes was compared across SHR and WKY lines, only one gene, Pik3c3, was identified as possessing SHR-specific alleles. We have confirmed that all SHR lines in our study share the same Pik3c3 allele and differ from both the WKY strains. However, when comparing gene expression across multiple time points and SHR lines, consistently different expression was not observed. Further, we found no evidence of allelic expression of Pik3c3 in the F2 cross between SHR-A3 and WKY-Heid (data not shown).
The utility of SHR as a model to uncover genes of relevance to human cardiovascular disease is well illustrated by other studies performed with this model. Among SHR lines, we have shown that the Ephx2 gene exists as two distinct alleles with profound expression phenotypes 4. The function of Ephx2 in metabolism of eicosanoids 34 involved in vascular inflammation 35, 36 and distribution of these contrasting expression alleles among SHR lines suggested that Ephx2 variation might contribute to susceptibility to vascular injury in the SHR-A3 line. Subsequently we have investigated the association between human polymorphism of Ephx2 and the haplotypes these polymorphisms create and have uncovered important modification of risk for atherosclerosis and ischemic stroke associated with Ephx2 alleles in humans 37-39. This precedent underscores the value of elucidating the role of the genes identified in the present study in the causation of hypertension in both SHR and in humans.
Our approach to hypertension gene mapping that combines identification of allelic expression with IBD in multiple SHR lines is new and relies on technical resources that are continuing to evolve (rat genome sequence, gene array content). The approach faces limitations that arise from: the fact the genes involved in hypertension may have their disease-causing actions as a result of coding, not regulatory sequence differences; the possibility that genes involved and functioning as hypertension genes through effects on expression are not represented on the array; the possibility that allelic variation exists, but is not discovered by the polymorphism screening approach used; as well as other possible confounding effects. However, it draws support from emerging evidence of the important role played by allelic expression that result in phenotypic diversity, including disease susceptibility and including susceptibility to hypertension in SHR 40-44. Thus, the present study illustrates clearly a potential path by which heritable effects on gene expression can be identified, resolved at the level of sequence diversity in the differentially expressed gene and tested for association with blood pressure. An important element present in this approach which is lacking in purely positional mapping approaches is that it yields outputs in the form of specific genes, rather than broad chromosomal regions containing large numbers of genes. This provides an important opportunity to specifically test the hypothesis of involvement of any gene by reverse genetic approaches (eg. transgenic rats expressing the alternative allele) or by pharmacological approaches designed to alter expression of a target gene or change the activity of its protein product.
Supplementary Material
Acknowledgments
Funding Sources. This work was supported by grants from NIH: to PAD (DDK45538, DDK74680); to EB (HL51021) to MF (NS41466 and HL69126).
Footnotes
Clinical impact and perspective. Blood pressure is influenced by both environmental and heritable factors. Identification of genes carrying susceptibility alleles for hypertension in human populations has been a difficult challenge, probably because of the interaction of multiple susceptibility genes within both individuals and populations. Animal models that share the polygenic nature of human hypertension offer advantages for hypertension gene identification studies. However, mapping studies in rodent models of hypertension have lacked resolution and as a result the genomic regions linked to hypertension are large and contain many genes. We have combined mapping for both hypertension and related gene expression traits to identify allelic variation in the spontaneously hypertensive rat (SHR) that regulates gene expression across multiple SHR lines, but not in normotensive controls. This was accomplished by examining genes expressed in the kidney to identify those that are differentially expressed in hypertensive rats before, during and after the elevation of blood pressure in SHR. We then identified which of these genes contain allelic variation and which among such genes show expression levels linked to this variation. These genes may be relevant to the pathogenesis of hypertension or other traits in SHR, and potentially also in humans.
Disclosures: NONE
References
- 1.Greenhouse DD, Festing MFW, Hasan S, Cohen AL. Genetic Monitoring of Inbred Strains of Rats. Stuttgart: Gustav Fischer; 1990. [Google Scholar]
- 2.Okamoto K, Yamori Y, Nagaoka A. Establishment of the stroke-prone spontaneously hypertensive rat. Circ Res. 1974;34/35:I-143–I-153. [Google Scholar]
- 3.Hinojos CA, Boerwinkle E, Fornage M, Doris PA. Combined genealogical, mapping, and expression approaches to identify spontaneously hypertensive rat hypertension candidate genes. Hypertension. 2005;45:698–704. doi: 10.1161/01.HYP.0000156498.78896.37. [DOI] [PubMed] [Google Scholar]
- 4.Fornage M, Hinojos CA, Nurowska BW, Boerwinkle E, Hammock BD, Morisseau CH, Doris PA. Polymorphism in soluble epoxide hydrolase and blood pressure in spontaneously hypertensive rats. Hypertension. 2002;40:485–490. doi: 10.1161/01.hyp.0000032278.75806.68. [DOI] [PubMed] [Google Scholar]
- 5.Fornage M, Swank MW, Boerwinkle E, Doris PA. Gene expression profiling and functional proteomic analysis reveal perturbed kinase-mediated signaling in genetic stroke susceptibility. Physiological genomics. 2003;15:75–83. doi: 10.1152/physiolgenomics.00020.2003. [DOI] [PubMed] [Google Scholar]
- 6.Bray MS, Boerwinkle E, Doris PA. High-throughput multiplex SNP genotyping with MALDI-TOF mass spectrometry: practice, problems and promise. Hum Mutat. 2001;17:296–304. doi: 10.1002/humu.27. [DOI] [PubMed] [Google Scholar]
- 7.Bray MS, Doris PA. Genotyping by mass spectrometry. Genet Eng (N Y) 2003;25:1–14. doi: 10.1007/978-1-4615-0073-5_1. [DOI] [PubMed] [Google Scholar]
- 8.Twigger SN, Pasko D, Nie J, Shimoyama M, Bromberg S, Campbell D, Chen J, dela Cruz N, Fan C, Foote C, Harris G, Hickmann B, Ji Y, Jin W, Li D, Mathis J, Nenasheva N, Nigam R, Petri V, Reilly D, Ruotti V, Schauberger E, Seiler K, Slyper R, Smith J, Wang W, Wu W, Zhao L, Zuniga-Meyer A, Tonellato PJ, Kwitek AE, Jacob HJ. Tools and strategies for physiological genomics: the Rat Genome Database. Physiological genomics. 2005;23:246–256. doi: 10.1152/physiolgenomics.00040.2005. [DOI] [PMC free article] [PubMed] [Google Scholar]
- 9.Gigante B, Rubattu S, Stanzione R, Lombardi A, Baldi A, Baldi F, Volpe M. Contribution of genetic factors to renal lesions in the stroke-prone spontaneously hypertensive rat. Hypertension. 2003;42:702–706. doi: 10.1161/01.HYP.0000084635.01667.8A. [DOI] [PubMed] [Google Scholar]
- 10.Nagaoka A, Iwatsuka H, Suzuoki Z, Okamoto K. Genetic predisposition to stroke in spontaneously hypertensive rats. Am J Physiol. 1976;230:1354–1359. doi: 10.1152/ajplegacy.1976.230.5.1354. [DOI] [PubMed] [Google Scholar]
- 11.Rubattu S, Volpe M, Kreutz R, Ganten U, Ganten D, Lindpaintner K. Chromosomal mapping of quantitative trait loci contributing to stroke in a rat model of complex human disease. Nature Genet. 1996;13:429–434. doi: 10.1038/ng0896-429. [DOI] [PubMed] [Google Scholar]
- 12.Kurtz TW, Griffin KA, Bidani AK, Davisson RL, Hall JE. Recommendations for blood pressure measurement in humans and experimental animals. Part 2: Blood pressure measurement in experimental animals: a statement for professionals from the subcommittee of professional and public education of the American Heart Association council on high blood pressure research. Hypertension. 2005;45:299–310. doi: 10.1161/01.HYP.0000150857.39919.cb. [DOI] [PubMed] [Google Scholar]
- 13.Grisk O, Kloting I, Exner J, Spiess S, Schmidt R, Junghans D, Lorenz G, Rettig R. Long-term arterial pressure in spontaneously hypertensive rats is set by the kidney. J Hypertens. 2002;20:131–138. doi: 10.1097/00004872-200201000-00019. [DOI] [PubMed] [Google Scholar]
- 14.Louis WJ, Howes LG. Genealogy of the spontaneously hypertensive rat and Wistar-Kyoto rat strains: implications for studies of inherited hypertension. J Cardiovasc Pharmacol. 1990;16 7:S1–5. [PubMed] [Google Scholar]
- 15.Hubner N, Wallace CA, Zimdahl H, Petretto E, Schulz H, Maciver F, Mueller M, Hummel O, Monti J, Zidek V, Musilova A, Kren V, Causton H, Game L, Born G, Schmidt S, Muller A, Cook SA, Kurtz TW, Whittaker J, Pravenec M, Aitman TJ. Integrated transcriptional profiling and linkage analysis for identification of genes underlying disease. Nature genetics. 2005;37:243–253. doi: 10.1038/ng1522. [DOI] [PubMed] [Google Scholar]
- 16.Garrett MR, Meng H, Rapp JP, Joe B. Locating a blood pressure quantitative trait locus within 117 kb on the rat genome: substitution mapping and renal expression analysis. Hypertension. 2005;45:451–459. doi: 10.1161/01.HYP.0000154678.64340.7f. [DOI] [PubMed] [Google Scholar]
- 17.Joe B, Letwin NE, Garrett MR, Dhindaw S, Frank B, Sultana R, Verratti K, Rapp JP, Lee NH. Transcriptional profiling with a blood pressure QTL interval-specific oligonucleotide array. Physiological genomics. 2005;23:318–326. doi: 10.1152/physiolgenomics.00164.2004. [DOI] [PubMed] [Google Scholar]
- 18.McBride MW, Carr FJ, Graham D, Anderson NH, Clark JS, Lee WK, Charchar FJ, Brosnan MJ, Dominiczak AF. Microarray analysis of rat chromosome 2 congenic strains. Hypertension. 2003;41:847–853. doi: 10.1161/01.HYP.0000047103.07205.03. [DOI] [PubMed] [Google Scholar]
- 19.Moujahidine M, Lambert R, Dutil J, Palijan A, Sivo Z, Ariyarajah A, Deng AY. Combining congenic coverage with gene profiling in search of candidates for blood pressure quantitative trait loci in Dahl rats. Hypertens Res. 2004;27:203–212. doi: 10.1291/hypres.27.203. [DOI] [PubMed] [Google Scholar]
- 20.Yagil Y, Yagil C. Insights into pharmacogenomics and its impact upon immunosuppressive therapy. Transpl Immunol. 2002;9:203–209. doi: 10.1016/s0966-3274(02)00022-9. [DOI] [PubMed] [Google Scholar]
- 21.Iwai N, Inagami T. Isolation of preferentially expressed genes in the kidneys of hypertensive rats. Hypertension. 1991;17:161–169. doi: 10.1161/01.hyp.17.2.161. [DOI] [PubMed] [Google Scholar]
- 22.Nabika T, Kobayashi Y, Yamori Y. Congenic rats for hypertension: how useful are they for the hunting of hypertension genes? Clin Exp Pharmacol Physiol. 2000;27:251–256. doi: 10.1046/j.1440-1681.2000.03242.x. [DOI] [PubMed] [Google Scholar]
- 23.Kovacs P, Voigt B, Kloting I. Novel quantitative trait loci for blood pressure and related traits on rat chromosomes 1, 10, and 18. Biochem Biophys Res Commun. 1997;235:343–348. doi: 10.1006/bbrc.1997.6782. [DOI] [PubMed] [Google Scholar]
- 24.St Lezin E, Liu W, Wang JM, Wang N, Kren V, Krenova D, Musilova A, Zdobinska M, Zidek V, Lau D, Pravenec M. Genetic isolation of a chromosome 1 region affecting blood pressure in the spontaneously hypertensive rat. Hypertension. 1997;30:854–859. doi: 10.1161/01.hyp.30.4.854. [DOI] [PubMed] [Google Scholar]
- 25.Frantz S, Clemitson JR, Bihoreau MT, Gauguier D, Samani NJ. Genetic dissection of region around the Sa gene on rat chromosome 1: evidence for multiple loci affecting blood pressure. Hypertension. 2001;38:216–221. doi: 10.1161/01.hyp.38.2.216. [DOI] [PubMed] [Google Scholar]
- 26.Lindpaintner K, Hilbert P, Ganten D, Nadal-Ginard B, Inagami T, Iwai N. Molecular genetics of the Sa-gene: cosegregation with hypertension and mapping to rat chromosome 1. J Hypertens. 1993;11:19–23. doi: 10.1097/00004872-199301000-00004. [DOI] [PubMed] [Google Scholar]
- 27.Frantz SA, Thiara AS, Lodwick D, Samani NJ. A major polymorphism in the rat SA gene caused by the insertion of a LINE element. Mamm Genome. 1996;7:865–866. doi: 10.1007/s003359900256. [DOI] [PubMed] [Google Scholar]
- 28.Kaiser MA, Lodwick D, Samani NJ. The rat SA gene shows genotype-dependent tissue-specific expression. Clin Sci (Lond) 1994;87:1–4. doi: 10.1042/cs0870001. [DOI] [PubMed] [Google Scholar]
- 29.Iwai N, Katsuya T, Mannami T, Higaki J, Ogihara T, Kokame K, Ogata J, Baba S. Association between SAH, an acyl-CoA synthetase gene, and hypertriglyceridemia, obesity, and hypertension. Circulation. 2002;105:41–47. doi: 10.1161/hc0102.101780. [DOI] [PubMed] [Google Scholar]
- 30.Iwai N, Ohmichi N, Hanai K, Nakamura Y, Kinoshita M. Human SA gene locus as a candidate locus for essential hypertension. Hypertension. 1994;23:375–380. doi: 10.1161/01.hyp.23.3.375. [DOI] [PubMed] [Google Scholar]
- 31.Narita I, Saito N, Goto S, Shirasaki A, Morioka Y, Jin S, Omori K, Sakatsume M, Arakawa M, Gejyo F. Role of genetic polymorphism in the SA gene on the blood pressure and prognosis of renal function in patients with immunoglobulin A nephropathy. Hypertens Res. 2002;25:831–836. doi: 10.1291/hypres.25.831. [DOI] [PubMed] [Google Scholar]
- 32.St Lezin E, Liu W, Wang JM, Yang Y, Qi N, Kren V, Zidek V, Kurtz TW, Pravenec M. Genetic analysis of rat chromosome 1 and the Sa gene in spontaneous hypertension. Hypertension. 2000;35:225–230. doi: 10.1161/01.hyp.35.1.225. [DOI] [PubMed] [Google Scholar]
- 33.Hubner N, Lee YA, Lindpaintner K, Ganten D, Kreutz R. Congenic substitution mapping excludes Sa as a candidate gene locus for a blood pressure quantitative trait locus on rat chromosome 1. Hypertension. 1999;34:643–648. doi: 10.1161/01.hyp.34.4.643. [DOI] [PubMed] [Google Scholar]
- 34.Yu Z, Xu F, Huse LM, Morisseau C, Draper AJ, Newman JW, Parker C, Graham L, Engler MM, Hammock BD, Zeldin DC, Kroetz DL. Soluble epoxide hydrolase regulates hydrolysis of vasoactive epoxyeicosatrienoic acids. Circulation research. 2000;87:992–998. doi: 10.1161/01.res.87.11.992. [DOI] [PubMed] [Google Scholar]
- 35.Node K, Huo Y, Ruan X, Yang B, Spiecker M, Ley K, Zeldin DC, Liao JK. Anti-inflammatory properties of cytochrome P450 epoxygenase-derived eicosanoids. Science (New York, N Y. 1999;285:1276–1279. doi: 10.1126/science.285.5431.1276. [DOI] [PMC free article] [PubMed] [Google Scholar]
- 36.Spiecker M, Liao JK. Vascular protective effects of cytochrome p450 epoxygenase-derived eicosanoids. Archives of biochemistry and biophysics. 2005;433:413–420. doi: 10.1016/j.abb.2004.10.009. [DOI] [PubMed] [Google Scholar]
- 37.Fornage M, Boerwinkle E, Doris PA, Jacobs D, Liu K, Wong ND. Polymorphism of the soluble epoxide hydrolase is associated with coronary artery calcification in African-American subjects: The Coronary Artery Risk Development in Young Adults (CARDIA) study. Circulation. 2004;109:335–339. doi: 10.1161/01.CIR.0000109487.46725.02. [DOI] [PubMed] [Google Scholar]
- 38.Fornage M, Lee CR, Doris PA, Bray MS, Heiss G, Zeldin DC, Boerwinkle E. The soluble epoxide hydrolase gene harbors sequence variation associated with susceptibility to and protection from incident ischemic stroke. Human molecular genetics. 2005;14:2829–2837. doi: 10.1093/hmg/ddi315. [DOI] [PMC free article] [PubMed] [Google Scholar]
- 39.Wei Q, Doris PA, Pollizotto MV, Boerwinkle E, Jacobs DR, Jr, Siscovick DS, Fornage M. Sequence variation in the soluble epoxide hydrolase gene and subclinical coronary atherosclerosis: interaction with cigarette smoking. Atherosclerosis. 2007;190:26–34. doi: 10.1016/j.atherosclerosis.2006.02.021. [DOI] [PubMed] [Google Scholar]
- 40.Arking DE, Becker DM, Yanek LR, Fallin D, Judge DP, Moy TF, Becker LC, Dietz HC. KLOTHO allele status and the risk of early-onset occult coronary artery disease. Am J Hum Genet. 2003;72:1154–1161. doi: 10.1086/375035. [DOI] [PMC free article] [PubMed] [Google Scholar]
- 41.Blankenberg S, Godefroy T, Poirier O, Rupprecht HJ, Barbaux S, Bickel C, Nicaud V, Schnabel R, Kee F, Morrison C, Evans A, Lackner KJ, Cambien F, Munzel T, Tiret L. Haplotypes of the caspase-1 gene, plasma caspase-1 levels, and cardiovascular risk. Circulation research. 2006;99:102–108. doi: 10.1161/01.RES.0000232324.87983.4b. [DOI] [PubMed] [Google Scholar]
- 42.Pastinen T, Ge B, Gurd S, Gaudin T, Dore C, Lemire M, Lepage P, Harmsen E, Hudson TJ. Mapping common regulatory variants to human haplotypes. Human molecular genetics. 2005;14:3963–3971. doi: 10.1093/hmg/ddi420. [DOI] [PubMed] [Google Scholar]
- 43.Poon AH, Laprise C, Lemire M, Montpetit A, Sinnett D, Schurr E, Hudson TJ. Association of vitamin D receptor genetic variants with susceptibility to asthma and atopy. Am J Respir Crit Care Med. 2004;170:967–973. doi: 10.1164/rccm.200403-412OC. [DOI] [PubMed] [Google Scholar]
- 44.Pravenec M, Churchill PC, Churchill MC, Viklicky O, Kazdova L, Aitman TJ, Petretto E, Hubner N, Wallace CA, Zimdahl H, Zidek V, Landa V, Dunbar J, Bidani A, Griffin K, Qi N, Maxova M, Kren V, Mlejnek P, Wang J, Kurtz TW. Identification of renal Cd36 as a determinant of blood pressure and risk for hypertension. Nature genetics. 2008 doi: 10.1038/ng.164. [DOI] [PubMed] [Google Scholar]
Associated Data
This section collects any data citations, data availability statements, or supplementary materials included in this article.