

Abstract
Osteoporosis (OP) is a major public health problem, mainly characterized by low bone mineral density (BMD). Circulating monocytes (CMCs) may serve as progenitors of osteoclasts and produce a wide variety of factors important to bone metabolism. However, the specific action mechanism of CMCs in the pathogenesis of OP is far from clear. We performed a comparative protein expression profiling study of CMCs in Chinese premenopausal females with extremely discordant BMD, identified a total of 38 differentially expressed proteins, and confirmed with Western blotting five proteins: ras suppressor protein1 (RSU1), gelsolin (GSN), manganese-containing superoxide dismutase (SOD2), glutathione peroxidase 1(GPX1), and prolyl 4-hydroxylase β subunit (P4HB). These proteins might affect CMCs’ trans-endothelium, differentiation, and/or downstream osteoclast functions, thus contribute to differential osteoclastogenesis and finally lead to BMD variation. The findings promote our understanding of the role of CMCs in BMD determination, and provide an insight into the pathogenesis of human OP.
Keywords: Bone mineral density, Circulating monocyte, Osteoclastogenesis, Protein
1 Introduction
Osteoporosis (OP), mainly characterized by low bone mineral density (BMD) [1], is a major public health problem among females [2]. Genetic factors play an important role in OP, as evidenced by the high heritability (>50%) of BMD [3–5].
Great progress has been made in the field of genetic epidemiology for the identification of genes important for OP. At the DNA level, a list of genes has been found associated with BMD or other phenotypes of OP [6]. At the mRNA expression level, Liu et al. [7] performed an in vivo microarray study of circulating monocytes (CMCs) in Caucasians and suggested a novel pathophysiological mechanism for OP. However, so far, little effort has been made to systemically explore OP in humans at the protein level. Proteins are direct executors and regulators in almost all processes of life. Therefore, profiling study at the protein level will provide insights into the disease that are biologically and clinically relevant.
OP is attributed to imbalanced bone remodeling, in which osteroclastic bone resorption exceeds osteoblastic bone formation [8, 9]. Studying osteoclastogenesis and/or osteoblastogenesis may contribute to the understanding of the pathogenesis of OP. It has been shown that all osteoclasts in peripheral skeleton such as femur [10, 11], and a considerable amount of osteoclasts in the central skeleton such as spine [12] originate from CMCs [13–16]. CMCs can differentiate in vitro into active osteoclasts [17, 18]. In addition, CMCs produce a wide variety of factors involved in bone metabolism, such as interleukin-1, tumor necrosis factor-α, interleukin-6, platelet-derived growth factor, transforming growth factor-α, and 1,25(OH)2D3 [19–22]. Given the importance of CMCs for bone metabolism, functional profiling of CMCs in vivo in humans might provide insights into the pathophysiology of OP.
For healthy women, BMD increases progressively with age from infancy to adulthood [23]. After reaching its peak at the age of ~20–25 [24], BMD remains relatively stable until the age of 45–55 (before menopause in females). Due to a drastic change of physiological status, i.e., menopause, BMD then is subject to large changes in hormonal and environmental factors and decreases rapidly. Upregulation of osteoclast formation has been recognized as the main mechanism of estrogen deficiency induced bone loss [25, 26]. Peak BMD is a determinant of OP later in life. During the stage of peak BMD (i.e., premenopausal period aged 20–45), women’s BMD is in a status of relative balance between bone formation by osteoblasts and bone resorption by osteoclasts. Compared with the periods before (i.e., childhood and adolescence) or after (i.e., perimenopausal stage) this stage, in vivo expression of relevant genes in CMCs, which reflects bone homeostasis at this stage, should be to a much less extent influenced by factors of inner (e.g., hormones) or outside environments (e.g., nutrition), making the effect of the intrinsic genetic factors for bone mass more prominent. Therefore, this peak BMD stage provides us a unique “window” to explore the intrinsic genetic factors responsible for BMD variation among different individuals, which leads to differential susceptibility to OP later in life.
In the present study, using 2-DE coupled with MS, we compared protein expression profiles of CMCs from Chinese premenopausal females with extremely high BMD versus those with extremely low BMD, and identified differentially expressed proteins (DEPs) that might be crucial to osteoclastogenesis in relation to the pathogenesis of OP.
2 Materials and methods
2.1 Subjects
The project was approved by the involved Institutional Review Board. All subjects signed informed-consent documents before entering the project. We recruited a total of 30 unrelated premenopausal Chinese Han females, aged from 20–45 years (with the average age ± SD of 27.3 ± 5.0), i.e., the time when peak bone mass is attained and maintained in Chinese females [24]. Among these subjects, 15 had high BMD (from top 12%, average Z score ± SD: +1.63 ± 0.16) and 15 had low BMD (from bottom 12%, average Z score ± SD: −1.67 ± 0.15) at the hip. These subjects were selected from a base population in our archive composed of up to 1000 unrelated otherwise healthy premenopausal females aged of 20–45. They reside in Changsha city and its vicinity in the Midsouth area of China. Fifty-milliliter blood was drawn from each voluntary consenting subject. Information such as age, ethnicity, menses status, medication history, disease history, and marriage history were obtained via the questionnaire.
Exclusion criteria were used to minimize potential effects of any known nongenetic factors on bone metabolism and BMD determination [27]. Briefly, the exclusion criteria included chronic disorders involving vital organs (heart, lung, liver, kidney, and brain), serious metabolic diseases such as diabetes, hypo- or hyperparathyroidism, hyperthyroidism, other skeletal diseases such as Paget’s disease, osteogenesis imperfecta, rheumatoid arthritis, chronic use of drugs affecting bone metabolism such as corticosteroid therapy, anticonvulsant drugs, estrogens, thyroid hormone, and malnutrition conditions such as chronic diarrhea, chronic ulcerative colitis. For the 30 subjects selected for protein expression analyses, we adopted additional exclusion criteria to minimize effects of any known disorders or conditions that might affect systemic protein expression of CMC [7]. These disorders and conditions included autoimmune or autoimmune-related diseases, immune-deficiency conditions, haemopoietic and lymphoreticular malignancies, and other diseases such as viral infection, etc.
2.2 BMD measurement
BMD (g/cm2) at the hip, including femoral neck, trochanter, and intertrochanter, were measured using the Hologic QDR 4500 W bone densitometer (Hologic, Waltham, MA, USA). The total hip BMD was a combined value at the three measured regions. The densitometer was calibrated daily with the control vertebral phantom, and the CV across repeated scans were 1.21%, 1.80%, 2.33%, and 1.34% for the trochanter, intertrochanter, femoral neck, and total hip, respectively.
2.3 Monocyte extraction and purity
Firstly, we isolated circulating mononuclear cells (MNCs) from 50 mL fresh peripheral blood drawn from each subject using lymphoprep solution (Axis-Shield PoC AS, Oslo, Norway) according to the manufacturer’s recommendation. Then, the monocyte negative isolation kit (Dynal Biotech ASA, Oslo, Norway) was used to isolate CMCs from the MNCs by depletion of T cells, B cells, natural killer cells, erythrocytes and granulocytes, leaving monocytes untouched and free of surface-bound antibody and beads. The purity of the isolated CMCs was monitored by BD-FACScalibur flow cytometry (BD Biosciences, San Jose, CA, USA) with fluorescence labeled antibodies PE-CD14 and FITC-CD45 (Fig. 1), and determined to be as high as 90% in our samples.
Figure 1.
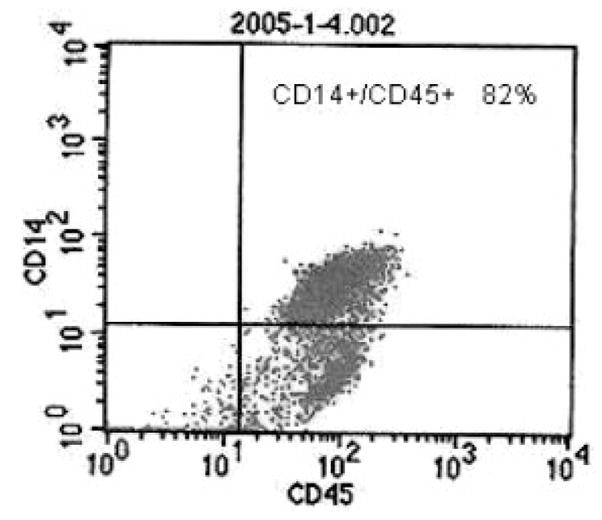
An example of flow cytometry report. CD45 and CD14 are MNCs and CMCs specific membrane marker, respectively.
2.4 Protein extraction
CMCs (~2–5 × 10⁶ per sample) were resuspended for 1 h in lysis buffer containing 8.0 M Urea, 2.0 M thiourea, 4.0%CHAPS, 1.0% NP-40, 0.5% phenmalate 3–10, 65.0 mM DTT, 0.5 mM PMSF, and vibrated every 5 min. Lysates were centrifuged at 12 000 rpm for 30 min at 4°C. The supernatants stored at −80°C until use for 2-DE. Protein concentration in these samples was estimated by using a commercial Bradford kit (DC reagent kit, Bio-Rad), and BSA as standard. Prior to the separation of proteins by 2-DE, three randomly selected protein samples with 300 μg protein each from the same BMD group (high or low) were equally pooled together. Thus, a total of ten pooled samples (five from high BMD group and five from low BMD group) were subject to protein expression profiling.
2.5 2-DE
The 2-DE was performed with the Amersham Pharmacia system. Three hundred microgram of total protein for each pooled sample was applied to an 18 cm length IPG DryStrip (pH 3–10 L), which was rehydrated for 13 h at 20°C in 8.0 M Urea, 2% CHAPS, 0.5% IPG Buffer (pH 3.0–10.0 L), 18 mM DTT, and 0.001% bromphenol blue. The pre-IEF and IEF were performed on IPGphor IEF system (Amersham Pharmacia Biotech). The pre-IEF was performed at 500 V for 1 h and 1000 V for 1 h. Formal IEF was then performed with a linear increase up to 8000 V over 0.5 h, and then held at 8000 V for 5 h. For the second dimension, the IPG strips were equilibrated first for 15 min in a buffer containing 50 mM Tris-HCl, pH 8.8, 30% glycerol, 1.0% SDS, and 6.0 M urea, and 0.2% DTT (Sigma), second for 15 min in a buffer containing 50 mM Tris-HCl, pH 8.8, 30% glycerol, 1% SDS, 6.0 M urea, and 3% iodoacetamide, followed by 10% SDS-PAGE on a Protean Plus Dodeca Cell (Bio-Rad Laboratories, Hercules, CA, USA). Gels were stained with silver nitrate and visualized under ultraviolet light with a Tsinghua Unigroup scanner at an optical resolution of 300 dpi in transmission model (Tsinghua Unigroup, Beijing, China). To check the reproducibility of the data, three independent 2-DE’s were performed on each pooled sample.
2.6 Differential expression analyses
Protein spots were detected based on staining intensity of silver nitrate as determined by the PDQuest software v7.2 (Bio-Rad Laboratories, Hercules). We first set up a primary matchset from the three replicates for each sample. Then, a higher level of matchset was generated from seven mixtures in either high or low BMD group. The differentiated proteins were detected by comparing matchset in low BMD group to that in high BMD group. In order to justify for variability due to silver staining, the intensity of each spot was normalized to the total intensity of all the spots in the gel. The normalized data were exported as expression values for further statistical analyses.
In order to select spots for protein identification, using the normalized data, we performed four types of statistical analyses: t-test, Kruskal–Wallis test, weighted gene analysis (WGA) [28], and significance analysis of microarrays (SAM) [29]. t-Test and Kruskal–Wallis test are two commonly used paramatric and nonparamatric statistical methods, respectively, which test whether the mean values between the two group of samples are equal. The Kruskal–Wallis test is performed on ranked data; it might be relatively less powerful due to the transformation of informative data into rank data, but it does not make assumptions about normality and homoscedasticity. The cutoff significance levels for both the two tests were set to be p<0.05. In WGA, a discriminative weight (w) for each protein can be evaluated by w = dB/(k1dw1 + k2dw2 + α), where dB is the center-to-center distance (between-group Euclidean distance), dwi is the average Euclidean distance among all sample pairs within group i, with a total of t1 and t2 sample pairs within groups 1 and 2, respectively, k1 = t1/(t1 + t2), and k2 = t2/(t1 + t2). α is a small constant to prevent a zero denominator. Proteins may then be ranked based on w. The larger the w, the larger the difference of the protein expression [28]. The significant cutoff point for WGA was set to be w>2.5. SAM was applied to protein expression analysis in this study [29]. The statistic “relative difference” d(i) in protein expression is d(i) = (x̄1(i) − x̄2(i))/(s(i) + s0), where x̄1(i) and x̄2(i) are the average expression levels for protein (i) in the high BMD group versus the low BMD group, respectively. The protein-specific scatter s(i) is the SD of repeated expression measurements:
where Σm and Σn are sums of the expression measurements in two groups, respectively, a = (1/n1 + 1/n2)/(n1 + n2 − 2), n1 and n2 are the numbers of measurements in two groups, respectively. s0 is to ensure that the variance in d(i) is independent of protein expression. The value for s0 will be chosen to minimize the CV. The larger the d(i), the larger the differnce of the protein expression. The significant cutoff point for SAM was set to be d(i) = 1.0. To minimize missing improtant proteins, all spots that meet at least one of the above criteria for statistical significance were analyzed by MS.
2.7 Protein identification
The interesting protein spots, based on our statistical analyses, were excised from the gels and digested with trypsin. Briefly, each spot was destained in 15.0 mM K3Fe(CN)6 and 50.0 mM Na2S2O3, dehydrated in 50% and 100% ACN, and then marinated in 25 mM NH4HCO3 and redehydrated and dried. Then the protein in the dried gel piece was reduced (in 25 mM NH4HCO3 and 10 mM DTT), alkylated (in 25 mM NH4HCO3 and 55 mM IAA), and then digested overnight at 37°C with trypsin (0.02 g/L) in 25 mM NH4HCO3 containing 10% ACN.
The digested peptides were extracted and spotted onto MALDI plate. MALDI peptide fingerprint mass spectra and peptide sequencing spectra were acquired with a MALDI-TOF/TOF Ultraflex mass spectrometer equipped with a reflector and controlled by the FlexControl 2.2 software package (Bruker Daltonics, Bremen, Germany), using cyano-4-hydroxycinnamic acid (Sigma) as the matrix. In MALDI-TOF MS reflector mode, ions generated by a pulsed UV laser beam (nitrogen laser, λ = 337 nm, 50 Hz) were accelerated to a kinetic energy of 25 kV. Metastable ions generated by laser-induced decomposition of the selected precursor ions were analyzed with Ar as collision gas. In MALDI-LIFT-TOF/TOF mode, precursor ions were accelerated to 8 kV and selected in a timed ion gate. The fragments were further accelerated by19 kV in the LIFT cell (LIFT, “lifting” the potential energy for the second acceleration of ion source), and their masses were analyzed after the ion reflector passage.
We used the SNAP algorithm to detect the monoisotopic masses of the measured peptides and create the peak list. Masses were automatically annotated by using the Flex-Analysis 2.2 software package. All MALDI-MS spectra were internally calibrated using trypsin autolysis fragments ([MH + 1] ions of 842.5099 and 2211.1046). The MS data from both MALDI-MS peptide fingerprint mass spectra and tandem mass spectra in the MS/MS experiments were searched against a subset of homo sapiens proteins in the NCBInr protein sequence database (version 2/23/2005), using the Mascot v2.1 search program (Matrix Science, London, UK) (www.matrixscience.com). Search parameters are as follows: trypsin digest (one missed cleavage allowed), charge = 1+, MS tolerance: 50 ppm, MSMS tolerance: 0.9 Da, modifications: global carbamidomethylation (cysteine) and optional oxidation (methionine). Positive protein identification was based on standard MASCOT criteria for statistical analysis of the MALDI peptide fingerprint mass spectra and the MALDI-MS/MS data [30]. A −10 log (p) score, where p is the probability that the observed match is a random event, of >64 (for MS data), of >30 (for MS/MS data), was regarded as significant.
2.8 Gene ontology (GO) classification
We utilized the Onto-Express (OE) tool (available at http://vortex.cs.wayne.edu/ontoexpress/) to profile the functions of the identified proteins under the categories of “biological process” and “molecular function” using GO terms (http://www.geneontology.org/).
2.9 Western blotting (WB)
The selection of proteins for WB validation was based on the statistical evidence and functional evidences relevant to bone metabolism especially to osteoclastogenesis. Five proteins were selected for WB verification, which are prolyl 4-hydroxylase β subunit (P4HB), gelsolin (GSN), ras suppressor protein1 (RSU1), manganese-containing superoxide dismutase (SOD2), and glutathione peroxidase 1 (GPX1). Herein, selection of P4HB was based on significant statistical evidences (p<0.05 for both t-test of Kruskal–Wallis test); selection of GSN, RSU1, SOD2, and GPX1 was based on suggestive or tentative statistical evidence (p = 0.086 for GSN, w = 2.884 for RSU1, w = 2.061 for SOD2, w = 1.519 and expression ratio (L:H) = 0.83 for GPX1), and known functional evidences (detailed in Section 4).
The primary antibodies used in this study included chicken anti-human RSU1 pAb (cat. no. ab26225, 1:1000 dilution), mouse anti-human GSN mAb[GS-2C4] (cat. no. ab11081, 1:1000 dilution), rabbit antirat full length protein SOD2 pAb (cat. no. ab13534, 1:2000 dilution), rabbit anti-human GPX1 pAb (cat. no. ab16798, 1:1000 dilution), which are purchased from Abcam (Abcam plc, Cambridge, UK), and mouse antirat P4HB mAb (cat. no. MAB2073, 1:2000 dilution) from Chemicon (Chemicon International, Temecula, CA, USA). Due to unavailability of the anti-human P4HB and anti-human SOD2 primary antibodies, we used anti-rat P4HB and SOD2 antibodies instead because of the highly conserved amino acid sequences of P4HB and SOD2 in both rat and human (percent sequence similarity: 96 and 92%, respectively). GAPDH was used as internal control. WB images were obtained through film X-ray exposure developed by using LumiGLO chemiluminescent substrates (KPL, 2 Cessna Court, Gaithersburg, MD, USA). The target protein bands in images were analyzed and quantified using QuantityOne software (Bio-Rad Laboratories, Hercules). Independent sample t-test was used to compare the expression level of the target proteins between the two groups of samples.
3 Results
3.1 Identified proteins differentially expressed between high and low BMD samples
For the ten pooled biological samples (five random pairs of 2-DE samples), we have performed a total of 30 2-DE experiments. Supporting Information 1 showed the replicate 2-DE gels for ten pooled samples. We detected an average of 526 spots per gel. No presence/absence proteins in high versus low BMD groups were detected. A total of 210 spots matched and quantified in more than eight out of the ten pooled samples were compared in the two groups of samples (Supporting Information 2). Statistical analyses showed that 67 protein spots are of significant or marginally significant differential expression. Besides these differential spots, we analyzed additional spots by MS, with an attempt to identify more potentially function-related proteins though their differential expression did not reach statistical significance level. Totally, we successfully identified 74 spots (corresponding to 58 proteins) with significant Mowse scores, including 46 differentially expressed spots which corresponded to 38 DEPs (Supplorting Information 3). Listed in Table 1 is the mass identification information for the 38 DEPs. Figure 2 showed representatively the mass spectra of a protein spot (ssp6406, GSN). These DEPs are novel or known relevant to bone metabolism. The majority of these identified proteins were upregulated in high BMD group.
Table 1.
Information of the 38 DEPs identified by MS or MS/MS
| SSP | L:Ha | Protein symbol | Protein full name | gi | Matched peptides | Sequence coverage (%) |
|---|---|---|---|---|---|---|
| 5719 | 0.71 | GPD2 | Glycerol-3-phosphate dehydrogenase | 4504085 | 14 | 24 |
| 610 | 0.52 | P4HB | Prolyl 4-hydroxylase, β subunit precursor | 20070125 | 12 | 39 |
| 5726b | 0.73 | WDR1 | WD repeat domain 1 | 12652891 | 14 | 28 |
| 3105b | 0.78 | PGLS | 6-Phosphogluconolactonase | 6912586 | 6 | 26 |
| 102 | 0.77 | PSMA5 | Proteasome (prosome, macropain) subunit, α type, 5 | 7106387 | 7 | 39 |
| 5716 | 0.63 | ATIC | 5-Aminoimidazole-4-carboxamide ribonucleotide formyltransferase/IMP cyclohydrolase | 20127454 | 14 | 27 |
| 5627 | 0.70 | OXCT1 | OXCT | 48146215 | 8 | 28 |
| 6406b | 1.54 | GSN | GSN isoform b | 38044288 | 18 | 24 |
| 5207 | 0.79 | PNP | Purine nucleoside phosphorylase | 108935929 | 18 | 58 |
| 8102b | 0.61 | TLN1 | talin 1 | 16753233 | 4 | 2 |
| 4613 | 0.75 | CCT2 | Chaperonin containing TCP1, subunit 2 | 5453603 | 9 | 25 |
| 201 | 0.63 | TPM4 | Tropomyosin 4 | 4507651 | 11 | 61 |
| 2303 | 0.81 | TUBA1B | TUBA1B protein | 18204869 | 6 | 28 |
| 9313b | 0.73 | GAPDH | Glyceraldehyde-3-phosphate dehydrogenase | 31645 | 14 | 35 |
| 4408 | 0.72 | ENO1 | Enolase 1 | 4503571 | 7 | 21 |
| 5405 | 0.72 | Unknown | Actin-related protein | 381964 | 7 | 23 |
| 4009 | 0.68 | RAB7B | RAB7B protein | 16877705 | 5 | 45 |
| 7203 | 0.74 | MGLL | Monoglyceride lipase isoform 2 | 51242953 | 12 | 55 |
| 2208 | 0.65 | ACTG1 | γ-actin | 178045 | 4 | 28 |
| 1303 | 0.76 | U2AF1 | U2 small nuclear RNA auxiliary factor 1 | 31455228 | 6 | 42 |
| 4007 | 0.85 | PARK7 | DJ-1 protein | 31543380 | 11 | 50 |
| 7003 | 0.83 | PSMA2 | PSMA2 protein | 39644890 | 7 | 31 |
| 4010 | 0.80 | PRDX3 | Peroxiredoxin 3 isoform b | 32483377 | 6 | 17 |
| 1001 | 0.68 | Unknown | T669 kinase | 1362991 | 14 | 28 |
| 6104b | 0.82 | TPI1 | Chain B, triosephosphate isomerase (Tim) (E.C.5.3.1.1) complexed with 2-phosphoglycolic acid | 999893 | 9 | 41 |
| 3705b | 0.80 | VCL | Vinculin | 24657579 | 8 | 8 |
| 106 | 0.70 | PLEK | Pleckstrin | 4505879 | 5 | 15 |
| 8404 | 0.79 | Unknown | Chain, aldolase A | 229674 | 10 | 42 |
| 7213 | 0.79 | FGA | Fibrinogen α chain preproprotein, isoform α-E | 13591824 | 7 | 7 |
| 2304 | 0.79 | TUBA6 | Tubulin α 6 | 14389309 | 7 | 24 |
| 8505 | 1.12 | FGB | Fibrin β | 223002 | 15 | 51 |
| 5401 | 0.74 | PKM2 | Pyruvate kinase, muscle | 31416989 | 6 | 19 |
| 7105b | 1.32 | RSU1 | RSU1 protein | 14250499 | 13 | 65 |
| 7115 | 0.85 | CA2 | Chain, carbonic anhydrase Ii (E.C.4.2.1.1) mutant with Pro 202 replaced by Ala (P202a) | 443135 | 11 | 51 |
| 9405 | 1.05 | IDH2 | Isocitrate dehydrogenase 2 (NADP+), mitochondrial precursor | 28178832 | 9 | 23 |
| 6203b | 0.91 | CAP1 | Adenyly 1 cyclase-associated protein | 5453595 | 6 | 22 |
| 8301 | 1.08 | ANXA2 | Annexin A2 | 18645167 | 7 | 28 |
| 7006 | 1.06 | SOD2 | SOD2 | 30841309 | 6 | 27 |
| 3002c | 0.83 | GPX1 | Glutathione peroxidase | 14717805 | 1 | 61 |
All the proteins were identified with a MALDI-TOF/TOF Ultraflex mass spectrometer, and the quality of match was evaluated at the significance level (p<0.05) for peptide fingerprint mass spectra and/or peptide sequencing spectra; SSP: the spot identity on the 2-DE gel designated by the PDQuest; gi: the accession number of proteins in NCBI protein database.
The ratio of mean normalized values for the corresponding protein spot in low BMD group to high BMD group.
The spot with the highest MASCOT score and/or with most significant differential expression among multiple spots of the same protein.
An exceptional protein, for which the differential expression is statistically insignificant; it showed 20% higher expression in high BMD group than in low BMD group (L:H = 0.83).
Figure 2.


Mass spectra for SSP6406 (GSN). A1: peptide fingerprint mass spectra of GSN; A2, A3: tandem mass spectra of precursor ion (m/z) 1275.674 and 1722.804.
Note that a protein with a differentially expressed spot does not necessarily mean that this protein, as a whole, is differentially expressed. For example, multiple spots (including a differentially expressed spot SSP 9313 as shown in Table 1) on 2-DE gels were identified to be the same protein GAPDH, which is a tetramer enzyme. However, quantitative analysis summarizing the data of the multiple spots showed no significant differential expression for the whole protein between the two groups of samples (p = 0.248). Based on the analysis, GAPDH was used as an internal control in WB analysis. We avoided using cytoskeleton proteins such as β-actin or β-tubulin as an internal control in WB, since quite a few nonredundant cytoskeleton proteins (ACTG1, TUBA1B, TUBA6, VCL, TLN1, GSN, WDR1, and TPM4) were found differentially expressed in our samples.
3.2 GO classifications for the DEPs
To infer an overall picture of the potential functions of the identified proteins, we classified the 38 DEPs according to the biological process principle of the GO database (http://www.geneontology.org/) via OE analysis (http://vortex.cs.wayne.edu/ontoexpress/) (Fig. 3A). Most of the proteins are involved in cellular physiological processes and metabolism, with eight proteins involved in the regulation of cellular and physiological processes (CCT2, VCL, GSN, FGB, FGA, PRDX3, SOD2, and ENO1). In addition, many proteins are also related to localization (TUBA1B, TUBA6, VCL, TLN1, P4HB, GPD2, and RAB7B), cell communication (CAP1, PARK7, RAB7B, PLEK, and RSU1), response to external stimulus (WDR1, SOD2, MGLL, FGB, and FGA), morphogenesis (VCL and CAP1), locomotion (VCL and TLN1), cell adhesion (VCL) and skeletal development (ANXA2).
Figure 3.
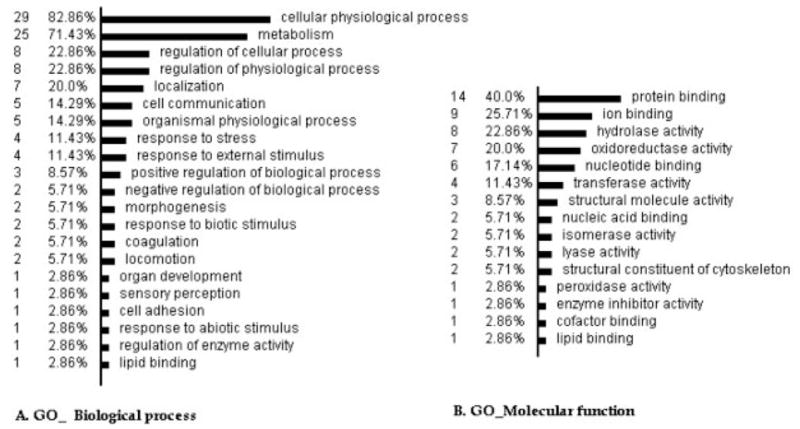
Classifications of the DEPs According to the GO principles. The analysis was performed by the OE, available at http://vortex.cs.wayne.edu/ontoexpress/servlet/UserInfo; only 33 genes with definite gene ID and known functions were categorized in the analyses; the number to the left is the number and percentage of the proteins in each category.
Classification according to the GO molecular function principle showed that 23 proteins possess the function of binding and 20 proteins the function of catalytic activity (Fig. 3B). For example, two proteins bind to nucleic acid (ENO1 and U2AF1), six proteins bind to nucleotides (U2AF1; TUBA6, TUBA1B, RAB7B; ACTG1, and CCT2), nine proteins possess ion binding activity (Ca2+ binding-PLEK, ANXA2, GSN, GPD2; Mn2+ binding-SOD2; Zn2+ binding-U2AF1, CA2; Mg2+ binding-PKM2, ENO1), and 14 proteins have protein binding activity (VCL, TLN1, WDR1, TPM4, GSN, CAP1, ANXA2, PRDX3, PARK7, CCT2, FGA, ACTG1, U2AF1, and PKM2). Additionally, five proteins have structural molecule activity (TLN1, ACTG1, TUBA1B, VCL, and TUBA6), seven proteins possess oxidoreductase activity (GPD2, IDH2, PRDX3, P4HB, SOD2, GAPDH, and VCL) and one protein possesses enzyme inhibitor activity (ANXA2).
3.3 Significant proteins validated by WB
The major known functions of the five proteins (P4HB, RSU1, GSN, SOD2, and GPX1), suggested by previous evidences (detailed in Section 4), were listed in Table 2. The MS and/or MS/MS identification results for the five interesting proteins were summarized in Table 3. Figure 4 showed the locations and differential expression trends of the five protein spots on the 2-DE gels. Figure 5 indicated their expression level in WB. Independent sample t-test of the WB data (Table 4) confirmed their differential expression, and the expression trend in the two groups of samples is consistent with the findings from the 2-DE gel analyses, i.e., upregulation of GSN, RSU1, SOD2 and downregulation of GPX1 and P4HB in low BMD samples.
Table 2.
Known functions of the five confirmed proteins
| Protein symbol | Known functions |
|---|---|
| GSN | GSN regulates the polymerization/depolymerization of actin and functions in cell migration and adhesion; GSN is critical in osteoclast podosome assembly, rapid cell movements, signal transduction, and osteoclast activation and adhesion; it is invovled in regulation of the osteoclastic actin rings formation; Its deficiency may block osteoclast’ podosome assembly and produce increased bone mass and strength |
| RSU1 | RSU1 is involved in the ras signal transduction pathway, growth inhibition, and nerve-growth factor induced differentiation processes; it is related to cell attachment and cell differentiation |
| SOD2 | SOD2 removes superoxidate and catalyzes the production of hydrogen peroxide (H2O2), which may contribute to osteoclast differentiation, formation and activity. There was a negative correlation between SOD and lumbar BMD levels. Women with postmenopausal OP had significantly higher plasma SOD enzyme activity |
| GPX1 | Glutathione peroxidase is one of the most important antioxidant enzymes in humans. It functions in the detoxification of hydrogen peroxide, which may contribute to osteoclast differentiation, formation and activity |
| P4HB | P4HB is a highly multifunctional polypeptide: (1) to catalyze disulfide bond formation and the formation of 4-hydroxyproline of -X-Pro-Gly-triplets; (2) to assist protein assembly and protein folding; (3) to prevent degradation of immature thyroglobulin; (4) to participate in triglyceride transfer, NO equivalents transfer; and (5) to participates in apoptosis regulation |
Table 3.
MS and/or MS/MS Identification Results for the Five Key Proteins
| SSP | Protein symbol |
gi | Score | MW | pI | Sequence coverage |
Matched peptides number |
Unmatched peptides number |
Peptide sequenced |
|---|---|---|---|---|---|---|---|---|---|
| 6406 | GSN | 38044288 | 240 | 80 876 | 5.58 | 24% | 18 | 46 | R.EVQGFESATFLGYFK.S K.HVVPNEVVVQR.L |
| 7006 | SOD2 | 30841309 | 115 | 23 772 | 6.87 | 27% | 6 | 15 | K.GDVTAQIALQPALK.F |
| 7105 | RSU1 | 6912638 | 134 | 31 521 | 8.57 | 65% | 13 | 24 | None |
| 610 | P4HB | 20070125 | 239 | 57 480 | 4.76 | 39% | 12 | 6 | K.VDATEESDLAQQYGVR.G K.ILFIFIDSDHTDNQR.I |
| 3002 | GPX1 | 14717805 | 128 | 22 218 | 6.15 | 61% | 11 | 24 | K.FLVGPDGVPLRR.Y |
Figure 4.
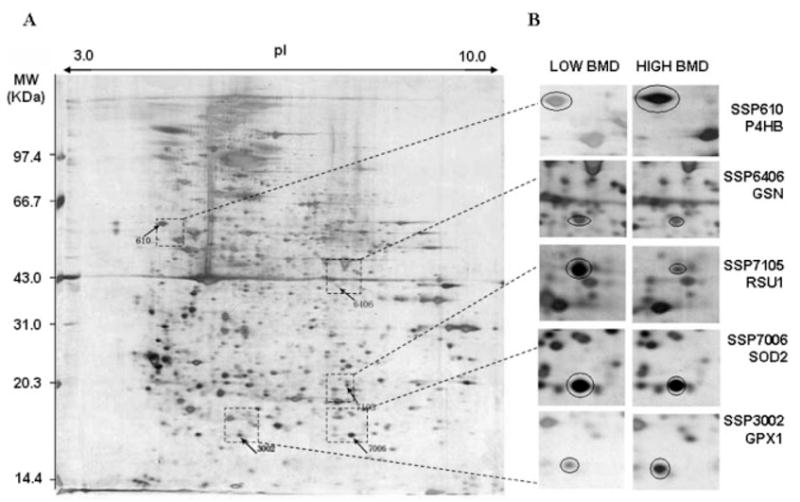
Locations and differential expression of the five protein spots on 2-DE gels. For each pooled sample, 300 μg of total protein from the CMC lysate were profiled by a first dimensional electrophoresis on an 18 cm IPG DryStrip (pH 3–10 L), followed by a second dimensional electrophoresis on a 10% 1.0 mm thick SDS-PAGE gel. The 2-DE was performed with the Amersham Pharmacia system. The proteins on 2-DE gel was stained by silver nitrate, quantified by PDQuest v7.2, and identified by MALDI-TOF/TOF-MS instrument. A, an example of expression profile in a CMC sample with low BMD; SSP610, 3002 and SSP6406, 7105, 7006 are proteins significantly down- and upregulated in low BMD samples, respectively. B, magnified proteins spots indicating the differential expression trend in low and high BMD samples.
Figure 5.
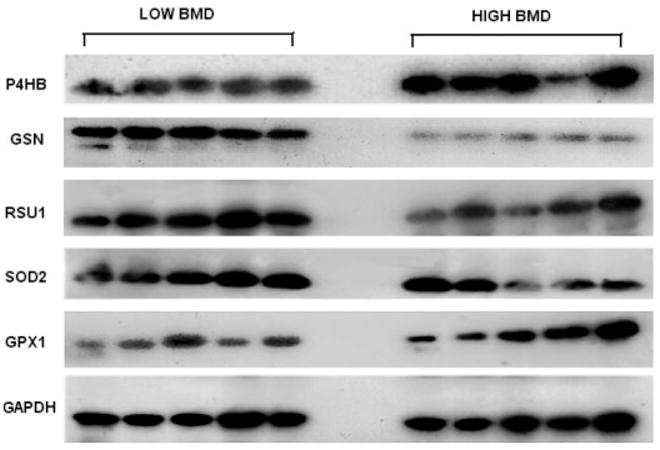
WB images for the five proteins and internal control protein GAPDH. The image presented for each target protein represented for one of the triplicate WB experiments; 25 μg of total protein for each sample are loaded for each WB experiment; the images were obtained through film X-ray exposure developed by using horseradish peroxidase – labeled secondary antibody and LumiGLO chemiluminescent substrates.
Table 4.
Quantification and comparison of protein expression level in WB
| Protein | SOD2 | GSN | RSU1 | GPX1 | P4HB |
|---|---|---|---|---|---|
| SSP | 7006 | 6406 | 7105 | 3002 | 610 |
| L:H in 2-DE | 1.06 | 1.54 | 1.32 | 0.83 | 0.52 |
| L:H in WB | 1.45 | 1.25 | 1.59 | 0.88 | 0.64 |
| L1 | 4733.8 | 901.3 | 1239.3 | 2031.5 | 508.7 |
| L2 | 4856.1 | 914.6 | 1318.9 | 2148.9 | 673.2 |
| L3 | 5407.9 | 967.6 | 1433.7 | 2125.3 | 689.7 |
| L4 | 6679.9 | 787.4 | 1388.2 | 2077.8 | 758.6 |
| L5 | 7132.5 | 725.9 | 1059.1 | 2114.3 | 683.2 |
| H1 | 5121.4 | 764.5 | 886.8 | 2169.1 | 1001.8 |
| H2 | 4581.9 | 674.9 | 935.2 | 2274.3 | 1153.7 |
| H3 | 4295.6 | 791.1 | 662.5 | 2514.7 | 1185.5 |
| H4 | 3512.4 | 566.4 | 665.2 | 2527.1 | 771.5 |
| H5 | 2295.9 | 631.4 | 912.6 | 2472.7 | 1038.5 |
| p1 | 0.03a | 0.02a | 0.00 | 0.01a | 0.00 |
L, low BMD sample; H, high BMD sample; p1 refers to the t-test result based on normalized WB data against background.
Means significant t-test result (p<0.05) based on normalized WB data against GAPDH.
4 Discussion
For the first time using proteomics techniques (2-DE followed by MALDI-TOF/TOF-MS) on in vivo human CMCs, we identified 38 DEPs in Chinese premenopausal females with extremely high versus low BMD. Regulation trend on 2-DE gels for the five proteins (GSN, RSU1, P4HB, SOD2, and GPX1) (Fig. 4) has been verified by WB (Fig. 5). In the following, we will discuss the roles of the five WB-confirmed proteins in relation to osteoclastogeneis (Fig. 6).
Figure 6.
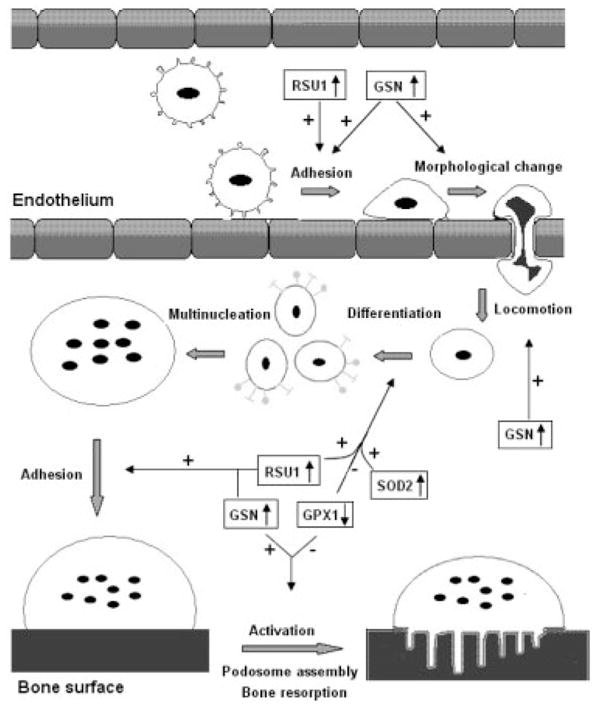
Potential roles of the proteins in osteoclastogenesis. This figure depicts how CMCs migrate from blood vessels to bone surface and activate into bone-resorbing osteoclasts. The major process, on which the proteins may exert their effects, was indicated by arrows. Plus sign means stimulate, minus sign means inhibit. ↓↑ Up- or downregulation in low BMD samples;  CMCs;
CMCs; monocyte;
 monocyte committed to osteoclast differentiation;
  multinucleate cell;
  mature osteoclast; and
  active osteoclast.
GSN, upregulated in low BMD group in this study, regulates the polymerization/depolymerization of actin and the gelsol state alternation of the cytoplasm [31]. It functions in cell migration and adhesion [32–37]. GSN was shown to be critical in osteoclasts for podosome assembly, rapid cell movements, and signal transduction through the α (v) β (3) integrin [38]. Podosomes are osteoclast adhesion structures, where a rapid polymerization/depolymerization of actin occurs [39]. GSN null osteoclasts failed to produce podosomes [40]. Moreover, GSN may link osteoclasts to the bone matrix upon integrin activation, which will finally activate osteoclasts for bone resorption [41]. During bone resorption, GSN helps to congregate adhesion-associated signaling proteins to the plasma membrane of osteoclasts [42], and be involved in regulation of the osteoclastic actin rings formation [43]. GSN-deficient osteoclasts were found to display increased bone mass and strength [38]. Our finding of up-regulation of GSN in low BMD subjects is consistent with the above findings that the protein promotes osteoclastogenesis and bone resorption by enhancing osteoclast migration, adhesion, and activity.
For peripheral skeleton, circulation provides the sole access route of blood monocytes to bone surfaces [10–12, 44]. Naturally, as the precursors of osteoclasts, transendothelial movement of CMCs to bone micro-environment is a fundamental step to their later differentiation into active osteoclasts. It has been demonstrated that there is no significant difference in the number of CMCs between the osteoporotic and normal subjects [45], which suggested that the increased osteoclastogenesis in osteoporotic subjects may not result from the absolute quantity of CMCs but more CMCs moving into the bone micro-environment to differentiate into osteoblasts. Therefore, CMCs’ adhesion to vascular endothelium, morphologic changes, and trans-endothelial locomotion, as regulated by the protein GSN, is critical for osteoclastogenesis and thus OP.
RSU1 is a highly conserved leucine rich repeat protein, expressed ubiquitously in mammalian cells. Reduction in expressed RSU1 mRNA and protein inhibited cell attachment [46]. Its expression was also related to enhanced differentiation [47]. Based on these evidences, we speculate that upregulation of RSU1 may lead to lower BMD, mainly by inducing osteoclast differentiation and by enhancing the attachment of monocytes to the vascular wall, thus promoting their trans-endothelium. Further molecular and cellular studies of RSU1 in CMCs are needed to confirm its effects on osteoclastogenesis.
SOD2 catalyzes the production of hydrogen peroxide (H2O2) from superoxide. GPX1 plays an important role in the detoxification of H2O2; it is one of the most important anti-oxidant enzymes in humans. Taken together, SOD2 and GPX1 may act together to regulate the cellular level of H2O2. Interestingly, H2O2 may stimulate osteoclast differentiation [48–50], RANKL expression in human osteoblast-like MG63 cell line [51], and osteoclast formation, and enhance activity of mature osteoclasts in mouse calvariae [52]. In addition, over-expression of GPX in RAW 264.7 cells may abolish its differentiation and osteoclast formation [53]. Therefore, we speculate that upregulation of SOD2 and downregulation of GPX1, as detected in our low BMD group, may promote osteroclast differentiation, formation, and activity. Consistent with our findings, previous studies showed that women with postmenopausal OP had significantly higher plasma SOD enzyme activity than controls [54], and osteoporotic males showed a negative correlation between serum SOD and lumbar BMD [52]. All these evidences indicated that SOD2 and GPX1 may play significant roles in pathogenesis of OP.
Prolyl 4-hydroxylase may catalyze the formation of 4-hydroxyproline by hydroxylation of -X-Pro-Gly-triplets [55]. It recognizes and retains unfolded procollagen molecules within the ER until they were folded correctly [56, 57]. The β subunit of prolyl 4-hydroxylase (P4HB), also named protein disulfide isomerase (PDI), is a highly multifunctional polypeptide. It functions to catalyze the formation of disulfide bond and the formation of 4-hydroxyproline of -X-Pro-Gly-triplets, to assist protein assembly and protein folding, and to participate in apoptosis regulation, etc. [55, 58–63]. The detailed mechanism whereby P4HB regulates osteoclastogenesis leading to low BMD phenotype, as shown in our study, needs further investigation.
In this study, an extremely sampling scheme was utilized. The study subjects with high or low BMD were recruited from the top or bottom 12% of the BMD distribution in a healthy premenopausal female population. Such an extreme sampling scheme helps to increases the power to detect the significantly DEPs. According to the method of sample pooling suggested by Zhang and Gant [64], we pooled three samples in the same group together in this study, which decreased the experiment cost but retained equivalent power [65].
In summary, for the first time using proteomics techniques on in vivo human CMCs, we identified a list of DEPs in Chinese premenopausal females with high versus low BMD and verified five proteins (GSN, RSU1, SOD2, GPX1, and P4HB) by WB. These proteins may be important for monocytes’ trans-endothelium, differentiation, and/or maturation, thus contribute to differential osteoclastogenesis and lead to BMD variation. In this study, proteomics techniques and extreme sampling scheme proved effective and promising to identify proteins important to pathogenesis of OP. This strategy may also benefit systematic research of novel unknown proteins for OP and other human complex diseases. The findings of this study promote our understanding of the role of CMCs in BMD determination, and provide an insight into pathogenesis of human OP.
Supplementary Material
Acknowledgments
The study was partially supported by grants from Natural Science Foundation of China (nos. 30230210, 30470534, and 30600364) and Scientific Research Initiated Fund of Hunan Normal University (531120-1113). HWD, YZL, and GX were partially supported by NIH grants R21 AG027110-01A1, R01 GM60402, R01 AR050496, K01 AR02170-01A2, and P50 AR055081.
Abbreviations
- BMD
bone mineral density
- CMCs
circulating monocytes
- DEP
differentially expressed protein
- GO
gene ontology
- GPX1
glutathione peroxidase 1
- GSN
gelsolin
- MNCs
circulating mononuclear cells
- OE
Onto-Express
- OP
osteoporosis
- P4HB
prolyl 4-hydroxylase β subunit
- RSU1
ras suppressor protein1
- SAM
significance analysis of microarrays
- SOD2
manganese-containing superoxide dismutase
- WB
Western blotting
- WGA
weighted gene analysis
Footnotes
The authors have declared no conflict of interest.
References
- 1.Cummings SR, Nevitt MC, Browner WS, Stone K, et al. Risk factors for hip fracture in white women. Study of osteoporotic fractures research group. N Engl J Med. 1995;332:767–773. doi: 10.1056/NEJM199503233321202. [DOI] [PubMed] [Google Scholar]
- 2.Melton LJ., III How many women have osteoporosis now? J Bone Miner Res. 1995;10:175–177. doi: 10.1002/jbmr.5650100202. [DOI] [PubMed] [Google Scholar]
- 3.Deng HW, Mahaney MC, Williams JT, Li J, et al. Relevance of the genes for bone mass variation to susceptibility to osteoporotic fractures and its implications to gene search for complex human diseases. Genet Epidemiol. 2002;22:12–25. doi: 10.1002/gepi.1040. [DOI] [PubMed] [Google Scholar]
- 4.Liu PY, Qin YJ, Recker RR, Deng HW. Evidence for a major gene underlying bone size variation in the Chinese. Am J Hum Biol. 2004;16:68–77. doi: 10.1002/ajhb.10240. [DOI] [PubMed] [Google Scholar]
- 5.Jian WX, Long JR, Li MX, Liu XH, Deng HW. Genetic determination of variation and covariation of bone mineral density at the hip and spine in a Chinese population. J Bone Miner Metab. 2005;23:181–185. doi: 10.1007/s00774-004-0558-3. [DOI] [PubMed] [Google Scholar]
- 6.Liu YJ, Shen H, Xiao P, Xiong DH, et al. Molecular genetic studies of gene identification for osteoporosis: A 2004 update. J Bone Miner Res. 2006;21:1511–1535. doi: 10.1359/JBMR.051002. [DOI] [PMC free article] [PubMed] [Google Scholar]
- 7.Liu YZ, Dvornyk V, Lu Y, Shen H, et al. A novel pathophysiological mechanism for osteoporosis suggested by an in vivo gene expression study of circulating monocytes. J Biol Chem. 2005;280:29011–29016. doi: 10.1074/jbc.M501164200. [DOI] [PubMed] [Google Scholar]
- 8.Nakamura M, Udagawa N, Matsuura S, Mogi M, et al. Osteoprotegerin regulates bone formation through a coupling mechanism with bone resorption. Endocrinology. 2003;144:5441–5449. doi: 10.1210/en.2003-0717. [DOI] [PubMed] [Google Scholar]
- 9.Martin TJ, Sims NA. Osteoclast-derived activity in the coupling of bone formation to resorption. Trends Mol Med. 2005;11:76–81. doi: 10.1016/j.molmed.2004.12.004. [DOI] [PubMed] [Google Scholar]
- 10.Zambonin ZA, Teti A, Primavera MV. Monocytes from circulating blood fuse in vitro with purified osteoclasts in primary culture. J Cell Sci. 1984;66:335–342. doi: 10.1242/jcs.66.1.335. [DOI] [PubMed] [Google Scholar]
- 11.Horton MA, Spragg JH, Bodary SC, Helfrich MH. Recognition of cryptic sites in human and mouse laminins by rat osteoclasts is mediated by beta 3 and beta 1 integrins. Bone. 1994;15:639–646. doi: 10.1016/8756-3282(94)90312-3. [DOI] [PubMed] [Google Scholar]
- 12.Parfitt AM. Osteonal and hemi-osteonal remodeling: The spatial and temporal framework for signal traffic in adult human bone. J Cell Biochem. 1994;55:273–286. doi: 10.1002/jcb.240550303. [DOI] [PubMed] [Google Scholar]
- 13.Fujikawa Y, Quinn JM, Sabokbar A, McGee JO, Athanasou NA. The human osteoclast precursor circulates in the monocyte fraction. Endocrinology. 1996;137:4058–4060. doi: 10.1210/endo.137.9.8756585. [DOI] [PubMed] [Google Scholar]
- 14.Higuchi S, Tabata N, Tajima M, Ito M, et al. Induction of human osteoclast-like cells by treatment of blood monocytes with anti-fusion regulatory protein-1/CD98 monoclonal antibodies. J Bone Miner Res. 1998;13:44–49. doi: 10.1359/jbmr.1998.13.1.44. [DOI] [PubMed] [Google Scholar]
- 15.Matayoshi A, Brown C, DiPersio JF, Haug J, et al. Human blood-mobilized hematopoietic precursors differentiate into osteoclasts in the absence of stromal cells. Proc Natl Acad Sci USA. 1996;93:10785–10790. doi: 10.1073/pnas.93.20.10785. [DOI] [PMC free article] [PubMed] [Google Scholar]
- 16.Purton LE, Lee MY, Torok-Storb B. Normal human peripheral blood mononuclear cells mobilized with granulocyte colony-stimulating factor have increased osteoclastogenic potential compared to nonmobilized blood. Blood. 1996;87:1802–1808. [PubMed] [Google Scholar]
- 17.Udagawa N, Takahashi N, Akatsu T, Tanaka H, et al. Origin of osteoclasts: Mature monocytes and macrophages are capable of differentiating into osteoclasts under a suitable microenvironment prepared by bone marrow-derived stromal cells. Proc Natl Acad Sci USA. 1990;87:7260–7264. doi: 10.1073/pnas.87.18.7260. [DOI] [PMC free article] [PubMed] [Google Scholar]
- 18.Quinn JM, Neale S, Fujikawa Y, McGee JO, et al. Human osteoclast formation from blood monocytes, peritoneal macrophages, and bone marrow cells. Calcif Tissue Int. 1998;62:527–531. doi: 10.1007/s002239900473. [DOI] [PubMed] [Google Scholar]
- 19.Nathan CF. Secretory products of macrophages. J Clin Invest. 1987;79:319–326. doi: 10.1172/JCI112815. [DOI] [PMC free article] [PubMed] [Google Scholar]
- 20.Cohen-Solal ME, Graulet AM, Denne MA, Gueris J, et al. Peripheral monocyte culture supernatants of menopausal women can induce bone resorption: Involvement of cytokines. J Clin Endocrinol Metab. 1993;77:1648–1653. doi: 10.1210/jcem.77.6.8263153. [DOI] [PubMed] [Google Scholar]
- 21.Pacifici R. Estrogen, cytokines, and pathogenesis of post-menopausal osteoporosis. J Bone Miner Res. 1996;11:1043–1051. doi: 10.1002/jbmr.5650110802. [DOI] [PubMed] [Google Scholar]
- 22.Cohen-Solal ME, Boitte F, Bernard-Poenaru O, Denne MA, et al. Increased bone resorbing activity of peripheral monocyte culture supernatants in elderly women. J Clin Endocrinol Metab. 1998;83:1687–1690. doi: 10.1210/jcem.83.5.4808. [DOI] [PubMed] [Google Scholar]
- 23.Carrascosa A, Gussinye M, Yeste D, del Rio L, et al. Bone mass acquisition during infancy, childhood and adolescence. Acta Paediatr Suppl. 1995;411:18–23. doi: 10.1111/j.1651-2227.1995.tb13854.x. [DOI] [PubMed] [Google Scholar]
- 24.Yao WJ, Wu CH, Wang ST, Chang CJ, et al. Differential changes in regional bone mineral density in healthy Chinese: Age-related and sex-dependent. Calcif Tissue Int. 2001;68:330–336. doi: 10.1007/s002230001210. [DOI] [PubMed] [Google Scholar]
- 25.Manolagas SC, Jilka RL. Bone marrow, cytokines, and bone remodeling. Emerging insights into the pathophysiology of osteoporosis. N Engl J Med. 1995;332:305–311. doi: 10.1056/NEJM199502023320506. [DOI] [PubMed] [Google Scholar]
- 26.Pacifici R. Estrogen, cytokines, and pathogenesis of post-menopausal osteoporosis. J Bone Miner Res. 1996;11:1043–1051. doi: 10.1002/jbmr.5650110802. [DOI] [PubMed] [Google Scholar]
- 27.Deng HW, Deng XT, Conway T, Xu FH, et al. Determination of bone size of hip, spine, and wrist in human pedigrees by genetic and lifestyle factors. J Clin Densitom. 2002;5:45–56. doi: 10.1385/jcd:5:1:045. [DOI] [PubMed] [Google Scholar]
- 28.Yu Y, Khan J, Khanna C, Helman L, et al. Expression profiling identifies the cytoskeletal organizer ezrin and the developmental homeoprotein Six-1 as key metastatic regulators. Nat Med. 2004;10:175–181. doi: 10.1038/nm966. [DOI] [PubMed] [Google Scholar]
- 29.van de Wiel MA. Significance Analysis of Microarrays using Rank Scores. Kwantitatieve Methoden. 2004;71:25–37. [Google Scholar]
- 30.Perkins DN, Pappin DJ, Creasy DM, Cottrell JS. Probability-based protein identification by searching sequence databases using mass spectrometry data. Electrophoresis. 1999;20:3551–3567. doi: 10.1002/(SICI)1522-2683(19991201)20:18<3551::AID-ELPS3551>3.0.CO;2-2. [DOI] [PubMed] [Google Scholar]
- 31.Silacci P, Mazzolai L, Gauci C, Stergiopulos N, et al. Gelsolin superfamily proteins: Key regulators of cellular functions. Cell Mol Life Sci. 2004;61:2614–2623. doi: 10.1007/s00018-004-4225-6. [DOI] [PMC free article] [PubMed] [Google Scholar]
- 32.Stossel TP, Hartwig JH, Yin HL, Southwick FS, Zaner KS. The motor of leukocytes. Fed Proc. 1984;43:2760–2763. [PubMed] [Google Scholar]
- 33.Perez Castrillon JL, Garcia Palomo JD, Perez Arellano JL, Jimenez LA. Leukocyte chemotaxis. Allergol Immunopathol (Madr) 1988;16:279–283. [PubMed] [Google Scholar]
- 34.Chaponnier C, Kocher O, Gabbiani G. Modulation of gelsolin content in rat aortic smooth muscle cells during development, experimental intimal thickening and culture. An immunohistochemical and biochemical study. Eur J Biochem. 1990;190:559–565. doi: 10.1111/j.1432-1033.1990.tb15610.x. [DOI] [PubMed] [Google Scholar]
- 35.Cunningham CC, Stossel TP, Kwiatkowiski DJ. Enhanced motility in NIH3T3 fibroblasts that overexpress gelsolin. Science. 1991;251:1233–1236. doi: 10.1126/science.1848726. [DOI] [PubMed] [Google Scholar]
- 36.Arora PD, McCulloch CA. Dependence of fibroblast migration on actin severing activity of gelsolin. J Biol Chem. 1996;271:20516–20523. doi: 10.1074/jbc.271.34.20516. [DOI] [PubMed] [Google Scholar]
- 37.Kwiatkowski DJ. Functions of gelsolin: Motility, signaling, apoptosis, cancer. Curr Opin Cell Biol. 1999;11:103–108. doi: 10.1016/s0955-0674(99)80012-x. [DOI] [PubMed] [Google Scholar]
- 38.Chellaiah M, Kizer N, Silva M, Alvarez U, et al. Gelsolin deficiency blocks podosome assembly and produces increased bone mass and strength. J Cell Biol. 2000;148:665–678. doi: 10.1083/jcb.148.4.665. [DOI] [PMC free article] [PubMed] [Google Scholar]
- 39.Akisaka T, Yoshida H, Inoue S, Shimizu K. Organization of cytoskeletal F-actin, G-actin, and gelsolin in the adhesion structures in cultured osteoclast. J Bone Miner Res. 2001;16:1248–1255. doi: 10.1359/jbmr.2001.16.7.1248. [DOI] [PubMed] [Google Scholar]
- 40.Chellaiah MA. Regulation of actin ring formation by rho GTPases in osteoclasts. J Biol Chem. 2005;280:32930–32943. doi: 10.1074/jbc.M500154200. [DOI] [PubMed] [Google Scholar]
- 41.Duong LT, Lakkakorpi P, Nakamura I, Rodan GA. Integrins and signaling in osteoclast function. Matrix Biol. 2000;19:97–105. doi: 10.1016/s0945-053x(00)00051-2. [DOI] [PubMed] [Google Scholar]
- 42.Chellaiah MA, Biswas RS, Yuen D, Alvarez UM, Hruska KA. Phosphatidylinositol 3,4,5-trisphosphate directs association of Src homology 2-containing signaling proteins with gelsolin. J Biol Chem. 2001;276:47434–47444. doi: 10.1074/jbc.M107494200. [DOI] [PubMed] [Google Scholar]
- 43.Wang Q, Xie Y, Du QS, Wu XJ, et al. Regulation of the formation of osteoclastic actin rings by proline-rich tyrosine kinase 2 interacting with gelsolin. J Cell Biol. 2003;160:565–575. doi: 10.1083/jcb.200207036. [DOI] [PMC free article] [PubMed] [Google Scholar]
- 44.Parfitt AM. Osteoclast precursors as leukocytes: Importance of the area code. Bone. 1998;23:491–494. doi: 10.1016/s8756-3282(98)00140-9. [DOI] [PubMed] [Google Scholar]
- 45.Jevon M, Hirayama T, Brown MA, Wass JA, et al. Osteoclast formation from circulating precursors in osteoporosis. Scand J Rheumatol. 2003;32:95–100. doi: 10.1080/03009740310000102. [DOI] [PubMed] [Google Scholar]
- 46.Dougherty GW, Chopp T, Qi SM, Cutler ML. The Ras suppressor Rsu-1 binds to the LIM 5 domain of the adaptor protein PINCH1 and participates in adhesion-related functions. Exp Cell Res. 2005;306:168–179. doi: 10.1016/j.yexcr.2005.01.025. [DOI] [PubMed] [Google Scholar]
- 47.Masuelli L, Ettenberg S, Vasaturo F, Vestergaard-Sykes K, Cutler ML. The ras suppressor, RSU-1, enhances nerve growth factor-induced differentiation of PC12 cells and induces p21CIP expression. Cell Growth Differ. 1999;10:555–564. [PubMed] [Google Scholar]
- 48.Lee NK, Choi YG, Baik JY, Han SY, et al. A crucial role for reactive oxygen species in RANKL-induced osteoclast differentiation. Blood. 2005;106:852–859. doi: 10.1182/blood-2004-09-3662. [DOI] [PubMed] [Google Scholar]
- 49.Kim HJ, Chang EJ, Kim HM, Lee SB, et al. Anti-oxidant alpha-lipoic acid inhibits osteoclast differentiation by reducing nuclear factor-kappaB DNA binding and prevents in vivo bone resorption induced by receptor activator of nuclear factor-kappaB ligand and tumor necrosis factor-alpha. Free Radical Biol Med. 2006;40:1483–1493. doi: 10.1016/j.freeradbiomed.2005.10.066. [DOI] [PubMed] [Google Scholar]
- 50.Steinbeck MJ, Kim JK, Trudeau MJ, Hauschka PV, Karnovsky MJ. Involvement of hydrogen peroxide in the differentiation of clonal HD-11EM cells into osteoclast-like cells. J Cell Physiol. 1998;176:574–587. doi: 10.1002/(SICI)1097-4652(199809)176:3<574::AID-JCP14>3.0.CO;2-#. [DOI] [PMC free article] [PubMed] [Google Scholar]
- 51.Bai XC, Lu D, Liu AL, Zhang ZM, et al. Reactive oxygen species stimulates receptor activator of NF-kappaB ligand expression in osteoblast. J Biol Chem. 2005;280:17497–17506. doi: 10.1074/jbc.M409332200. [DOI] [PubMed] [Google Scholar]
- 52.Fraser JH, Helfrich MH, Wallace HM, Ralston SH. Hydrogen peroxide, but not superoxide, stimulates bone resorption in mouse calvariae. Bone. 1996;19:223–226. doi: 10.1016/8756-3282(96)00177-9. [DOI] [PubMed] [Google Scholar]
- 53.Lean JM, Jagger CJ, Kirstein B, Fuller K, Chambers TJ. Hydrogen peroxide is essential for estrogen-deficiency bone loss and osteoclast formation. Endocrinology. 2005;146:728–735. doi: 10.1210/en.2004-1021. [DOI] [PubMed] [Google Scholar]
- 54.Ozgocmen S, Kaya H, Fadillioglu E, Aydogan R, Yilmaz Z. Role of antioxidant systems, lipid peroxidation, and nitric oxide in postmenopausal osteoporosis. Mol Cell Biochem. 2007;295:45–52. doi: 10.1007/s11010-006-9270-z. [DOI] [PubMed] [Google Scholar]
- 55.Helaakoski T, Annunen P, Vuori K, MacNeil IA, et al. Cloning, baculovirus expression, and characterization of a second mouse prolyl 4-hydroxylase alpha-subunit isoform: Formation of an alpha 2 beta 2 tetramer with the protein disulfide-isomerase/beta subunit. Proc Natl Acad Sci USA. 1995;92:4427–4431. doi: 10.1073/pnas.92.10.4427. [DOI] [PMC free article] [PubMed] [Google Scholar]
- 56.Chessler SD, Byers PH. Defective folding and stable association with protein disulfide isomerase/prolyl hydroxylase of type I procollagen with a deletion in the pro alpha 2(I) chain that preserves the Gly-X-Y repeat pattern. J Biol Chem. 1992;267:7751–7757. [PubMed] [Google Scholar]
- 57.Walmsley AR, Batten MR, Lad U, Bulleid NJ. Intra-cellular retention of procollagen within the endoplasmic reticulum is mediated by prolyl 4-hydroxylase. J Biol Chem. 1999;274:14884–14892. doi: 10.1074/jbc.274.21.14884. [DOI] [PubMed] [Google Scholar]
- 58.Tian R, Li SJ, Wang DL, Zhao Z, et al. The acidic C-terminal domain stabilizes the chaperone function of protein disulfide isomerase. J Biol Chem. 2004;279:48830–48835. doi: 10.1074/jbc.M407076200. [DOI] [PubMed] [Google Scholar]
- 59.Zhao TJ, Ou WB, Xie Q, Liu Y, et al. Catalysis of creatine kinase refolding by protein disulfide isomerase involves disulfide cross-link and dimer to tetramer switch. J Biol Chem. 2005;280:13470–13476. doi: 10.1074/jbc.M413882200. [DOI] [PubMed] [Google Scholar]
- 60.Wetterau JR, Combs KA, McLean LR, Spinner SN, Aggerbeck LP. Protein disulfide isomerase appears necessary to maintain the catalytically active structure of the microsomal triglyceride transfer protein. Biochemistry. 1991;30:9728–9735. doi: 10.1021/bi00104a023. [DOI] [PubMed] [Google Scholar]
- 61.Sliskovic I, Raturi A, Mutus B. Characterization of the S-denitrosation activity of protein disulfide isomerase. J Biol Chem. 2005;280:8733–8741. doi: 10.1074/jbc.M408080200. [DOI] [PubMed] [Google Scholar]
- 62.Mezghrani A, Courageot J, Mani JC, Pugniere M, et al. Protein-disulfide isomerase (PDI) in FRTL5 cells. pH-dependent thyroglobulin/PDI interactions determine a novel PDI function in the post-endoplasmic reticulum of thyrocytes. J Biol Chem. 2000;275:1920–1929. doi: 10.1074/jbc.275.3.1920. [DOI] [PubMed] [Google Scholar]
- 63.Ko HS, Uehara T, Nomura Y. Role of ubiquilin associated with protein-disulfide isomerase in the endoplasmic reticulum in stress-induced apoptotic cell death. J Biol Chem. 2002;277:35386–35392. doi: 10.1074/jbc.M203412200. [DOI] [PubMed] [Google Scholar]
- 64.Zhang SD, Gant TW. Effect of pooling samples on the efficiency of comparative studies using microarrays. Bioinformatics. 2005;21:4378–4383. doi: 10.1093/bioinformatics/bti717. [DOI] [PubMed] [Google Scholar]
- 65.Peng X, Wood CL, Blalock EM, Chen KC, et al. Statistical implications of pooling RNA samples for microarray experiments. BMC Bioinformatics. 2003;4:26. doi: 10.1186/1471-2105-4-26. [DOI] [PMC free article] [PubMed] [Google Scholar]
Associated Data
This section collects any data citations, data availability statements, or supplementary materials included in this article.