Abstract
Commercially available, near-infrared fluorescent squaraine dyes (Seta-635 and Seta-670) were covalently bound to antibodies and employed insurface enhanced immunoassay. From fluorescence intensity and lifetime changes determined for a surface which had been coated with silver nanoparticles as well as a non-coated glass surface, both labelled compounds exhibited a 15 to 20-fold enhancement of fluorescence on the silver coated surface compared to that achieved on the non-coated surface. In addition, the fluorescence lifetime changes drastically for both labels in the case of silver-coated surfaces. The fluorescence signal enhancement obtained for the two dyes was greater than that previously recorded for Rhodamine Red-X and AlexaFluor-647 labels.
Keywords: enhanced fluorescence immunoassays, silver island films, Seta dyes, near-infrared fluorescent squaraine dyes, total internal reflection, sensors
1. Introduction
Numerous fluorescent immunoassays are based on the detection of fluorescence signals from reporter antibodies labeled with a fluorophore [1–2]. To minimize assay volume, decrease unwanted background and increase assay sensitivity, antibodies frequently are immobilized on the surface and a surface-confined detection method is used. In cases where enhanced sensitivity is needed for a surface immunoassay, silver metal particles [3–4] can be utilized to enhance the fluorescence.
Fluorescent labels which absorb and emit in the near-infrared (NIR) have several advantages, such as the reduction of background fluorescence and the use of low-cost red laser diodes. Some of these commercially available red dyes absorb and emit at wavelengths above 620 nm where blood absorption and scattering are small. Examples include Alexa647, Alexa660, Alexa680, and Bodipy dyes from “Invitrogen”, Cy5 and Cy5.5 from “Amerhsam”, and finally DY-655 and EvoBlue30 from “Dyomics”. The spectroscopic properties of these dyes and their use in fluorescence assays have been previously reported [5]. The reactive NIR labels for protein binding available from SETA BioMedicals, Seta-635 and Seta-670, absorb and emit in the 500–900 nm spectral range [6–7]. Unlike Cy and Alexa dyes, these NIR emitting dyes can be excited with both the red (635 nm and 650 nm) diode lasers and blue (370 nm and 405 nm) diode lasers.
Here we report the spectral properties of the labels Seta-635 and Seta-670 in free form and covalently bound to the antibodies, at various dye-to-antibody ratios. Further, we report findings from application of the labeled antibodies in a surface fluorescent immunoassay enhanced with a silver island film (SIF).
2. Experimental Procedures
2.1. Reagents
Anti-rabbit, rabbit, and goat immunoglobulin (IgG) antibodies, as well as buffer components and salts (such as bovine serum albimun, glucose, sucrose, AgNO3), were purchased from Sigma-Aldrich. The Seta-670 (catalog # K8-1342) and Seta-635 (catalog # K8-1669) labels with reactive succinimidyl ester moieties were donated by SETA BioMedicals, Urbana, IL, USA. Size-exclusion resin (30,000 MW) was purchased from Invitrogen. Microscope glass slides, 3×1 inch, and 1 mm thick, were purchased from VWR.
2.2. Preparation of the slides coated with silver island films (SIFs)
The SIF surface was formed using the procedure previously described in the literature [3–4]. First, half of the surface of each slide was modified by depositing SIF by chemical reduction of silver nitrate via a wet-chemical process using D(+)glucose, while the other half was left unmodified and used as a control. Next, the slides were dried in air and covered with black electric tape with a paper support, containing round holes (punched using a regular size hole puncher) to form wells on the surface, mimicking a 96-well plate.
2.3. Labeling of antibodies
Reporter anti-rabbit IgG antibodies were labeled with the Seta-670-NHS and Seta-635-NHS labels. An aliquote of a freshly prepared stock solution of the reactive dye (5 mg/mL in DMSO) was added to the solution of IgG antibodies (2 mg/mL) in Na-bicarbonate buffer (0.1 M, pH 8.3) and incubated at room temperature in the dark, stirring gently for 1 hour. Unbound dye was separated from the labeled protein by size-exclusion chromatography, using a 30,000 MW resin and a Na-phosphate buffer (50 mM, pH 7.3) as an eluent.
The dye-to-protein ratio of the conjugates was determined spectrophotometrically as described earlier [8–9] where the dye concentration was determined from the visible part of spectra, using the published molar extinction coefficients (ε667 = 179 000 cm−1M−1 for Seta-670 or ε638 = 136 000 cm−1M−1 for Seta-635, see [10] and [11], respectively). The antibody concentration was determined from the absorption of the protein at 280 nm (ε 280 = 203 000 cm−1M−1 for IgG), taking into account the UV absorbance contribution from the covalently bound dye. The UV absorbance contribution was determined by measuring the absorbance spectra of the free dyes and found to be 0.086 × A667 for Seta-670, where A667 is absorbance at 667 nm, and 0.082 × A638 for seta-635, where A638 is absorbance at 638 nm.
We used a correction procedure for the visible part of the spectra at high dye-to-protein ratios. Specifically, we considered the integrated area under the visible part of the spectrum (and not the height of the dye peak) for quantization of the dye in solution. We assumed the quantity of the dye is proportional to the integrated visible absorption spectrum or area under the curve (AUC) from 475 to 750 nm, and calculated a correction factor for each conjugate equal to the ratio of the AUC for the conjugate to the AUC for the free non-bound label (normalized spectra). Integration was performed by a very simple procedure, where spectra were printed out or photocopied to fit the standard page, then the AUC area was cut and its weight was determined using an analytical balance (Mettler Toledo). Thus, AUC was measured in milligrams. See Results And Discussion for more details on the correction factor and AUC.
2.4. Immunoassay procedure
A model immunoassay was performed, similar to reference [3], where we immobilized a model antigen, rabbit IgG, on the surface by physical adsorption (overnight incubation of the rabbit IgG solution of 40 μg/mL in 50 mM Na-phosphate buffer, pH 7.3, 25 μL per well, at room temperature). Then, all remaining protein binding sites were blocked by a blocking buffer (1% bovine serum albumin, 1% sucrose, 0.05% NaN3, 0.05% Tween-20 in 50 mM Na-phosphate buffer, pH 7.3), 35 μL per well, incubation for 2 hrs at room temperature. After washing, a conjugate of the labeled reporter, anti-rabbit antibody (at 5 μg/mL in blocking buffer) was added at 25 μL per well, followed by incubation (1 hr at room temperature). Next, the labeled antibody supernatants were removed, and the surfaces were rinsed, covered with 50 mM Na-phosphate buffer, pH 7.3, and stored at +4° C until fluorescence was measured.
We tested the specificity of the model immunoassay by comparing the binding of the labeled anti-rabbit antibody to the “right” antigen (rabbit IgG) and the “wrong” antigen (goat IgG). Control slides were coated with goat IgG. Hence, the signal from the control slides showed the non-specific binding of the labeled anti-rabbit IgG antibody. The background was 8% or less for non-coated glass surface, and 2% or less for SIF-coated glass surface.
2.5. Spectroscopic measurements
Emission spectra in solution were measured using a Varian Cary Eclipse fluorometer (Varian Analytical Instruments, USA), while absorption spectra in solution and on the surface of the slides were measured using a Varian Cary Eclipse spectrophotometer. Fluorescence measurements of the samples on glass and glass-SIF slides were performed by placing the slides horizontally on a total internal reflection (TIR) stage as described in [3]. The TIR stage consisted of a coupling prism mounted in a custom-made holder. For excitation we used a solid state laser diode operating at 635 nm, the wavelength used for commercial laser pointers. Emission spectra were collected by fiber optics mounted on x and y stages on the top (using an appropriate cut-off filter) for moving to different spots on the slide with the Varian Cary Eclipse fluorometer.
3. Results and Discussion
3.1. Conjugation and dye/antibody ratio determination
The coupling of Seta-670 to anti-rabbit IgG was performed with starting dye-to-protein ratios of 2.5, 5, 10, 15, 23, and 50 (mol/mol), respectively. The coupling of Seta-635 to anti-rabbit IgG was performed with a starting dye-to-protein ratio of 15 mol/mol.
Initially, the label-to-IgG ratio in the resulting conjugates was calculated similarly to references [8–9] as recommended by Invitrogen for antibody labeling kits. In particular, dye concentration was determined from the visible part of spectra, using the published molar extinction coefficients. Antibody concentration was determined from the UV part of the spectra, taking into account the UV absorbance contribution from the covalently bound dye. This contribution was determined by measuring the absorbance spectra of the free dyes and was found to be 0.086 × A667 for Seta-670, where A667 is absorbance at 667 nm, and 0.082 × A638 for Seta-635, where A638 is absorbance at 638 nm.
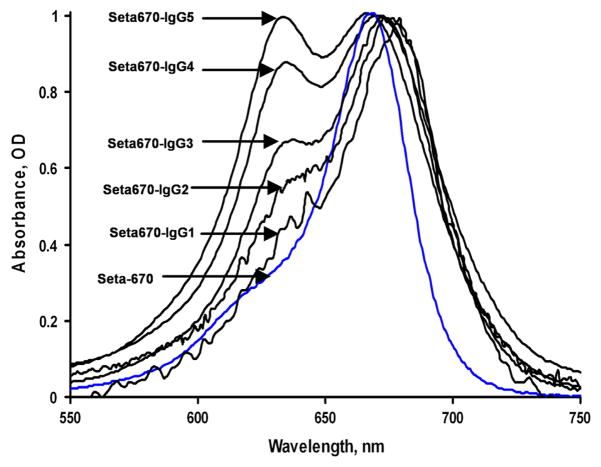
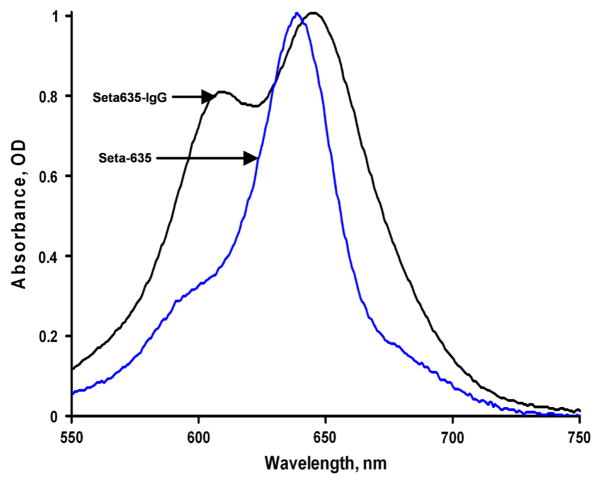
However, this method is not accurate because the spectral characteristics of the dye can change when it is covalently bound to protein. The absorption spectra of our purified conjugates were quite different as compared to that of the free dye (Figures 1 and 2). While the unbound, free dyes have a single sharp peak in the visible region, the covalently bound dyes have an additional peak at a shorter wavelength (Figures 1 and 2) and its intensity increases with increasing dye-to-protein ratios (Figure 1). The apparent maximum of the red absorption peak shifts with an increasing dye-to-protein ratio, compared to the maximum of the free label (see Table 1). We assume that such changes occur due to the interaction of several dye molecules on the same antibody molecule, similar to the changes occurring in dye aggregations [12–13]. For example, methylene blue absorbance spectra with a maximum peak around 650 nm has been attributed to the monomer absorbance and another peak at 600 nm (blue-shifted), with the concentration-dependent intensity attributed to a sandwich-type dimer [10].
Figure 1.
Normalized absorbance spectra of the Seta-670 label and its conjugates with IgG. Seta-670 concentration (non-bound free label) was 5.17 μM; concentrations of the conjugates were 0.376; 1.60; 5.53; 16.0; and 15.23 μM, indicated as IgG1 to IgG5 (all in 50 mM Na-phosphate buffer, pH 7.3).
Figure 2.
Normalized absorbance spectra of the Seta-635 label and its conjugate with IgG. Seta-635 concentration (non-bound free label) was 2.45 μM; concentration of the conjugate was 8.71 μM (in 50 mM Na-phosphate buffer, pH 7.3).
Table 1.
Maxima of the dye peak (visible area) in various Seta-670 conjugates
| Compound | Max wavelength [nm] |
|---|---|
| Seta670 | 668 |
| Seta670-IgG1 | 678 |
| Seta670-IgG2 | 676 |
| Seta670-IgG3 | 673 |
| Seta670-IgG4 | 670 |
| Seta670-IgG5 | 667 |
Often proteins with a low dye-to-protein ratio have a visible absorption spectra similar to the spectra of the free dye, but as the dye-to-protein ratio increases, the spectra change and a second absorption band appears [14–16]. Several methods are suggested in the literature to correct dye-to-protein ratios, such as denaturing of the dye-protein conjugate in 1–2% sodium dodecyl sulfate to eliminate the aggregation peak [14–15], or dilluting the conjugate (1:2) with formamide [16] before measuring the absorbance spectra. Another suggestion was to determine the protein concentration separately by the Lowry method, and the dye concentration in the same conjugate from the absorbance of the conjugate solution in formamide [17]. However, these methods result in denaturation of a portion of the conjugate, which is not desirable for the monoclonal antibody (mAb) conjugates since mAb’s may be very expensive.
Here we suggest a very simple and expeditious method for correcting the dye-to-protein ratio that does not result in the protein denaturation, allowing the same portion of the conjugate used for spectra measurement to be used later for biosensing. This method uses the correction procedure for the visible part of the spectra where the integrated area under the visible part of the spectrum (AUC) should be used for quantization of the dye in the conjugate instead of the height of the dye peak. We have examined this method using a set of two spectra published in [13] for goat IgG with 6 bound Cy5 labels per protein in absence and presence of 1% SDS and found the peak heights to be 58 and 95 mm (a difference of almost two times), while the AUC values were 193.9 and 193.8 mg, respectively. Thus, the AUC is exactly the same for the same conjugate but has completely different spectra in the absence and presence of the denaturing agent.
We calculated a correction factor for each of our conjugates equal to the ratio of the AUC for the conjugate to the AUC for the free non-bound label (spectra were normalized to the height of the free dye peak). The correction factor was >1, increased with increase of the dye-to-protein ratio used for the coupling reaction, and reflected an increase in the visible part of the AUC due to changes in the shape of the spectra and the new aggregation-related peak. Then the dye-to-protein ratio was calculated as described above by measuring the visible (at longer wavelength) peak height, but this height increased proportionally to the correction factor. This resulted in higher dye-to-protein ratios for all conjugates (Table 2) due to two corrected numbers: (1) higher dye concentration, and (2) higher dye input into the UV absorbance at 280 nm that led to lower protein concentration. The difference between non-corrected and corrected ratios (* and ** correspondingly in Table 2) is is grows as ratios increase.
Table 2.
Dye/protein starting ratios and calculated dye/protein ratios for listed conjugates
| Conjugate | Dye/IgG starting ratio, mol/mol | Dye/IgG ratio in the conjugate, mol/mol* | Yield per IgG, %* | Dye/IgG ratio in the conjugate, mol/mol** | Yield per IgG, %** |
|---|---|---|---|---|---|
| Seta635-IgG | 15 | 5.1 | 82 | 13.7 | 47 |
| Seta670-IgG1 | 2.5 | 0.4 | 33 | 0.5 | 33 |
| Seta670-IgG2 | 5 | 0.9 | 70 | 1.2 | 68 |
| Seta670-IgG3 | 10 | 2.2 | 92 | 3.2 | 86 |
| Seta670-IgG4 | 15 | 3.1 | 93 | 6.5 | 79 |
| Seta670-IgG5 | 23 | 4.7 | 57 | 10.9 | 44 |
calculated using dye’s absorption peak height (at 638–642 nm).
calculated using dye’s absorption peak area (integrated from 500 to 750 nm).
3.2. Surface enhanced immunoassay – fluorescence signals
To demonstrate the utility of Seta labels for biosensing, we performed a model immunoassay based on metal-enhanced fluorescence on a SIF-coated glass surface [3] where the model antigen (rabbit IgG) was immobilized on two different surfaces (SIF-coated surface and non-coated glass surface as a reference). The anti-rabbit IgG conjugate (labeled with Seta-670 or Seta-635) was allowed to bind to the antigen. After rinsing the surfaces the fluorescence signal (full spectrum) was measured using the total internal reflection excitation mode (TIRF). In TIRF measurements, the fluorophores were excited by an evanescent wave, which penetrated the glass-sample interface only for a fraction of a micron. Such an excitation modality is preferred in surface assays because it reduces unwanted background fluorescence from the bulk solution.
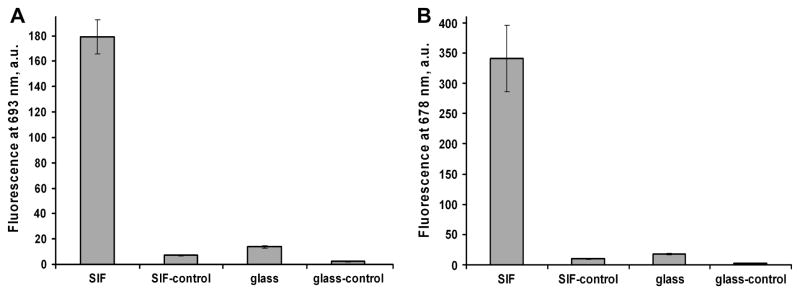
We tested the specificity of enhanced TIRF assay configuration by comparing binding of the labeled anti-rabbit antibody to the “right” rabbit IgG and “wrong” goat IgG antigens. Control slides were coated with the goat IgG antigen. Thus, the signal from control slides showed the non-specific binding background signal of the labeled anti-rabbit IgG antibody. The background was detected from both SIF-coated and bare glass (Table 3). The SIF-coated surface produced a lower background due to the enhanced specific signals (Table 3). The averaged signals for the model immunoassays are shown in Figure 4. Seta-670 produces a lower signal but also lower deviations when compared to Seta-635 (signals are corrected to the binding effectiveness as described below).
Table 3.
Background signals showing non-specific binding as % of the corresponding specific signals
| Conjugate | SIF-coated glass | Bare glass |
|---|---|---|
| Seta-670-IgG4 | 4% | 15% |
| Seta-635-IgG | 3% | 13% |
Figure 4.
Figure 4A. Fluorescence signals for the model immunoassay using Seta670-IgG4-670 on the SIF/coated and non-coated glass surface: controls are measured using “wrong” antigen (goat IgG) and show the level of non-specific binding. Error bars represent plus/minus one standard deviation (SD) (n=6 for samples and n=4 for controls).
Figure 4B. Fluorescence signals for the model immunoassay using Seta-635 label on the SIF/coated and non-coated glass surface: controls are measured using “wrong” antigen (goat IgG) and show the level of non-specific binding. Error bars represent plus/minus one standard deviation (SD) (n=6 for samples and n=4 for controls).
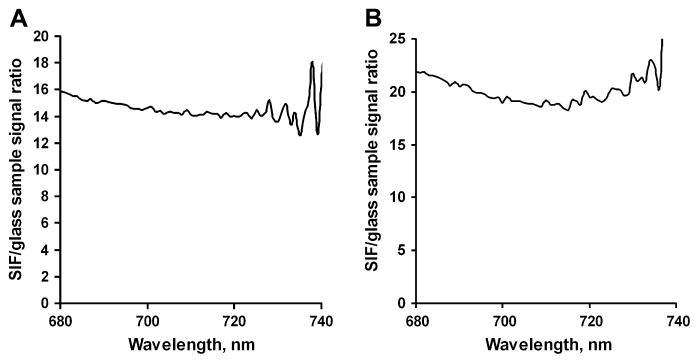
Figures 5A and B show the fluorescence signal ratios for our immunoassay using Seta-670 (Figure 3A) or Seta-635 (Figure 3B) corrected for non-specific background signal. The spectra were also corrected for binding effectiveness. We assumed that the binding percentage may be different for the bare glass and SIF-coated glass surfaces, since the physical properties of the surfaces are different and we immobilized the antigen by physical absorption. Therefore, the binding effectiveness was estimated by measuring the labeled antibody concentrations before and after incubation on each surface (by collecting the emission spectra of the supernatants removed from the reaction wells). Signal intensity was then proportionally adjusted for equal binding. We found that the binding efficiency on the SIF-coated surfaces was usually about 20% higher than that on bare glass (about 30% of the labeled antibodies from the supernatant were bound on the bare glass surface versus 50% on the SIF-coated glass).
Figure 5.
Figure 5A. SIF/coated to non-coated glass fluorescence signal ratios at various wavelengths for the model immunoassay using Seta-670 label.
Figure 5B. SIF/coated to non-coated glass fluorescence signal ratios at various wavelengths for the model immunoassay using the Seta-635 label.
Figure 3.
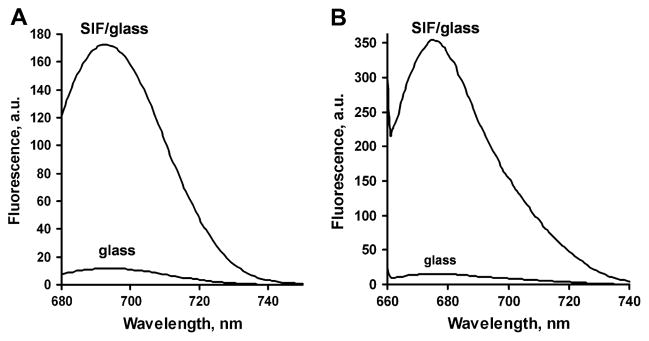
Figure 3A. Fluorescence spectra of the model immunoassay signal using Seta-670 label on the SIF/coated and non-coated glass surface (corrected to the background signal).
Figure 3B. Fluorescence spectra of the model immunoassay signal using Seta-635 label on SIF/coated and non-coated glass surface (corrected to the background signal).
The enhancement of the model immunoassay signal (corrected for non-specific binding and binding efficiency) detected from SIF-coated versus non-coated glass slides calculated for both labels at different wavelengths is shown in Figure 5. The enhancement ratio is approximately 15 for Seta-670 and 20 for Seta-635 at the fluorescence maxima, which is higher than the values of approximately 4 to 8 measured earlier for the same immunoassay using various labels from the Alexa series, Rhodamine Red-X, and TRITC [3]. These enhancement values also confirm our earlier observation that the enhancement is usually larger for longer wavelength dyes.
3.3. Surface enhanced immunoassay – lifetimes
The above described fluorescence enhancement values on SIF-coated surfaces are the result of two effects: (1) fluorophores in the presence of silver nanoparticles are exposed to the enhanced local field created by the plasmonic interaction of metallic nanoparticles with the excitation light increasing the excitation rate; and (2) excited fluorophores interact with silver nanoparticles resulting in a more prompt emission of fluorescence. This effect increases the radiative rate and is known as radiative decay engineering (RDE) [18]. Increased radiative rates are reflected by higher quantum efficiencies and shorter lifetimes. Fluorophores in close proximity to SIFs benefit from these two effects. The lifetime is affected only by the RDE effect. Table 4 contains a multiexponential analysis of the fluorescence intensity decays in absence and presence of SIFs. The short components dominate the decays on SIFs with amplitudes higher than 90% (Table 4). Our data clearly reveal that the mean lifetimes on SIFs are about one order of magnitude shorter than lifetimes on bare glass substrates. It should be noted that fluorophores with shorter lifetimes are more photo stable because the likelihood of photo degradation increases if the molecule remains in the excited state longer.
Table 4.
Multiexponential analysis of the fluorescence intensity decays of Seta dyes
| Compound/conditions | <τ>*, ns | τ̄**, ns | α1 | τ1*, ns | α2 | τ2*, ns | χR2 |
|---|---|---|---|---|---|---|---|
| Seta670-IgG4 conjugate on glass | 0.57 | 1.04 | 0.67 | 0.19 | 0.33 | 1.29 | 0.9 |
| Seta670-IgG4 conjugate on SIFs | 0.06 | 0.09 | 0.96 | 0.048 | 0.04 | 0.25 | 2.1 |
| Seta635-IgG conjugate on glass | 0.67 | 1.29 | 0.71 | 0.26 | 0.29 | 1.67 | 0.9 |
| Seta635-IgG conjugate on SIFs | 0.09 | 0.15 | 0.91 | 0.068 | 0.09 | 0.32 | 1.3 |
, fi = αiτi/(Σαiτi)
4. Conclusions
New near-infrared fluorescent squaraine dyes (Seta-635 and Seta-670) are commercially available in active form and can be easily covalently bound to antibodies. We suggested a very simple and fast method of dye-to-protein ratio correction that does not result in protein denaturation. The integrated area under the visible part of the spectrum (AUC) should be used for quantization of the dye in the conjugate along with the height of the dye peak. We demonstrated that the Seta labels serve as very good fluorophores in surface enhanced immunoassays, providing more than a 10-fold enhancement of fluorescence signal on the silver nanoparticle coated surfaces compared to non-coated surfaces. Lifetime measurements on SIFs and bare glass surfaces demonstrated better photostability for conjugates of both labels on SIFs.
Acknowledgments
This work was supported by Texas Emerging Technologies Fund grant and by NIH HG 004364 and NSF (DBI-0649889).
Footnotes
Publisher's Disclaimer: This is a PDF file of an unedited manuscript that has been accepted for publication. As a service to our customers we are providing this early version of the manuscript. The manuscript will undergo copyediting, typesetting, and review of the resulting proof before it is published in its final citable form. Please note that during the production process errors may be discovered which could affect the content, and all legal disclaimers that apply to the journal pertain.
References
- 1.Luppa PB, Sokoll LJ, Chan DW. Immunosensors--principles and applications to clinical chemistry. Clin Chim Acta. 2001;314(1–2):1–26. doi: 10.1016/s0009-8981(01)00629-5. [DOI] [PubMed] [Google Scholar]
- 2.Haab BB. Methods and applications of antibody microarrays in cancer research. Proteomics. 2003;3(11):2116–2122. doi: 10.1002/pmic.200300595. [DOI] [PubMed] [Google Scholar]
- 3.Matveeva E, Gryczynski Z, Malicka J, Gryczynski I, Lakowicz JR. Metal-enhanced fluorescence immunoassays using total internal reflection and silver island-coated surfaces. Anal Biochem. 2004;334(2):303–311. doi: 10.1016/j.ab.2004.08.034. [DOI] [PMC free article] [PubMed] [Google Scholar]
- 4.Matveeva EG, Gryczynski Z, Lakowicz JR. Myoglobin immunoassay based on metal particle-enhanced fluorescence. J Immunol Methods. 2005;302(1–2):26–35. doi: 10.1016/j.jim.2005.04.020. [DOI] [PMC free article] [PubMed] [Google Scholar]
- 5.Buschmann V, Weston KD, Sauer M. Spectroscopic study and evaluation of red-absorbing fluorescent dyes. Bioconjug Chem. 2003;14(1):195–204. doi: 10.1021/bc025600x. [DOI] [PubMed] [Google Scholar]
- 6.Oswald B, Patsenker L, Duschl J, Szmacinski H, Wolfbeis OS, Terpetschnig E. Synthesis, spectral properties, and detection limits of reactive squaraine dyes, a new class of diode laser compatible fluorescent protein labels. Bioconjug Chem. 1999;10(6):925–931. doi: 10.1021/bc9801023. [DOI] [PubMed] [Google Scholar]
- 7.Ioffe VM, Gorbenko GP, Kinnunen PK, Tatarets AL, Kolosova OS, Patsenker LD, Terpetschnig EA. Tracing lysozyme-lipid interactions with long-wavelength squaraine dyes. J Fluorescence. 2007;17(1):65–72. doi: 10.1007/s10895-006-0142-4. [DOI] [PubMed] [Google Scholar]
- 8.Brinkley M. A brief survey of methods for preparing protein conjugates with dyes, haptens, and cross-linking reagents. Bioconjug Chem. 1992;3(1):2–13. doi: 10.1021/bc00013a001. [DOI] [PubMed] [Google Scholar]
- 9.Haugland RP. Coupling of monoclonal antibodies with fluorophores. In: Davis WC, editor. Methods in Molecular Biology, Vol. 45: Monoclonal Antibody Protocols. Totowa, NJ: Humana Press; 1995. pp. 205–221. [DOI] [PubMed] [Google Scholar]
- 10.SETA Biomedicals brochure. http://www.setabiomedicals.com/products/K8/K8-1342.pdf.
- 11.SETA Biomedicals brochure. http://www.setabiomedicals.com/products/K8/K8-1669.pdf.
- 12.Ohline SM, Lee S, Williams S, Chang C. Quantification of methylene blue aggregation on a fused silica surface and resolution of individual absorbance spectra. Chem Phys Lett. 2001;346(1–2):9–15. [Google Scholar]
- 13.Antonov L, Gergov G, Petrov V, Kubista M, Nygren J. UV-Vis spectroscopic and chemometric study on the aggregation of ionic dyes in water. Talanta. 1999;49(1):99–106. doi: 10.1016/s0039-9140(98)00348-8. [DOI] [PubMed] [Google Scholar]
- 14.Mujumdar RB, Ernst LA, Mujumdar SR, Waggoner AS. Cyanine dye labeling reagents containing isothiocyanate groups. Cytometry. 1989;10(1):11–19. doi: 10.1002/cyto.990100104. [DOI] [PubMed] [Google Scholar]
- 15.Gruber HJ, Hahn CD, Kada G, Riener CK, Harms GS, Ahrer W, Dax TG, Knaus HG. Anomalous fluorescence enhancement of Cy3 and Cy3.5 versus anomalous fluorescence loss of Cy5 and Cy7 upon covalent linking to IgG and noncovalent binding to avidin. Bioconjug Chem. 2000;11(5):696–704. doi: 10.1021/bc000015m. [DOI] [PubMed] [Google Scholar]
- 16.Reddington MV. Synthesis and properties of phosphonic acid containing cyanine and squaraine dyes for use as fluorescent labels. Bioconjug Chem. 2007;18(6):2178–2190. doi: 10.1021/bc070090y. [DOI] [PubMed] [Google Scholar]
- 17.Southwick PL, Ernst LA, Tauriello EW, Parker SR, Mujumdar RB, Mujumdar SR, Clever HA, Waggoner AS. Cyanine dye labeling reagents -carboxymethylindocyanine succinimidyl esters. Cytometry. 1990;11(3):418–430. doi: 10.1002/cyto.990110313. [DOI] [PubMed] [Google Scholar]
- 18.Lakowicz JR. Principles of Fluorescence Spectroscopy. Chapters 25–26. Springer; Berlin: 2006. pp. 841–871. [Google Scholar]


