

Abstract
Background
We set out to identify common genetic determinants of the length of RR and QT intervals in 2,325 individuals from isolated European populations.
Methods and Results
We analyzed heart rate at rest, measured as RR interval, and length of corrected QT interval for association to 318,237 SNPs. RR interval was associated to common variants within GPR133, a G-Protein Coupled Receptor (rs885389, P = 3.9 × 10⁻⁸). QT interval was associated to the earlier reported NOS1AP gene (rs2880058, P = 2.00 × 10⁻¹⁰) and to a region on chromosome 13 (rs2478333, P = 4.34 × 10⁻⁸), which is 100 kb from the closest known transcript LOC730174 and has previously not been associated with length of QT interval.
Conclusion
Our results suggested association between RR interval and GPR133 and confirmed association between QT interval and NOS1AP.
Keywords: genetics, heart rate, population
Quantitative electrocardiographic (ECG) measurements have been shown to be valuable and non-invasive predictors of cardiovascular morbidity and mortality. In particular, increases in resting heart rate and in the length of QT interval have been associated with increases in cardiovascular risk.
Heart rate, often more accurately measured as the length in milliseconds of the RR interval (heart rate = 60,000/RR), is a well known risk factor for morbidity in cardiovascular disease1,2 and all-cause mortality.3 Heritability, linkage, and association studies have suggested that RR interval is modified by common genetic variations4,5 but no RR modifier variants have yet been consistently confirmed.
Cardiac repolarization can be strongly altered in Mendelian disorders due to mutations in genes coding for ion channels subunits as in both Long QT Syndrome (OMIM 192500) and Short QT Syndrome (OMIM 60962). Mildly increased QT intervals have also been associated with increased cardiovascular morbidity and mortality compared to QT intervals in the normal range.6,7 A QT modifying polymorphism near the NOS1AP gene has been identified and successfully replicated.8,9,10,11,12,13
To extend knowledge of genetic determinants of the length of QT and RR intervals we performed a genome-wide association (GWA) analysis on three isolated European populations and then pooled the results via a meta-analysis performed on data for 2,325 subjects.
We chose to focus on isolated populations because of the lower genetic heterogeneity and longer span of LD in isolated compared to outbred populations14,15 and the advantages these confer for the study of complex traits. In addition, isolated populations tend to show a lower level of environmental heterogeneity than the general population, which again can favor the identification of variants affecting complex traits, as shown in one of the three populations included in this meta-analysis.16
To fully investigate the contribution of isolated populations to gene mapping, a network comprising five centers involved in the study of isolated populations was established (European Special Population Research Network, EUROSPAN). Three of the participating study locations (Italy, Scotland and The Netherlands) had ECG measurements available, and their data were therefore included in the present work. We present here results from a meta-analysis of GWA scans performed on these three genetically isolated populations on the length of RR and QT intervals.
Methods
Genotypes and phenotypes
Genotypes were available for 1,175 subjects in the South Tyrolean population, 745 individuals from Orkney, and 800 in the population from the Netherlands. We genotyped 318,237 SNPs for each individual, using the Illumina 300 HumanHap SNP Chip. Subjects with genotypic call rate >97% were retained in the analysis. Patients with atrial fibrillation, pacemaker and defibrillator implants as well as pregnant women were excluded from the study.
We excluded from meta-analysis SNPs which in at least one of the study populations: i) had minor allele frequency (MAF) <0.01; ii) were out of Hardy-Weinberg equilibrium (p<10-3) or; iii) had a call rate <97%. All participants to each individual study gave informed consent. Individual studies were approved by the competent Ethics Committees.
South Tyrol, Italy
Subjects were sampled in the framework of the MICROS study, carried out in three isolated villages in Val Venosta (South Tyrol, Italy) in 2001-2003.17 Due to geographical, historical and political reasons, the entire region experienced prolonged isolation from surrounding populations. The investigated population is characterized by an old settlement, a small number of founders, high endogamy rates, slow or null population expansion and negligible immigration.18 Information on participant’s health status was collected through a standardized questionnaire and clinical examinations, including ECG measurements. 12-lead resting ECGs were recorded using a digital recording system (Mortara Portrait, Mortara, Milwakee, WI, USA). The Mortara portrait machine determines QT interval by the proprietary XL-ECG algorithm which has not been fully published but has shown to be in good accordance with other published ECG measurement algorithms.19 Laboratory data were obtained from standard blood analyses. Joint genotype and phenotype information was available for 970 subjects (409 men and 561 women).
Orkney Islands, Scotland (United Kingdom)
The Orkney Complex Disease Study (ORCADES) is an ongoing family-based cross-sectional study taking place in the isolated Scottish archipelago of Orkney. Genetic diversity is decreased compared to Mainland Scotland, consistent with the high levels of endogamy historically. Data from 745 participants aged 18-100 years from a subgroup of ten islands were used in this analysis. Blood samples were taken from fasting participants and over 200 health-related phenotypes and environmental exposures were measured in each individual. Digital 10 second ECGs were taken after at least 10 minutes supine rest, using a PC link with QT and RR intervals calculated using CardioView software (NUMED cardiac diagnostics, Sheffield, UK). Joint genotype and phenotype information was available for 679 subjects (315 men and 364 women).
Rucphen, the Netherlands
The Erasmus Rucphen Family (ERF) study was carried out on a Dutch isolated population located in the Southwest of the Netherlands.20 The population is characterized by rapid growth and minimal inward migration and has now expanded up to 20,000 inhabitants. Within this population, a specific subpopulation based on 20 couples (selected on the basis that they had at least 6 children baptized in the community church between 1850 and 1900) has been defined. All living descendants of the selected couples and their spouses (n≈3,000) have been recruited. All participants have been invited to the research center and were screened for quantitative traits, assessing cardiovascular, neuropsychiatric, endocrine, ophthalmologic and musculoskeletal functions. A 10 seconds 12-lead ECG (on average, 8 to 10 beats) was recorded with an ACTA-ECG (Esaote, Florence, Italy) with a sampling frequency of 500 Hz. All ECGs were processed by the Modular ECG Analysis System (MEANS) to obtain ECG measurement and interpretation. The MEANS determines common onsets and offsets for all 12 leads together on one representative averaged beat, with the use of template matching techniques, has been evaluated extensively and shown to have excellent correlation with diagnosis performed by cardiologists.21 Joint genotype and phenotype information was available for 676 subjects (252 men and 424 women).
Statistical analysis
Between population homogeneity of study variables was assessed with the Kruskal-Wallis rank sum test. To ensure a better adaptation of models residuals to normality, QT and RR were transformed to Normal distribution using rank transformation to normality. Multiple linear regression models were fitted to the normalized QT and RR, adjusting for age, sex, and RR, and age, sex and body mass index (BMI), respectively. Sex-stratified models were also estimated. GWA scans under an additive model were performed separately for each population. The genomic control method was used to correct the distribution of p-values which could be skewed in inbred populations.22,23
λ was estimated to be 1.6 in MICROS, 1.1 in ERF and 1.1 in Orkney. λ for the pooled sample was 1.3. Association analyses were performed using the R package GenABEL.24,25
Evidence from single studies was pooled together using a fixed effect meta-analysis based on inverse variance weighting.26 We set the global alpha for significance to 0.05. Under this constraint, using the Bonferroni correction based on the conservative assumption that the 318,237 tests performed were independent, the genome-wide significance threshold was defined as p≤1.57*10-7.
All locations on a physical map are referred to build 36 of the human genome reference map. LD was computed using the R package genetics,27 and plots obtained with the R package LDheatmap.28 All the analyses were performed using R.25
Results
Characteristics of each population sample are given in Table 1. There were significant differences between populations for all study variables (p<0.0001). The MICROS population was significantly younger than those from ERF (p<0.0001) and Orkney (p<0.0001), while mean ages for ERF and Orkney populations were not significantly different from each other (p=0.73). The Orkney sample had the highest BMI, whereas South Tyrol showed the lowest value; all pairwise tests were significantly different (p<0.001). The RR interval was shorter in the MICROS population than in ERF and Orkney samples, and all pairwise tests were significantly different; average heart rate (60,000/RR) for the three populations ranged from 60 (Orkney) to 67 (MICROS) beats per minute. QT interval was significantly longer in Orkney sample than in MICROS, while no significant difference in QT interval duration was detected in the remaining pairwise comparisons. Additional, aggregated data were available for larger cohorts recruited for each study (a subset of which was then genotyped). Such data include the prevalence of hypertension, diabetes, and myocardial infarction, together with information on the use of beta-blocking drugs. All the data are based on self-reporting. Data are shown as supplementary material (Table S-1).
Table 1.
Descriptive statistics of the three study populations
| Variable | MICROS | Orkney | ERF |
|---|---|---|---|
| N (% of males) | 970 (42%) | 679 (46%) | 676 (37%) |
| Age [years]; Mean (SD) | 45.3 (16.1) | 53.6 (15.7) | 53.5 (15.2) |
| BMI [kg/m2]; Mean (SD) | 25.48 (4.89) | 27.75 (4.85) | 26.93 (4.65) |
| RR interval [ms]; Mean (SD) | 898 (152) | 1009 (156) | 966 (159) |
| QT interval [ms]; Mean (SD) | 398 (29) | 410 (30) | 401 (30) |
ms = milliseconds; SD = Standard Deviation
Distribution of age, BMI, RR interval and QT interval were significantly different across studies, according to Kruskal-Wallis rank sum test.
RR interval
Table 2 shows population-specific and pooled results of the test of association between length of RR interval (after adjusting for age, sex and BMI) and the 25 SNPs with lowest p-values. For SNPs located within genes, gene names are reported as well. Two SNPs (rs885389 and rs1725789) located in the GPR133 gene on chromosome 12 exceeded the threshold of genome-wide significance (p=3.88*10-8 and 1.48*10-7, respectively). Two SNPs are located in FRMD4A, two in AKT3, and one in RASGRF1, but none of them are genome-wide significant. All of the above mentioned SNPs are intronic.
Table 2.
Summary of the SNPs most significantly associated to the length of RR interval
| MICROS | ORKNEY | ERF | POOLED | ||||||||||||
|---|---|---|---|---|---|---|---|---|---|---|---|---|---|---|---|
| Name | Chr | Position | MA | MAF | beta (se) |
p | MAF | beta (se) |
p | MAF | beta (se) |
p | beta (se) |
p | gene |
| rs885389 | 12 | 130187715 | A | 0.30 | -0.25 (0.05) |
0.0001 | 0.30 | -0.12 (0.06) |
0.0479 | 0.35 | -0.13 (0.06) |
0.0345 | -0.17 (0.03) |
3.88*10-8 | GPR133 |
| rs1725789 | 12 | 130175479 | G | 0.24 | -0.23 (0.05) |
0.0006 | 0.23 | -0.18 (0.06) |
0.0099 | 0.27 | -0.11 (0.06) |
0.0861 | -0.18 (0.03) |
1.48*10-7 | GPR133 |
| rs12554086 | 9 | 81997323 | A | 0.39 | -0.22 (0.05) |
0.0002 | 0.30 | -0.05 (0.06) |
0.3756 | 0.25 | -0.18 (0.06) |
0.0056 | -0.16 (0.03) |
3.59*10-7 | - |
| rs1024020 | 4 | 131357211 | A | 0.21 | 0.12 (0.06) |
0.0956 | 0.20 | 0.21 (0.07) |
0.0048 | 0.22 | 0.24 (0.06) |
0.0003 | 0.18 (0.04) |
4.34*10-7 | - |
| rs3117035 | 6 | 33194227 | A | 0.48 | -0.2 (0.04) |
0.0004 | 0.37 | -0.17 (0.06) |
0.0049 | 0.45 | -0.03 (0.06) |
0.5893 | -0.14 (0.03) |
1.10*10-6 | - |
| rs1541010 | 10 | 13795550 | A | 0.28 | 0.13 (0.05) |
0.0513 | 0.33 | 0.21 (0.06) |
0.0004 | 0.35 | 0.13 (0.06) |
0.0320 | 0.15 (0.03) |
1.11*10-6 | FRMD4A |
| rs10514995 | 5 | 65775195 | G | 0.36 | 0.13 (0.05) |
0.0359 | 0.31 | 0.12 (0.06) |
0.0660 | 0.40 | 0.21 (0.06) |
0.0003 | 0.15 (0.03) |
1.12*10-6 | - |
| rs2717128 | 18 | 73116620 | G | 0.14 | -0.26 (0.06) |
0.0019 | 0.13 | -0.23 (0.08) |
0.0072 | 0.24 | -0.1 (0.06) |
0.1070 | -0.19 (0.04) |
1.17*10-6 | - |
| rs7318731 | 13 | 21607670 | A | 0.48 | -0.09 (0.04) |
0.1147 | 0.46 | -0.19 (0.05) |
0.0007 | 0.42 | -0.16 (0.05) |
0.0045 | -0.14 (0.03) |
1.24*10-6 | - |
| rs3743200 | 15 | 77061101 | A | 0.27 | 0.15 (0.05) |
0.0214 | 0.27 | 0.21 (0.06) |
0.0014 | 0.23 | 0.13 (0.06) |
0.0648 | 0.16 (0.03) |
1.54*10-6 | RASGRF1 |
| rs4352210 | 2 | 37604484 | A | 0.37 | -0.19 (0.05) |
0.0020 | 0.47 | -0.2 (0.06) |
0.0007 | 0.44 | -0.04 (0.05) |
0.5208 | -0.14 (0.03) |
1.55*10-6 | - |
| rs1317632 | 5 | 65782224 | A | 0.33 | 0.13 (0.05) |
0.0429 | 0.28 | 0.13 (0.06) |
0.0401 | 0.38 | 0.19 (0.06) |
0.0010 | 0.15 (0.03) |
1.99*10-6 | - |
| rs1484948 | 11 | 41809240 | G | 0.32 | 0.16 (0.05) |
0.0095 | 0.23 | 0.23 (0.06) |
0.0006 | 0.23 | 0.07 (0.07) |
0.2878 | 0.16 (0.03) |
2.13*10-6 | - |
| rs2670321 | 3 | 100649797 | C | 0.27 | -0.25 (0.05) |
0.0001 | 0.31 | -0.13 (0.06) |
0.0341 | 0.35 | -0.05 (0.06) |
0.3857 | -0.16 (0.03) |
2.21*10-6 | - |
| rs12552736 | 9 | 25439122 | G | 0.06 | 0.28 (0.1) |
0.0223 | 0.09 | 0.13 (0.1) |
0.2013 | 0.12 | 0.32 (0.08) |
0.0003 | 0.25 (0.05) |
2.25*10-6 | - |
| rs4132509 | 1 | 242009707 | A | 0.21 | -0.18 (0.06) |
0.0104 | 0.19 | -0.09 (0.07) |
0.2325 | 0.18 | -0.26 (0.07) |
0.0005 | -0.18 (0.04) |
2.28*10-6 | AKT3 |
| rs1329554 | 9 | 82010698 | A | 0.37 | -0.18 (0.05) |
0.0034 | 0.28 | -0.06 (0.06) |
0.3076 | 0.25 | -0.2 (0.06) |
0.0023 | -0.15 (0.03) |
2.32*10-6 | - |
| rs17706439 | 1 | 211922211 | A | 0.17 | 0.17 (0.06) |
0.0232 | 0.14 | 0.27 (0.08) |
0.0014 | 0.19 | 0.13 (0.07) |
0.0705 | 0.18 (0.04) |
3.07*10-6 | - |
| rs2015015 | 10 | 13806698 | A | 0.33 | 0.1 (0.05) |
0.1115 | 0.37 | 0.17 (0.06) |
0.0044 | 0.38 | 0.18 (0.06) |
0.0036 | 0.14 (0.03) |
3.74*10-6 | FRMD4A |
| rs10496166 | 2 | 68917413 | A | 0.13 | 0.29 (0.07) |
0.0007 | 0.20 | 0.1 (0.07) |
0.1805 | 0.17 | 0.16 (0.07) |
0.0380 | 0.18 (0.04) |
3.99*10-6 | - |
| rs3110127 | 8 | 60292850 | A | 0.33 | -0.18 (0.05) |
0.0037 | 0.31 | -0.03 (0.06) |
0.6934 | 0.33 | -0.21 (0.06) |
0.0005 | -0.15 (0.03) |
4.07*10-6 | - |
| rs1447537 | 2 | 84100097 | A | 0.31 | -0.18 (0.05) |
0.0056 | 0.24 | -0.1 (0.06) |
0.1415 | 0.33 | -0.15 (0.06) |
0.0119 | -0.15 (0.03) |
4.11*10-6 | - |
| rs13300284 | 9 | 25442812 | A | 0.04 | 0.4 (0.12) |
0.0075 | 0.08 | 0.17 (0.1) |
0.1310 | 0.10 | 0.26 (0.09) |
0.0043 | 0.26 (0.06) |
4.34*10-6 | - |
| rs744016 | 22 | 25372106 | A | 0.20 | -0.21 (0.06) |
0.0043 | 0.15 | -0.2 (0.07) |
0.0094 | 0.17 | -0.09 (0.07) |
0.2264 | -0.17 (0.04) |
4.75*10-6 | - |
| rs2125230 | 1 | 241952471 | A | 0.21 | -0.18 (0.06) |
0.0124 | 0.19 | -0.07 (0.07) |
0.3226 | 0.18 | -0.27 (0.07) |
0.0005 | -0.17 (0.04) |
4.93*10-6 | AKT3 |
name: SNP name; chr: chromosome; position: position in basepair (bp); MA: minor allele (for the top 25 SNPs minor alleles were the same in the three populations), MAF: Minor Allele Frequency; beta(se): SNP effect size and standard error; p: p-value for association; gene: gene in which the SNP is located.
Figure 1 shows a detailed view of all SNPs present in GPR133. Boundaries of GPR133 are shown as dotted vertical lines. Lack of significant association is evident for most of the gene sequence, with the exception of the 3′ portion of the gene with the two SNPs reaching genome-wide significance and two more SNPs that emerged from background noise.
Figure 1.
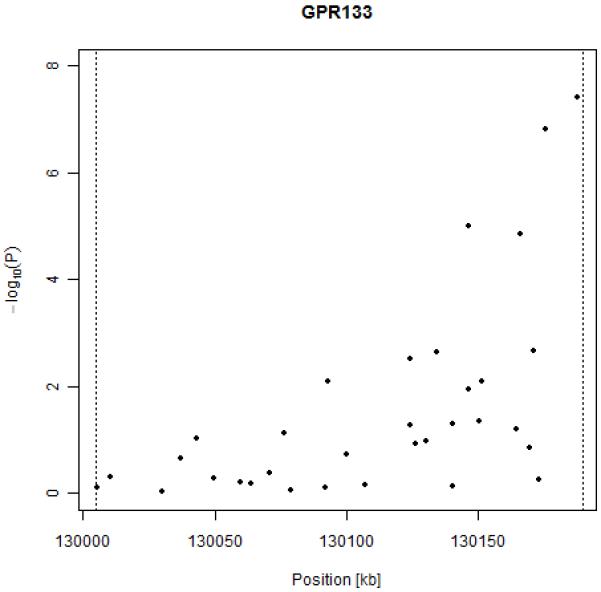
Results of association between RR interval and SNPs in the GPR133 gene.
The rare allele of both SNPs is associated with a shortening of the length of RR interval (and increased heart rate). For SNP rs885389, each risk allele confers a decrease of 14 ms in the length of RR interval, while for SNP rs1725789 each risk allele causes a decrease of 16 ms; this roughly corresponds to an increase of 1 beat per minute per risk allele in terms of heart rate.
A figure showing results genome-wide is available as supplementary material (Figure S-1). A graph of LD structure in GPR133 in each population is available as supplementary material (Figure S-2). While no strong LD blocks were detected, the two genome-wide significant SNPs are in strong LD (r2=0.68 in MICROS and Orkney, r2=0.69 in ERF).
When analyzing the data from men separately, one SNP on chromosome 1 reached genome-wide significance (rs17706439, p=2.82*10-8), but it was not in proximity (<100kb) to any known gene. No SNPs in GPR133 reached significance. In the analysis of the data from women, we found two genome-wide significant SNPs; one on chromosome 7 (rs1874326, p=9.79*10-8) and one on chromosome X (rs4610880, p= 1.44*10-7). rs1874326 is located in the TRIM24 gene, known to mediate transcriptional control; rs4610880 is located in the open reading frame CXorf36. No SNPs in GPR133 were significant in women alone.
QT interval
The 25 SNPs with lowest p-values after meta-analysis, sorted by ascending p-value, are reported in Table 3 (for a graph of the genome wide association scan see supplementary Figure S-3). Five SNPs located in or around NOS1AP reached genome-wide significance. The most significant SNP (rs2880058, p=2*10-10) was located 25kb upstream of NOS1AP. A genome-wide significant result was also observed for rs10494366, through which the association between QT and NOS1AP polymorphisms was first identified.8 Association results in NOS1AP gene are shown in Figure 2. LD structure in NOS1AP gene is available as supplementary material (Figure S-4).
Table 3.
Summary of the SNPs most significantly associated to the length of QT interval
| MICROS | ORKNEY | ERF | POOLED | ||||||||||||
|---|---|---|---|---|---|---|---|---|---|---|---|---|---|---|---|
| Name | Chr | Position | MA | MAF | beta (se) |
p | MAF | beta (se) |
p | MAF | beta (se) |
p | beta (se) |
p | gene |
| rs2880058 | 1 | 160281256 | G | 0.32 | 0.25 (0.05) |
6.96*10-6 | 0.35 | 0.12 (0.06) |
0.0443 | 0.44 | 0.19 (0.06) |
0.0023 | 0.19 (0.03) |
2.00*10-10 | - |
| rs6670339 | 1 | 160322430 | G | 0.34 | 0.24 (0.05) |
2.01*10-5 | 0.34 | 0.09 (0.06) |
0.1255 | 0.45 | 0.16 (0.05) |
0.0065 | 0.17 (0.03) |
1.03*10-8 | NOS1AP |
| rs2478333 | 13 | 47060559 | A | 0.33 | 0.22 (0.05) |
0.0001 | 0.37 | 0.19 (0.06) |
0.0013 | 0.33 | 0.08 (0.06) |
0.1995 | 0.17 (0.03) |
4.34*10-8 | - |
| rs10494366 | 1 | 160352309 | C | 0.35 | 0.21 (0.05) |
0.0001 | 0.35 | 0.12 (0.06) |
0.0453 | 0.49 | 0.13 (0.05) |
0.0282 | 0.16 (0.03) |
8.72*10-8 | NOS1AP |
| rs4657140 | 1 | 160327889 | A | 0.35 | 0.21 (0.05) |
0.0001 | 0.35 | 0.12 (0.06) |
0.0496 | 0.49 | 0.13 (0.05) |
0.0282 | 0.16 (0.03) |
9.38*10-8 | NOS1AP |
| rs1415259 | 1 | 160351933 | G | 0.35 | 0.21 (0.05) |
0.0001 | 0.35 | 0.12 (0.06) |
0.0496 | 0.49 | 0.13 (0.05) |
0.0282 | 0.16 (0.03) |
9.38*10-8 | NOS1AP |
| rs4656349 | 1 | 160316448 | G | 0.33 | 0.24 (0.05) |
2.77*10-5 | 0.29 | 0.06 (0.06) |
0.3310 | 0.42 | 0.15 (0.05) |
0.0140 | 0.16 (0.03) |
1.74*10-7 | NOS1AP |
| rs8015016 | 14 | 95192161 | G | 0.20 | -0.2 (0.06) |
0.0023 | 0.21 | -0.21 (0.07) |
0.0045 | 0.19 | -0.13 (0.07) |
0.0765 | -0.18 (0.04) |
5.27*10-7 | TCL6 |
| rs1172416 | 13 | 47119744 | G | 0.30 | 0.15 (0.05) |
0.0130 | 0.30 | 0.19 (0.06) |
0.0023 | 0.25 | 0.16 (0.06) |
0.0262 | 0.16 (0.03) |
5.80*10-7 | - |
| rs6845865 | 4 | 149194052 | G | 0.21 | 0.2 (0.05) |
0.0020 | 0.10 | 0.19 (0.09) |
0.0635 | 0.23 | 0.17 (0.06) |
0.0121 | 0.19 (0.04) |
6.84*10-7 | ARHGAP10 |
| rs789852 | 3 | 195808387 | A | 0.08 | 0.39 (0.08) |
5.37*10-5 | 0.07 | 0.19 (0.11) |
0.0930 | 0.11 | 0.15 (0.08) |
0.0884 | 0.25 (0.05) |
6.91*10-7 | LOC100132805 |
| rs652889 | 3 | 61769094 | A | 0.36 | -0.07 (0.05) |
0.2391 | 0.26 | -0.23 (0.06) |
0.0006 | 0.46 | -0.2 (0.05) |
0.0005 | -0.15 (0.03) |
7.46*10-7 | PTPRG |
| rs4318720 | 4 | 118551703 | A | 0.09 | 0.26 (0.08) |
0.0028 | 0.06 | 0.32 (0.12) |
0.0120 | 0.05 | 0.27 (0.12) |
0.0455 | 0.28 (0.06) |
8.11*10-7 | - |
| rs7728043 | 5 | 5950694 | G | 0.48 | -0.18 (0.04) |
0.0004 | 0.41 | -0.1 (0.06) |
0.1170 | 0.41 | -0.13 (0.05) |
0.0281 | -0.14 (0.03) |
1.03*10-6 | - |
| rs2650951 | 3 | 123851037 | A | 0.05 | -0.45 (0.1) |
5.74*10-5 | 0.03 | 0.06 (0.15) |
0.7143 | 0.10 | -0.27 (0.09) |
0.0052 | -0.29 (0.06) |
1.09*10-6 | - |
| rs1348582 | 12 | 20423023 | G | 0.18 | 0.24 (0.06) |
0.0005 | 0.18 | 0.11 (0.07) |
0.1458 | 0.07 | 0.27 (0.1) |
0.0178 | 0.2 (0.04) |
1.42*10-6 | PDE3A |
| rs12476289 | 2 | 179350220 | A | 0.07 | 0.27 (0.08) |
0.0056 | 0.03 | 0.42 (0.16) |
0.0139 | 0.06 | 0.26 (0.11) |
0.0224 | 0.29 (0.06) |
1.51*10-6 | TTN |
| rs1150461 | 5 | 5964381 | A | 0.40 | -0.17 (0.05) |
0.0010 | 0.36 | -0.12 (0.06) |
0.0448 | 0.36 | -0.12 (0.06) |
0.0575 | -0.14 (0.03) |
1.65*10-6 | - |
| rs10488031 | 7 | 37043379 | A | 0.07 | -0.25 (0.09) |
0.0141 | 0.10 | -0.35 (0.09) |
0.0003 | 0.06 | -0.14 (0.11) |
0.2695 | -0.26 (0.05) |
1.97*10-6 | ELMO1 |
| rs1932933 | 1 | 160384670 | A | 0.33 | 0.2 (0.05) |
0.0004 | 0.38 | 0.14 (0.05) |
0.0209 | 0.48 | 0.08 (0.05) |
0.1794 | 0.14 (0.03) |
1.99*10-6 | NOS1AP |
| rs1533317 | 4 | 35087026 | A | 0.46 | 0.12 (0.05) |
0.0225 | 0.49 | 0.14 (0.05) |
0.0174 | 0.46 | 0.15 (0.05) |
0.0062 | 0.14 (0.03) |
2.00*10-6 | - |
| rs7523798 | 1 | 160413455 | G | 0.42 | 0.17 (0.05) |
0.0016 | 0.35 | 0.15 (0.06) |
0.0157 | 0.32 | 0.1 (0.06) |
0.1206 | 0.14 (0.03) |
2.09*10-6 | NOS1AP |
| rs2562829 | 2 | 179312611 | C | 0.07 | 0.28 (0.08) |
0.0039 | 0.02 | 0.41 (0.17) |
0.0241 | 0.07 | 0.25 (0.1) |
0.0310 | 0.28 (0.06) |
2.27*10-6 | TTN |
| rs11723116 | 4 | 118500818 | A | 0.18 | 0.18 (0.06) |
0.0053 | 0.19 | 0.22 (0.07) |
0.0024 | 0.18 | 0.1 (0.07) |
0.1766 | 0.17 (0.04) |
2.46*10-6 | - |
| rs7601713 | 2 | 157261106 | A | 0.23 | -0.16 (0.05) |
0.0146 | 0.27 | -0.18 (0.06) |
0.0052 | 0.19 | -0.15 (0.07) |
0.0439 | -0.16 (0.03) |
2.49*10-6 | - |
name; chr: chromosome; position: position in basepair (bp); MA: minor allele (for the top 25 SNPs minor alleles were the same in the three populations), MAF: Minor Allele Frequency; beta(se): SNP effect size and standard error; p: p-value for association; gene: gene in which the SNP is located.
Figure 2.
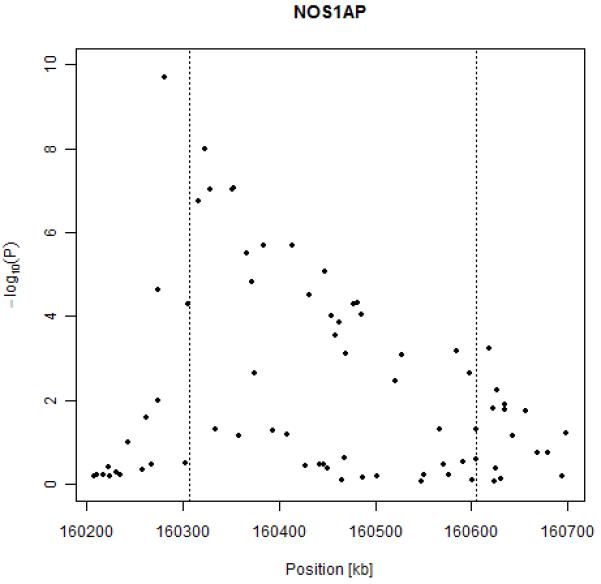
Results of association between QT interval and SNPs in the NOS1AP gene.
One SNP on chromosome 13 was also above the genome-wide threshold for significance (rs2478333, p=4.34*10-8). It is located more than 100 kb from the closest putative locus (LOC730174) and 300kb from the nearest known gene, succinate-CoA-ligase (SUCLA2).
In the meta-analysis performed on the female subsample (n=1,349) we identified two SNPs achieving genome-wide significance, rs2880058 (p= 1.03*10-9) and rs6670339 (p=1.24*10-7); both of them are in or around NOS1AP and also reached genome-wide significance in the pooled analysis (Table 3). When analyzing the male subsample (n=976), we did not identify any genome-wide significant hits.
Discussion
Meta-analysis of GWA scans for RR interval allowed us to identify two SNPs reaching genome-wide significance, located in the gene GPR133.
To the best of our knowledge, only one previous GWA study was performed to investigate the genetic contribution to the length of RR interval,29 without identifying any genome-wide significant signals. The authors made results available through the dbGAP database; however, we were not able to compare the region in which we found the strongest signal, since the published results lack SNPs between 129,840,347 bp and 130,588,160 bp, with GPR133 spanning 130,004,790 bp to 130,189,786 bp (distances of the closest SNPs to GPR133 being about 160 and 400 kb, respectively).
Ours is the first study to identify significant SNPs associated with the length of RR interval. Two SNPs reached genome-wide significance, rs885389 and rs1725789. These are located in the 3′ region of GPR133 and are in strong but not complete LD.
We replicated association of NOS1AP to the length of QT interval adjusted for age, sex and RR interval. Additional confounding factors, such as QT prolonging drugs and cardiovascular disease status were not included in the analysis. Both previous studies8 and our results consistently identified association between SNPs in the 5′ region of NOS1AP and upstream of NOS1AP coding sequence, and the length of QT interval. In addition, we identified a genome-wide significant hit with SNP rs2478333. This SNP is located more than 100kb from the closest putative locus and 300kb from the nearest characterized gene. Our findings on the genetic determinants of the length of QT interval allow us to verify the importance of NOS1AP and to identify a single SNP on chromosome 13 reaching genome-wide significance although far away from any known gene.
One limitation of the present study is the lack of independent replication. In addition, functional demonstration of the effect of GPR133 on RR interval and of NOS1AP on QT interval still needs to be provided.
GPR133 is a gene coding for a G-Protein Coupled Receptor (GPCR).30. Expression data retrieved on Gene Expression Omnibus (GEO) showed that GPR133 is expressed in atria, ventricles, and septal myocardial tissue (GEO accession numbers: GDS651, GDS1557, GDS1559 and GDS2206).
At present, GPCRs belonging to the rhodopsin GPCR family, in particular adrenergic receptors, have been extensively studied for their influence on heart activity and widely used as pharmacological targets.31
We undertook a search of an available database (GLIDA) of GPCRs and their ligands in order to better characterize GPR133.32 We performed a similarity search (based on sequence), to identify GPCRs which could have structural similarities with GPR133. Among GPCRs stored in the GLIDA database, those demonstrating the highest similarity were ELTD1, CELSR1, EMR1 and LPHN1. Several members of the families of cadherins, latrophilins and ETL receptors were shown as being similar to GPR133. Previous work showed that ELTD1 (previous name, ETL) is developmentally regulated in heart.33 We checked for association of ELTD1, CELSR1, EMR1 and LPHN1 with the length of RR interval, but found no evidence of association; no p-value <10-4 was identified in any of the genes or in the regions 100kb up- and downstream. In conclusion, we propose a role for GPR133 in affecting the length of electrocardiographic RR interval and heart rate. Beta-adrenergic receptors are members of GPCRs targeted by beta-blockers drugs for the management of cardiac arrhythmias; GPR133 could therefore represent an ideal novel target for a pharmacological approach. Assigning a ligand to this orphan receptor and identifying the causal variant are among the priorities to confirm a role of GPR133 in determining heart rate.
Acknowledgments
We owe a debt of gratitude to all participants of MICROS, ERF and ORCADES studies.
For the MICROS study in South Tyrol, we thank the primary care practitioners Raffaela Stocker, Stefan Waldner, Toni Pizzecco, Josef Plangger, Ugo Marcadent and the personnel of the Hospital of Silandro (Department of Laboratory Medicine) for their participation and collaboration in the research project. We would like to thank Matthias Wjst for contributing to the paper with useful discussion, and Daniela Grazio for valuable help in collecting data.
For the ORCADES study, we would like to acknowledge the invaluable contributions of Lorraine Anderson and the research nurses in Orkney and the administrative team in Edinburgh.
Funding sources
EUROSPAN (European Special Populations Research Network) was supported by European Commission FP6 STRP grant number 018947 (LSHG-CT-2006-01947).
I. R. is supported by the grant 108-1080315-0302 from the Croatian Ministry of Science, Education and Sport.
MICROS study was supported by the Ministry of Health of the Autonomous Province of Bolzano and the South Tyrolean Sparkasse Foundation.
The ORCADES study was supported by the Scottish Executive Health Department, the Royal Society and the Wellcome Trust Clinical Research Facility.
The ERF study was supported by grants from the Netherlands Organization for Scientific Research (NWO, 91203014), the Russian Foundation for Basic Research (NWO-RFBR, 047.017.043), and the Center of Medical Systems Biology (CMSB).
Footnotes
Conflict of interest disclosures
CM van Duijn received grants from the Center of Medical Systems Biology and from Netherlands Genomics Initiative.
Electronic Databases
The URLs for data presented herein are as follows:
Online Mendelian Inheritance in Man (OMIM), http://ww.ncbi.nlm.nih.gov/omim
A catalog of published genome-wide association scans, http://www.genome.gov/26525384
dbGAP: repository of results of previous GWA scans, http://www.ncbi.nlm.nih.gov/sites/entrez?Db=gap)
dbSNP: SNP database, http://www.ncbi.nlm.nih.gov/SNP/)
GLIDA, GPCR--ligand database, http://pharminfo.pharm.kyoto-u.ac.jp/services/glida/
GEO home page for GPR133 expression data: http://www.ncbi.nlm.nih.gov/geo/
*ABEL software for the analysis of GWA scans: http://mga.bionet.nsc.ru/~yurii/ABEL/
Home page of the EUROSPAN project, http://homepages.ed.ac.uk/s0565445/index.html
Marroni: GWA scan of RR and QT interval.
References
- 1.Dyer AR, Persky V, Stamler J, Paul O, Shekelle RB, Berkson DM, Lepper M, Schoenberger JA, Lindberg HA. Heart rate as a prognostic factor for coronary heart disease and mortality: findings in three Chicago epidemiologic studies. Am J Epidemiol. 1980;112:736–749. doi: 10.1093/oxfordjournals.aje.a113046. [DOI] [PubMed] [Google Scholar]
- 2.Fox K, Borer JS, Camm AJ, Danchin N, Ferrari R, Lopez Sendon JL, Steg PG, Tardif JC, Tavazzi L, Tendera M. Heart Rate Working Group. Resting heart rate in cardiovascular disease. J Am Coll Cardiol. 2007;50:823–830. doi: 10.1016/j.jacc.2007.04.079. [DOI] [PubMed] [Google Scholar]
- 3.Kristal-Boneh E, Silber H, Harari G, Froom P. The association of resting heart rate with cardiovascular, cancer and all-cause mortality. Eight year follow-up of 3527 male Israeli employees (the CORDIS Study) Eur Heart J. 2000;21:116–124. doi: 10.1053/euhj.1999.1741. [DOI] [PubMed] [Google Scholar]
- 4.Singh JP, Larson MG, O’Donnell CJ, Tsuji H, Evans JC, Levy D. Heritability of heart rate variability: the Framingham Heart Study. Circulation. 1999;99:2251–2254. doi: 10.1161/01.cir.99.17.2251. [DOI] [PubMed] [Google Scholar]
- 5.Laramie JM, Wilk JB, Hunt SC, Ellison RC, Chakravarti A, Boerwinkle E, Myers RH. Evidence for a gene influencing heart rate on chromosome 5p13-14 in a meta-analysis of genome-wide scans from the NHLBI Family Blood Pressure Program. BMC Med Genet. 2006;7:17. doi: 10.1186/1471-2350-7-17. [DOI] [PMC free article] [PubMed] [Google Scholar]
- 6.Elming H, Holm E, Jun L, Torp-Pedersen C, Kober L, Kircshoff M, Malik M, Camm J. The prognostic value of the QT interval and QT interval dispersion in all-cause and cardiac mortality and morbidity in a population of Danish citizens. Eur Heart J. 1998;19:1391–1400. doi: 10.1053/euhj.1998.1094. [DOI] [PubMed] [Google Scholar]
- 7.Okin PM, Devereux RB, Howard BV, Fabsitz RR, Lee ET, Welty TK. Assessment of QT interval and QT dispersion for prediction of all-cause and cardiovascular mortality in American Indians: The Strong Heart Study. Circulation. 2000;101:61–66. doi: 10.1161/01.cir.101.1.61. [DOI] [PubMed] [Google Scholar]
- 8.Arking DE, Pfeufer A, Post W, Kao WH, Newton-Cheh C, Ikeda M, West K, Kashuk C, Akyol M, Perz S, Jalilzadeh S, Illig T, Gieger C, Guo CY, Larson MG, Wichmann HE, Marbán E, O’Donnell CJ, Hirschhorn JN, Kääb S, Spooner PM, Meitinger T, Chakravarti A. A common genetic variant in the NOS1 regulator NOS1AP modulates cardiac repolarization. Nat Genet. 2006;38:644–651. doi: 10.1038/ng1790. [DOI] [PubMed] [Google Scholar]
- 9.Post W, Shen H, Damcott C, Arking DE, Kao WH, Sack PA, Ryan KA, Chakravarti A, Mitchell BD, Shuldiner AR. Associations between genetic variants in the NOS1AP (CAPON) gene and cardiac repolarization in the old order Amish. Hum Hered. 2007;64:214–219. doi: 10.1159/000103630. [DOI] [PMC free article] [PubMed] [Google Scholar]
- 10.Raitakari OT, Blom-Nyholm J, Koskinen TA, Kahonen M, Viikari JS, Lehtimaki T. Common variation in NOS1AP and KCNH2 genes and QT interval duration in young adults. The Cardiovascular Risk in Young Finns Study. Ann Med. 2008;10:1–8. doi: 10.1080/07853890802392529. [DOI] [PubMed] [Google Scholar]
- 11.Tobin MD, Kähönen M, Braund P, Nieminen T, Hajat C, Tomaszewski M, Viik J, Lehtinen R, Ng GA, Macfarlane PW, Burton PR, Lehtimäki T, Samani NJ. Gender and effects of a common genetic variant in the NOS1 regulator NOS1AP on cardiac repolarization in 3761 individuals from two independent populations. Int J Epidemiol. 2008;37:1132–41. doi: 10.1093/ije/dyn091. [DOI] [PubMed] [Google Scholar]
- 12.Pfeufer A, Sanna S, Arking DE, Müller M, Gateva V, Fuchsberger C, Ehret GB, Orrú M, Pattaro C, Köttgen A, Perz S, Usala G, Barbalic M, Li M, Pütz B, Scuteri A, Prineas RJ, Sinner MF, Happle C, Gieger C, Najjar SS, Kao WHL, Mühleisen TW, Dei M, Möhlenkamp S, Crisponi L, Erbel R, Jöckel KH, Naitza S, Steinbeck G, Marroni F, Hicks AA, Lakatta E, Müller-Myhsok B, Pramstaller PP, Wichmann HE, Schlessinger D, Boerwinkle E, Meitinger T, Uda M, Coresh J, Kääb S, Abecasis GR, Chakravarti A. Common variants at ten loci modulate the QT interval duration in individuals of European ancestry: the QTSCD consortium. Nat Genet. 2009 doi: 10.1038/ng.362. in press. [DOI] [PMC free article] [PubMed] [Google Scholar]
- 13.Newton-Cheh C, Eijgelsheim M, Rice KM, de Bakker PI, Yin X, Estrada K, Bis JC, Marciante K, Rivadeneira F, Noseworthy PA, Sotoodehnia N, Smith NL, Rotter JI, Kors JA, Witteman JCM, Hofman A, Heckbert SR, O’Donnell CJ, Uitterlinden AG, Psaty BM, Lumley T, Larson MG, Stricker BH. Common variants at ten loci influence QT interval duration in the QTGEN study. Nat Genet. 2009 doi: 10.1038/ng.364. in press. [DOI] [PMC free article] [PubMed] [Google Scholar]
- 14.Marroni F, Pichler I, De Grandi A, Beu Volpato C, Vogl FD, Pinggera GK, Bailey-Wilson JE, Pramstaller PP. Population isolates in South Tyrol and their value for genetic dissection of complex diseases. Ann Hum Genet. 2006;70:812–821. doi: 10.1111/j.1469-1809.2006.00274.x. [DOI] [PubMed] [Google Scholar]
- 15.Peltonen L. Positional cloning of disease genes: advantages of genetic isolates. Hum Hered. 2000;50:66–75. doi: 10.1159/000022892. [DOI] [PubMed] [Google Scholar]
- 16.Marroni F, Grazio D, Pattaro C, Devoto M, Pramstaller P. Estimates of genetic and environmental contribution to 43 quantitative traits support sharing of a homogeneous environment in an isolated population from South Tyrol, Italy. Hum Hered. 2008;65:175–182. doi: 10.1159/000109734. [DOI] [PubMed] [Google Scholar]
- 17.Pattaro C, Marroni F, Riegler A, Mascalzoni D, Pichler I, Volpato CB, Dal Cero U, De Grandi A, Egger C, Eisendle A, Fuchsberger C, Gögele M, Pedrotti S, Pinggera GK, Stefanov SA, Vogl FD, Wiedermann CJ, Meitinger T, Pramstaller PP. The genetic study of three population microisolates in South Tyrol (MICROS): study design and epidemiological perspectives. BMC Med Genet. 2007;8:29. doi: 10.1186/1471-2350-8-29. [DOI] [PMC free article] [PubMed] [Google Scholar]
- 18.Riegler A, Marroni F, Pattaro C, Gueresi P, Pramstaller PP. Isolation and marriage patterns in four South Tyrolean villages (Italy) during the nineteenth century. J Biosoc Sci. 2008;40:787–791. doi: 10.1017/s0021932007002568. [DOI] [PubMed] [Google Scholar]
- 19.Michelucci A, Mortara D, Lazzeri C, Barletta G, Capalbo A, Badia T, Del Bene R, Bano C, Gensini GF, Franchi F. Simultaneous assessment of electrocardiographic parameters for risk stratification: validation in healthy subjects. Italian heart journal: official journal of the Italian Federation of Cardiology. 2002;3:308–317. [PubMed] [Google Scholar]
- 20.Pardo LM, MacKay I, Oostra B, van Duijn CM, Aulchenko YS. The effect of genetic drift in a young genetically isolated population. Ann Hum Genet. 2005;69:288–295. doi: 10.1046/j.1529-8817.2005.00162.x. [DOI] [PubMed] [Google Scholar]
- 21.de Bruyne MC, Kors JA, Hoes AW, Kruijssen DA, Deckers JW, Grosfeld M, van Herpen G, Grobbee DE, van Bemmel JH. Diagnostic interpretation of electrocardiograms in population-based research: computer program research physicians, or cardiologists? J Clin Epidemiol. 1997;50:947–952. doi: 10.1016/s0895-4356(97)00100-5. [DOI] [PubMed] [Google Scholar]
- 22.Amin N, van Duijn CM, Aulchenko YS. A genomic background based method for association analysis in related individuals. PLoS One. 2007;2:e1274. doi: 10.1371/journal.pone.0001274. [DOI] [PMC free article] [PubMed] [Google Scholar]
- 23.Devlin B, Roeder K. Genomic control for association studies. Biometrics. 1999;55:997–1004. doi: 10.1111/j.0006-341x.1999.00997.x. [DOI] [PubMed] [Google Scholar]
- 24.Aulchenko YS, Ripke S, Isaacs A, van Duijn CM. GenABEL: an R library for genome-wide association analysis. Bioinformatics. 2007;23:1294–1296. doi: 10.1093/bioinformatics/btm108. [DOI] [PubMed] [Google Scholar]
- 25.R Development Core Team . R: A language and environment for statistical computing. R Foundation for Statistical Computing; Vienna, Austria: 2008. ISBN 3-900051-07-0, URL http://www.R-project.org. [Google Scholar]
- 26.Woodward M. Epidemiology: Study Designs and Data Analysis (Boca Raton. Chapman & Hall/CRC); London, New York, Washington DC: 2005. [Google Scholar]
- 27.Gregory Warnes, with contributions from Gregor Gorjanc, Friedrich Leisch and and Michael Man., genetics: Population Genetics. 2008. [Google Scholar]
- 28.Shin JH, Blay S, McNeney B, Graham J. LDheatmap: An R Function for Graphical Display of Pairwise Linkage Disequilibria Between Single Nucleotide Polymorphisms. J Stat Soft. 2006 Code Snippet:3. [Google Scholar]
- 29.Newton-Cheh C, Guo CY, Wang TJ, O’donnell CJ, Levy D, Larson MG. Genome-wide association study of electrocardiographic and heart rate variability traits: the Framingham Heart Study. BMC Med Genet. 2007;8(Suppl1):S7. doi: 10.1186/1471-2350-8-S1-S7. [DOI] [PMC free article] [PubMed] [Google Scholar]
- 30.Vanti WB, Nguyen T, Cheng R, Lynch KR, George SR, O’Dowd BF. Novel human G-protein-coupled receptors. Biochem Biophys Res Commun. 2003;305:67–71. doi: 10.1016/s0006-291x(03)00709-5. [DOI] [PubMed] [Google Scholar]
- 31.Salazar NC, Chen J, Rockman HA. Cardiac GPCRs: GPCR signaling in healthy and failing hearts. Biochim Biophys Acta. 2007;1768:1006–18. doi: 10.1016/j.bbamem.2007.02.010. [DOI] [PMC free article] [PubMed] [Google Scholar]
- 32.Okuno Y, Tamon A, Yabuuchi H, Niijima S, Minowa Y, Tonomura K, Kunimoto R, Feng C. GLIDA: GPCR--ligand database for chemical genomics drug discovery--database and tools update. Nucleic Acids Res. 2008;36:D907–D912. doi: 10.1093/nar/gkm948. [DOI] [PMC free article] [PubMed] [Google Scholar]
- 33.Nechiporuk T, Urness LD, Keating MT. ETL, a novel seven-transmembrane receptor that is developmentally regulated in the heart. ETL is a member of the secretin family and belongs to the epidermal growth factor-seven-transmembrane subfamily. J Biol Chem. 2001;276:4150–4157. doi: 10.1074/jbc.M004814200. [DOI] [PubMed] [Google Scholar]