Abstract
The viscoelastic characteristics of thermal lesions in ex vivo animal liver are investigated in this paper. Characterization of the moduli of thermal lesions prepared at several temperatures will provide additional information for the elastographic monitoring of radio frequency ablation of hepatic tumors. In this study, the frequency-dependent complex modulus of thermal lesions prepared at temperatures ranging from 60–90 °C over a frequency range from 0.1–50 Hz are presented. Lesions were prepared using either radio frequency ablation or double immersion boiling. It was found that both the magnitude and phase of the modulus increase with frequency, a behavior that has been noted in the literature. A new result reported shows that the modulus dependence on temperature reveals a local maximum around 70–75 °C corresponding to the temperature at which tissue has released most of its water content. The modulus values at temperatures higher than 70 °C continued to increase, but the extent of increase depend on animal species and other factors.
Keywords: viscoelasticity, thermal lesion, radio frequency ablation, elastography, modulus
1. INTRODUCTION
The most widely utilized method to detect lesions in organs such as the breast, liver, and prostate is through manual palpation. Palpation is effective because pathologic differences are generally well correlated with stiffness changes (Fung, 1993). However, this method is less effective in detecting small lesions, or lesions deep within the body. Many lesions are also isoechoic, meaning that they may not be detectable using ultrasound. Studies have both shown examples of tumors in the breast and prostate not visible in standard ultrasound (US) examinations, even though they were significantly stiffer than surrounding tissue (Garra et al., 1997; Hall and Zhu, 2003).
Recent improvements in elastography have made it possible to characterize lesion stiffness and improve strain contrast (i.e., the ratio of the average strain of an inclusion in an elastogram to that of the average background) to provide additional information, since echogenecity and lesion stiffness are uncorrelated (Bharat et al., 2005; Ophir et al., 1991; Varghese et al., 2001). In recent papers (Bharat et al., 2005; Kiss et al., 2004), researchers have studied the variation in the strain contrast and Young’s Modulus of thermally coagulated lesions in healthy canine liver tissue as a function of temperature and duration of heating. The strain contrast of lesions prepared using radio frequency (RF) ablation was found to depend on ablation temperature as well as duration of ablation. Strain contrast in elastography depends in part on the modulus contrast, defined as the ratio of the Young’s modulus of the lesion to that of the background (Kallel et al., 1996; Ophir et al., 2001), and there is some interest in determining whether the viscoelastic characteristics of lesions of soft tissues will be useful in analyzing strain contrast. A large modulus contrast in the underlying tissue will result in a large strain contrast on the estimated axial strain image. This may have potential utility to provide improved strain imaging capability for minimally invasive methods for treatment of liver cancer, such as RF or microwave ablation (Varghese et al., 2002, Bharat et al. 2008). Currently, the procedure is typically monitored using ultrasound imaging (Varghese et al., 2002, Bharat et al. 2008), but it may be possible to improve the procedure by monitoring with MR elastography (Sinkus et al., 2007; Stafford et al., 1998; Wu et al., 2001).
In this study, viscoelastic characteristics of ex vivo canine and porcine liver are investigated using Dynamic Mechanical Analysis (DMA) techniques. These methods have been used extensively in order to characterize mechanical characteristics of many different types of tissue and tissue mimicking materials. The proceeding list of papers includes, but is not limited to, several key examples, that are enumerated by tissue type. Bajema et al. (2000) reported on measurements in red apples (fruit). However, much of the measurements in biological tissue was performed on brain tissue (Cheng and Bilston, 2007; Darvish and Crandall, 2001; Hrapko et al., 2006; Hrapko et al., 2008). Other biological tissues that have been tested include, collagenous (Chen and Humphrey, 1998), ocular (Fritz et al., 1999), and fatty tissue (Geerligs et al., 2008). Results have also been reported from tissue in the kidney (Nasseri and Bilston, 2002), liver (Moffit et al., 2002; Yeh et al., 2002), prostate (Hoyt et al., 2008), throat (Chan, 2001; Yang et al., 2006) and uterine tissue (Kiss et al., 2006).
In addition, several studies have been conducted either to demonstrate data acquisition methods and analysis or in support of other studies, and may have used tissue or tissue mimicking materials. For example general DMA methods are described in the following papers (Chen et al., 1996; Erkamp et al., 1998; Sammani et al., 2003; Sacks and Sun, 2003), while Ottensmeyer et al. (2004) discusses the impact of the DMA environment on the measurements, and Taylor et al. (2002) present DMA results that support other methods.
Both normal tissue and the thermal lesions created were subjected to low amplitude periodic compressions, and the resulting complex moduli determined. The modulus of the tissue is an important factor in determining strain contrast in elastography, and the long-range goals of this project are to improve the understanding of the relationship between strain contrast and tissue characteristics, and to determine if tissue viscoelastic characteristics can be used effectively to exploit a new contrast mechanism in quasi-static and low frequency elastography.
2. MATERIALS AND METHODS
Determination of the complex moduli in excised tissue specimens is a straightforward procedure. Although there are more rigorous treatments in the literature (Christensen, 1982; Fung, 1993; Lakes, 1998), the basic derivation is summarized here. When a viscoelastic material is deformed, it responds with some level of strain. Expressed in terms of a Stieltjes integral, the stress σ is related to the strain ε (deformation) by the following constitutive relation:
| (1) |
where the relaxation function, E(t), represents the mechanical properties of the material. For the sake of simplicity the material is assumed to be linearly viscoelastic and isotropic. If the applied strain or perturbation is periodic,
| (2) |
where ε0 is the peak-to-peak strain amplitude and ω is the frequency, and then the stress response will also be periodic, shifted by some phase angle δ:
| (3) |
where σ0 is the peak-to-peak stress amplitude. Substituting equations (2) and (3) into (1), solving, and performing a Fourier transform on the result produces
| (4) |
where E*(ω) is the frequency-dependent complex modulus of the material. Accounting for the phase shift presented in equation (3), E*(ω) is expressed as:
| (5) |
where the frequency-dependence by δ is implied (i.e., δ (ω)). The real part of equation (5) is known as the storage modulus and reflects the ability of the material to store energy during a loading cycle. The imaginary part is called the loss modulus and indicates the amount of energy lost during each cycle. While the real and imaginary parts can be easily determined, it is more common to present the data in terms of the magnitude and phase, given by |E*(ω)| and tan δ, respectively.
The complex modulus contrast, as introduced by Kiss and coworkers (Kiss et al., 2006; Kiss et al., 2004), is defined as the ratio of the frequency-dependent complex modulus of an inclusion to that of the background, and is defined by
| (6) |
In general, C*t (ω) is a complex quantity, but our previous studies have shown that the imaginary part is approximately zero. This number can be therefore represented by taking the magnitudes of the two moduli, resulting in a real quantity. For the studies presented, the “inclusion” subscript in the numerator of equation (6) refers to a lesion, while the “background” refers to normal tissue.
Ten canine and ten porcine livers were obtained from unrelated studies in an adjacent lab. Thermally coagulated regions were prepared using one of two methods. In the first method, RF ablation was utilized to create thermal lesions in bulk tissue. A multi-prong electrode connected to a Rita Model 1500 (Rita Medical Systems, Inc., Mountain View, CA) was used to create these lesions at 70, 80, and 90 °C for an ablation duration of ten minutes. After the lesion was created in tissue, a sample was carefully excised using a custom-made cylindrical cutting tool 20 mm in diameter. The sample was then sliced to an appropriate thickness (3–5 mm). Care was taken to ensure that the ratio of sample thickness to sample diameter was 0.25 or less. This was done to prevent buckling of the sample during testing (Krouskop et al., 1998). After the lesion sample was cut from the bulk tissue, it was placed in isotonic saline for at least one hour and refrigerated prior to testing. While this method of preparation was adequate for the experiments, it is possible that improved results may be obtained by following a protocol similar to that presented by Ottensmeyer and coworkers (Ottensmeyer et al., 2004).
Samples prepared using RF ablation, were often too small for mechanical testing at the lower ablation temperatures and ablation durations and difficult to prepare, so, a second method was employed to create thermally coagulated regions. In addition, it was difficult to assure uniformly ablated regions with RF ablation. The second method, termed double immersion boiling (DIB), ensured that there would be more material to work with in order to prepare the samples. The term “boiling” is used here in spite of the fact that water temperatures never exceeded 90 °C. In double immersion boiling, tissue specimens, approximately 4 × 3 × 2 cm were immersed in a bath of distilled water. The reservoir was contained by a tin can, which was immersed in a distilled water reservoir. A temperature controller set to the target temperature (60–90 °C in 5 °C intervals), was also immersed in the reservoir. The water was allowed to reach the target temperature before the tissue was immersed in the bath. Tissue specimens were cooked for 15 minutes to ensure thorough coverage. After the specimen had been in the bath for the allotted time, it was removed and placed in a bath of room temperature distilled water for five minutes. Samples were then cut from the sample and placed in isotonic saline in the manner described above. It should be emphasized that the DIB method is not intended as a replacement method for preparing tissue for viscoelastic characterization. Modeling the mechanical characteristics of lesions is best accomplished using the results from RF ablation. This new method is intended as an approximation to RF ablation and is useful for the aforementioned reasons. This method has been used previously in a study by Techavipoo and coworkers (Techavipoo et al., 2004; Techavipoo et al., 2002).
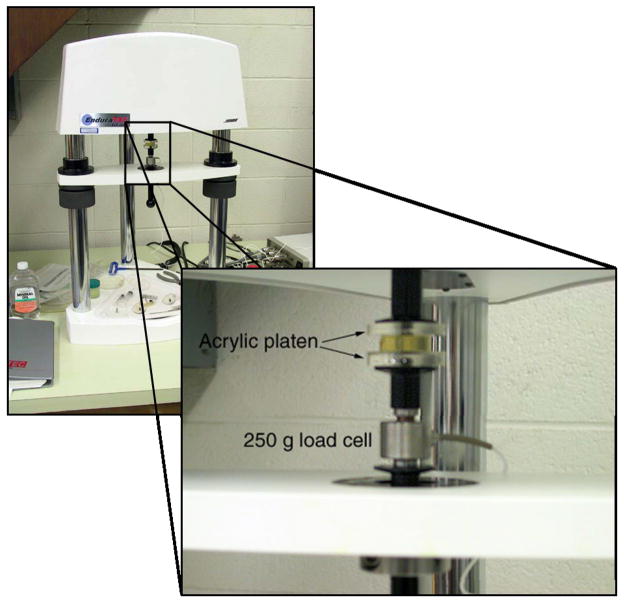
Viscoelastic characteristics were measured using an EnduraTEC ELF 3220 (Bose/EnduraTEC, Minnetonka, MN), as shown in Figure 1. The ELF 3220 is a tabletop testing system capable of dynamic testing frequencies from 10−5–400 Hz used to characterize the viscoelastic properties of materials. The system is electromagnetic, and relies on rare-earth magnets placed in the field created by stationary windings to produce a linear force proportional to the field polarity and intensity. Acrylic platens were mounted to both the mover and a calibrated load cell, rated to 250 gm. The platens were then coated with mineral oil to promote free-slip conditions between the sample and the platens. The specimens were subjected to periodic strains from 0.1–50 Hz with peak-to-peak amplitude of 1 %. Samples were preloaded via compression to 1 % to ensure that they would maintain full contact with both platens. All measurements were performed at room temperature (21.0 ± 1.5 °C). For each testing frequency, the sample was held at a mean strain level (1.5 %) for five seconds, after which the mover oscillated at the testing frequency. The system oscillated for 3–20 seconds (depending on the testing frequency) prior to data acquisition to allow for transient decay, preconditioning, and for the system to achieve the proper amplitude. Values for the complex modulus were obtained using the dynamic mechanical analysis (DMA) software for the ELF.
Figure 1.
Photographs of ELF system. The ELF3220 is a tabletop dynamic testing system capable of mechanical testing at frequencies from 10−5–400 Hz. Load cells of varying sensitivity (50–1000 g) can be used depending on the nature of the samples being studied. The enlargement shows the arrangement of the mover, a sample, and a 250-g load cell. Two acrylic platens ensure full contact on the sample.
Unlike the previous work (Kiss et al., 2004) the testing frequency was limited to 50 Hz. It has been discussed that shear tests provide more accurate results at higher frequencies (Madsen et al., 2008). Furthermore, although the amount of strain applied to the tissues in this study assumes a linearly viscoelastic response, the results may not be useful in estimating behavior at much higher frequencies, such as in the kHz to MHz range. Viscoelastic studies in this realm are best accomplished by techniques that utilize Acoustic Radiation Force Imaging (ARFI) and sonoelastography with recent work published by a number of groups (Hoyt et al., 2008; Liu and Ebbini, 2008; Sridhar et al., 2007).
3. RESULTS
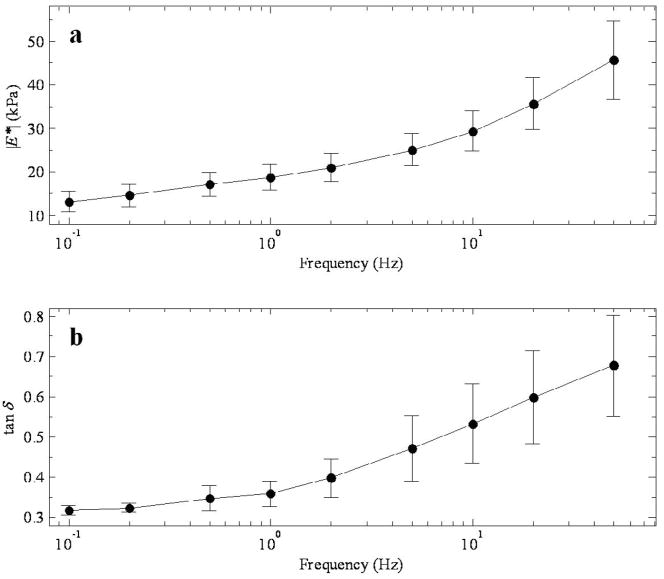
Variations of the complex modulus as functions of the mechanical testing frequency, and lesion temperature are presented in this section. Modulus results are presented for RF-ablated canine liver, and for canine and porcine liver prepared with DIB for each of the parameters mentioned above. Figure 2 shows representative plots of the magnitude (a) and phase (b) of the complex modulus as a function of the mechanical testing frequency. The plots here are for canine tissue prepared by RF ablation at 80 °C. Error bars represent the standard error. The range of moduli values in Figure 2a are from 15 kPa at 0.1 Hz up to 45 kPa at 50 Hz. The values for tan δ in the same range, seen in Figure 2b run from 0.3–0.7. The modulus demonstrates a monotonic increase with frequency, and this behavior was reported in a previous paper, and it is suggestive that the constitutive relation follows a power law (Kiss et al., 2004). This data in this figure is intended to remind the reader of the nature of the modulus’ dependence on frequency. This relationship is also noted by other investigators as reported in the literature (Chen et al., 2003; Nasseri and Bilston, 2002; Suki et al., 1994;Taylor et al., 2002; Taylor et al., 2001; Taylor et al., 2003). The phase, while much flatter than the modulus, also increases monotonically with frequency. This too is indicative of power law behavior.
Figure 2.
a) Magnitude of the complex modulus and b) tan δ as a function of testing frequency for canine tissue prepared by RF ablation at 80 °C. Data points represent the mean value from specimens taken from ten canine or porcine samples. Error bars in this and subsequent figures represent the standard error.
Figures 3–6 show the dependence of the (a) magnitude and (b) phase of the complex modulus as a function of lesion temperature. It is important to remember that the samples were measured at room temperature, and the lesion temperature value reported indicates the level at which the samples were prepared. In each case, the value for normal tissue has been represented in the graph by adding a data point at 39 °C, since during the animal’s life prior to sacrifice it is assumed that the temperature of the liver would have nominally remained near the body temperature.
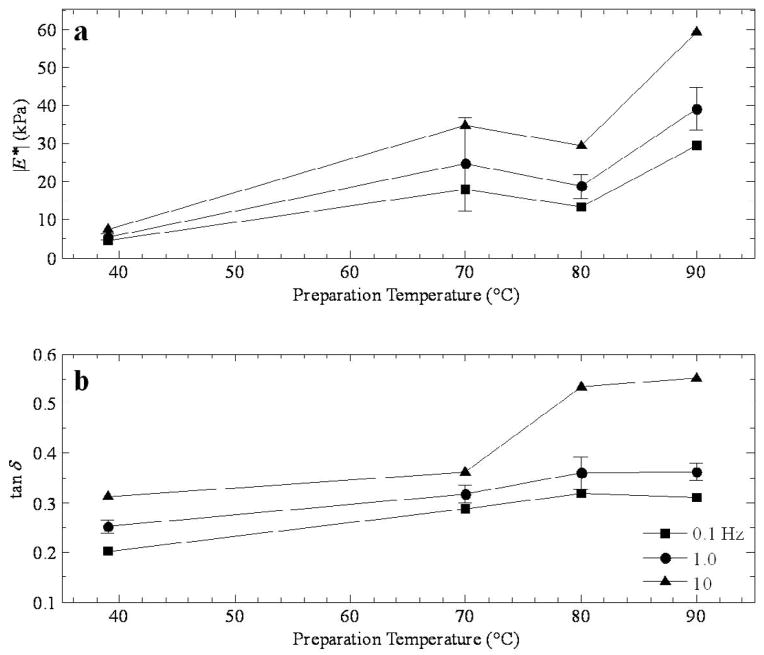
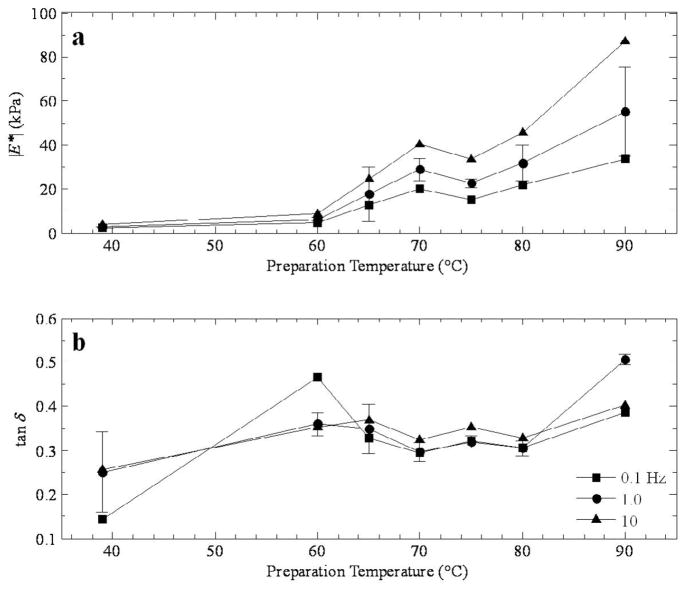
Figure 3.
a) Magnitude of the complex modulus and b) tan δ as a function of ablation temperature for thermal lesions in canine tissue prepared by RF ablation.
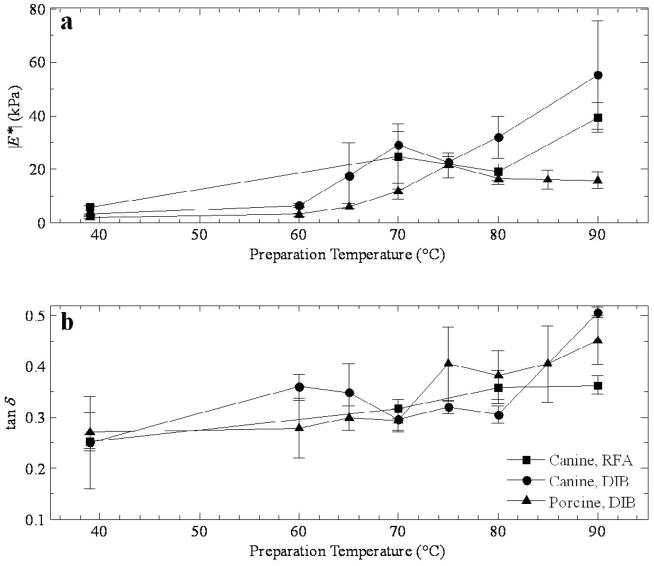
Figure 6.
Comparison of a) the magnitude of the complex modulus and b) tan δ as a function of preparation temperature for all three cases at 1.0 Hz.
Figure 3a shows the modulus dependence on temperature for thermal lesions prepared by RF ablation in canine liver at three frequencies (0.1, 1, and 10 Hz). Although only three lesion temperatures are represented (70, 80, and 90 °C), a local maximum is apparent at 70 °C, with a range of moduli from roughly 18 kPa (at 0.1 Hz) to 35 kPa at 10 Hz. The behavior at the higher temperatures indicates a softening of the tissue (at 80 °C) followed by further stiffening at 90 °C. The phase presented in Figure 3b behaves in an almost inverse way to the modulus, suggesting that at 80 °C, the tissue has the largest viscoelastic response, with tan δ values ranging from 0.3 at 0.1 Hz to 0.55 at 10 Hz. The comparatively lower values of tan δ at the other temperatures indicate stiffer responses.
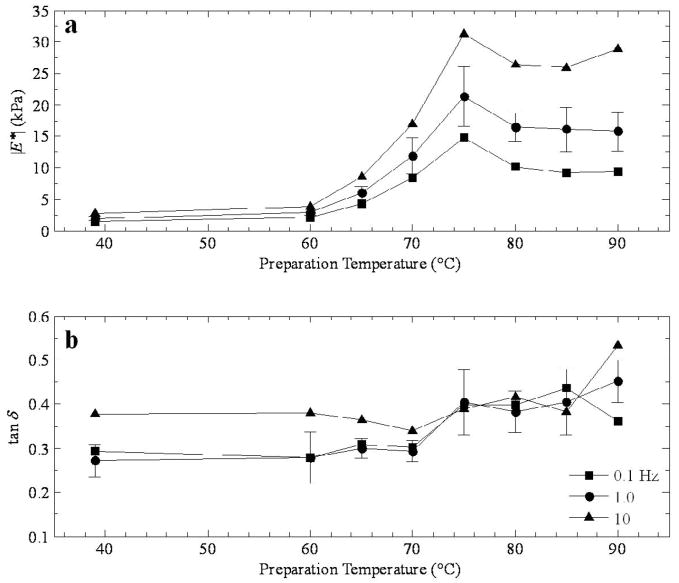
The modulus plot in Figure 4a is similar to those in Figure 3a, even though the method of tissue preparation is different (DIB). The data is also less sparse, with results presented in 5 °C steps from 60–90 °C, with an exception at 85 °C. The local maximum is once again present at 70 °C and a steady climb from the minimum at 75 °C. Despite the variations, the phase is relatively flat in Figure 3b, with most points remaining in the narrow range of roughly 0.30–0.40.
Figure 4.
a) Magnitude of the complex modulus and b) tan δ as a function of preparation temperature for thermal lesions in canine tissue prepared by double immersion boiling.
Corresponding results for porcine tissue are presented in Figure 5. The peak in the modulus occurs at 75 °C (Figure 5a), ranging from 15 kPa at 0.1 Hz up to 30 kPa at 10 Hz, and there is no recovery to higher moduli at higher temperatures. So, unlike the results for canine tissue, the moduli of lesions at higher temperatures level off at 10 kPa at 0.1 Hz, 15 kPa at 1 Hz, and there is a small upturn towards 30 kPa at 10 Hz. The phase information in Figure 5b occupies a slightly larger range in values from 0.275–0.55 compared to Figure 4b, and there is a rapid increase from 70 °C to 75 °C corresponding to the peak in Figure 4a.
Figure 5.
a) Magnitude of the complex modulus and b) tan δ as a function of preparation temperature for thermal lesions in porcine tissue prepared by double immersion boiling.
Figure 6 is a direct comparison of the (a) magnitude and (b) phase of the complex modulus as a function of lesion temperature at 1.0 Hz for all three tissue/lesion types. In Figure 6a, the local maximum at 70 or 75 °C is clear, and the difference in high temperature is striking, with the canine temperature results exceeding 30 kPa and the porcine tissue around 15 kPa at 90 °C. In Figure 6b, the phase generally increases with temperature in every case, although the features around 70 or 75 °C are apparent.
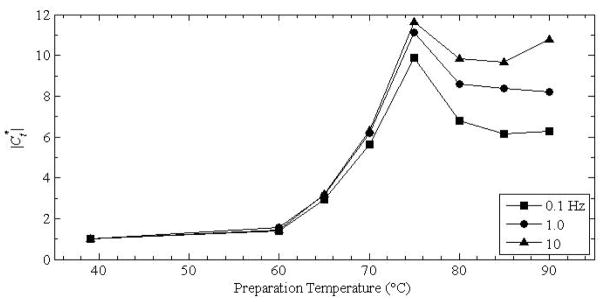
Figure 7 shows the modulus contrast as defined in equation 6 for porcine liver for the three frequencies as shown in Figure 5. These values were obtained by dividing the magnitude of the lesion modulus by the normal tissue modulus. The data point below 40 °C corresponds to the normal tissue divided by itself and is equal to 1. It is included in the plot as a reference for the other values.
Figure 7.
Magnitude of the complex modulus contrast as a function of the preparation temperature for porcine liver prepared by DIB.
4. DISCUSSION
The primary mechanism for altering the stiffness properties in soft tissues is the change in configurational entropy (Chen and Humphrey, 1998; Wu et al., 2001). Thermal ablation increases the entropy via heat-induced denaturation, where protein structures are transformed from their native helical structures into more disordered coiled structures (Privalov, 1982). As biological tissue is subjected to high temperatures (well above the normal environment), heat shock can cause a cell to lose viability and induce cell death if there are insufficient defense mechanisms in place. Cell death can occur either by apoptosis or necrosis. Apoptosis is a highly regulated process of programmed cell death that occurs from 42–46 °C (Badini et al., 2003), essentially cell suicide, in which the cell initially releases heat shock proteins intended to protect from thermal stress injury. In the case of exposure to sustained thermal stresses or high temperatures, excess production of these proteins eventually leads to cell death (Badini et al., 2003; Samali et al., 1999). Necrosis occurs when the damage to a cell is so severe that it cannot repair itself or provide adequate defensive measures. This damage can occur due to temperatures much higher than 46 °C, so that the apoptopic program does not execute. The contents of the damaged cell are released into the surrounding environment.
Although the experiments conducted here were conducted ex vivo, that is, on excised tissue specimens, the cause of cell death is less important than the mechanisms leading to the stiffness changes at various temperatures. The local maximum in the magnitude of the modulus near 70 °C is apparent in Figures 3–6. Bharat and coworkers (Bharat et al., 2005) have reported this feature in temperature-dependent results in direct context to modulus and strain contrast in elastography. The plots in Figure 7 also show variation for a tissue specimen tested in the paper. The general shape is similar to that of Figure 5, with the tissue prepared at 75 °C being almost 12 times as stiff as normal tissue at 10 Hz. However, a search through the literature suggests that this feature in liver tissue may not have been observed or reported on before now, although other temperature-dependent properties, such as the ultrasonic properties (Gertner et al., 1997; Techavipoo et al., 2002), dielectric properties (Chin and Sherar, 2001), and the extent of protein denaturation of hepatocytes during heat shock (Lepock et al., 1993) have been reported. An inspection of the food science literature reveals that this particular feature is hinted at in skeletal muscle (i.e., meat is hinted by McGee (McGee, 1984)).
It is known that protein molecules begin to uncoil (undergo denaturation) at roughly 38 °C, and begin to shorten at temperatures as low as 54 °C. As the tissue coagulates, water in the cells is forced out. At 77 °C, the cells have shrunk as much as they can and most of the water in the cells that can be released through tissue coagulation has occurred (McGee, 1984; Wiederhorn and Reardon, 1952). The contraction of tissue and fluid loss manifests itself as increase in the complex modulus. Thus, the peak noted in the figures is believed to represent the point where liver tissue has shrunk to its minimal size. For temperatures above this threshold, the decrease in the modulus is likely due to the fact that the collagen content is being converted to gelatin.
5. CONCLUSIONS
The viscoelastic properties of thermal lesions created in ex vivo animal tissue have been measured as functions of both the mechanical testing frequency as well as the lesion preparation temperature. The frequency-dependence generally followed the behavior documented in the literature (Kiss et al., 2004), but the temperature-dependence showed a local maximum in the modulus that had not been reported before. The local maximum suggests that there may be a tradeoff in the optimal treatment temperature and the optimal strain contrast temperature. Results like these should allow investigators in elastography to predict the level of strain contrast in an elastogram of thermal lesions, given a particular temperature. This could lead to further development of elastography as a diagnostic tool used during minimally invasive surgical procedures such as RF ablation of hepatic tumors or other pathologies of the liver.
Further work is required in this area, including computer simulations and experiments at the cellular level in order to further understand the relationship between the viscoelastic properties and the strain contrast. Additionally, mechanical testing relying on shear motion instead of compression will also be considered. As the understanding of the mechanical properties improves, other tissue types will be investigated including human tissue, which would provide the most realistic results.
Acknowledgments
The authors thank Mr. Larry Whitesell from the Department of Cardiovascular Research and Dr. Barbara Gilligan, recently from the Department of Surgery, both at the University of Wisconsin-Madison for providing tissue specimens. The authors also wish to thank Dr. Claudia Benkwitz and Dr. Katalin Kiss for their valuable comments. The support of NIH grants 2 T32 CA 09206, NCI R01CA112192, American Cancer Society grant IRG-58-011-47-09 and the Whitaker Foundation (grant RG-02-0457) is gratefully acknowledged.
Footnotes
Publisher's Disclaimer: This is a PDF file of an unedited manuscript that has been accepted for publication. As a service to our customers we are providing this early version of the manuscript. The manuscript will undergo copyediting, typesetting, and review of the resulting proof before it is published in its final citable form. Please note that during the production process errors may be discovered which could affect the content, and all legal disclaimers that apply to the journal pertain.
References
- Badini P, de Cupis P, Gerosa G. Necrosis evolution during high-temperature hyperthermia through implanted heat sources. IEEE Trans Biomed Eng. 2003;50:305–315. doi: 10.1109/TBME.2003.808812. [DOI] [PubMed] [Google Scholar]
- Bajema RW, Baritelle AL, Hyde GM, Pitts MJ. Factors influencing dynamic mechanical properties of red ‘delicious’ apple tissue. Transactions of the ASAE. 2000;43:1725–1731. [Google Scholar]
- Bharat S, Techavipoo U, Kiss MZ, Liu W, Varghese T. Monitoring stiffness changes in lesions after radiofrequency ablation at different temperatures and durations of ablation. Ultrasound in Med & Biol. 2005;31:415–422. doi: 10.1016/j.ultrasmedbio.2004.12.020. [DOI] [PubMed] [Google Scholar]
- Chan RW. Estimation of viscoelastic shear properties of vocal-fold tissues based on time-temperature superposition. J Acoust Soc Am. 2001;110:1548–1561. doi: 10.1121/1.1387094. [DOI] [PubMed] [Google Scholar]
- Chen EJ, Novakofski J, Jenkins WK, O’Brien WD. Young’s modulus measurements of soft tissues with applications to elasticity imaging. IEEE Trans Ultrason Ferroel Freq Cont. 1996;43:191–194. [Google Scholar]
- Chen SS, Humphrey JD. Heat-induced changes in the mechanics of a collagenous tissue: Pseudoelastic behavior at 37 degrees c. J Biomech. 1998;31:211–216. doi: 10.1016/s0021-9290(97)00121-8. [DOI] [PubMed] [Google Scholar]
- Cheng S, Bilston LE. Unconfined compression of white matter. J Biomech. 2007;40:117–124. doi: 10.1016/j.jbiomech.2005.11.004. [DOI] [PubMed] [Google Scholar]
- Chin L, Sherar M. Changes in dielectric properties of ex vivo bovine liver at 915 mhz during heating. Phys Med Biol. 2001;46:197–211. doi: 10.1088/0031-9155/46/1/314. [DOI] [PubMed] [Google Scholar]
- Christensen RM. Theory of viscoelasticity : An introduction. Academic Press; New York: 1982. [Google Scholar]
- Darvish KK, Crandall JR. Nonlinear viscoelastic effects in oscillatory shear deformation of brain tissue. Med Eng Phys. 2001;23:633–645. doi: 10.1016/s1350-4533(01)00101-1. [DOI] [PubMed] [Google Scholar]
- Erkamp RQ, Wiggins P, Skovorada AR, Emelianov SY. Measuring the elastic modulus of small tissue samples. Ultrason Imaging. 1998;20:17–28. doi: 10.1177/016173469802000102. [DOI] [PubMed] [Google Scholar]
- Fritz S, Meyer C, Eckert G, Abele B, Pechold W. Spectral analysis of viscoelasticity of the human lens. Journal of Refractive Surgery. 1999;15:714–716. doi: 10.3928/1081-597X-19991101-22. [DOI] [PubMed] [Google Scholar]
- Fung YC. Biomechanics. Springer-Verlag; New York: 1993. [Google Scholar]
- Garra BS, Cespedes EI, Ophir J, Spratt SR, Zuurbier RA, Magnant CM, Pennanen MF. Elastography of breast lesions: Initial clinical results. Radiology. 1997;202:79–86. doi: 10.1148/radiology.202.1.8988195. [DOI] [PubMed] [Google Scholar]
- Geerligs M, Peters GW, Ackermans PA, Oomens CW, Baaijens FP. Linear viscoelastic behavior of subcutaneous adipose tissue. Biorheology. 2008;45:677–688. [PubMed] [Google Scholar]
- Gertner MR, Wilson BC, Sherar M. Ultrasound properties of liver tissue during heating. Ultrasound in Med & Biol. 1997;23:1395–1403. doi: 10.1016/s0301-5629(97)00150-6. [DOI] [PubMed] [Google Scholar]
- Hall TJ, Zhu Y. In vivo real-time freehand palpation imaging. Ultrasound in Med & Biol. 2003;29:427–435. doi: 10.1016/s0301-5629(02)00733-0. [DOI] [PubMed] [Google Scholar]
- Hoyt K, Castaneda B, Zhang M, Nigwekar P, di Sant’agnese PA, Joseph JV, Strang J, Rubens DJ, Parker KJ. Tissue elasticity properties as biomarkers for prostate cancer. Cancer Biomark. 2008;4:213–225. doi: 10.3233/cbm-2008-44-505. [DOI] [PMC free article] [PubMed] [Google Scholar]
- Hoyt K, Kneezel T, Castaneda B, Parker KJ. Quantitative sonoelastography for the in vivo assessment of skeletal muscle viscoelasticity. Phys Med Biol. 2008;53:4063–4080. doi: 10.1088/0031-9155/53/15/004. [DOI] [PMC free article] [PubMed] [Google Scholar]
- Hrapko M, van Dommelen JA, Peters GW, Wismans JS. The mechanical behavior of brain tissue: Large strain response and constitutive modeling. Biorheology. 2006;43:623–636. [PubMed] [Google Scholar]
- Hrapko M, van Dommelen JA, Peters GW, Wismans JS. Characterization of the mechanical behaviour of brain tissue in compression and shear. Biorheology. 2008;45:663–676. [PubMed] [Google Scholar]
- Kallel F, Bertrand M, Ophir J. Fundamental limitations on the contrast-transfer efficiency in elastography: An analytic study. Ultrasound in Med & Biol. 1996;22:463–470. doi: 10.1016/0301-5629(95)02079-9. [DOI] [PubMed] [Google Scholar]
- Kiss MZ, Hobson MA, Varghese T, Harter J, Kliewer MA, Hartenbach EM, Zagzebski JA. Frequency-dependent complex modulus of the uterus: Preliminary results. Phys Med Biol. 2006;51:3683–3695. doi: 10.1088/0031-9155/51/15/006. [DOI] [PMC free article] [PubMed] [Google Scholar]
- Kiss MZ, Varghese T, Hall TJ. Viscoelastic characterization of in vitro canine tissue. Phys Med Biol. 2004;49:4207–4218. doi: 10.1088/0031-9155/49/18/002. [DOI] [PMC free article] [PubMed] [Google Scholar]
- Krouskop TA, Wheeler TM, Kallel F, Garra BS, Hall TJ. Elastic moduli of breast and prostate tissues under compression. Ultrasonic Imaging. 1998;20:260–274. doi: 10.1177/016173469802000403. [DOI] [PubMed] [Google Scholar]
- Lakes RS. Viscoelastic solids. CRC Press; Boca Raton, FL: 1998. [Google Scholar]
- Lepock JR, Frey HE, Ritchie KP. Protein denaturation in intact hepatocytes and isolated cellular organelles during heat shock. J Cell Biol. 1993;122:1267–1276. doi: 10.1083/jcb.122.6.1267. [DOI] [PMC free article] [PubMed] [Google Scholar]
- Liu D, Ebbini ES. Viscoelastic property measurement in thin tissue constructs using ultrasound. IEEE Trans Ultrason Ferroelectr Freq Control. 2008;55:368–383. doi: 10.1109/TUFFC.2008.655. [DOI] [PMC free article] [PubMed] [Google Scholar]
- Madsen EL, Frank GR, Hobson MA, Lin-Gibson S, Hall TJ, Jiang J, Stiles TA. Instrument for determining the complex shear modulus of soft-tissue-like materials from 10 to 300 hz. Phys Med Biol. 2008;53:5313–5342. doi: 10.1088/0031-9155/53/19/004. [DOI] [PMC free article] [PubMed] [Google Scholar]
- McGee H. On food and cooking. Charles Scribner’s Sons; New York: 1984. [Google Scholar]
- Moffit TP, Baker DA, Kirkpatrick SJ, Prahl SA. Mechanical properties of coagulated albumin and failure mechanisms of liver repaired with the use of an argon-beam coagulator with albumin. J Biomed Mater Res (Appl Biomater) 2002;63:722–728. doi: 10.1002/jbm.10389. [DOI] [PubMed] [Google Scholar]
- Nasseri S, Bilston LE. Viscoelastic properties of pig kidney in shear, experimental results and modeling. Rheologica Acta. 2002;41:180–192. [Google Scholar]
- Ophir J, Cespedes I, Ponnekanti H, Yazdi Y, Li X. Elastography: A quantitative method for imaging the elasticity of biological tissues. Ultrasonic Imaging. 1991;13:111–134. doi: 10.1177/016173469101300201. [DOI] [PubMed] [Google Scholar]
- Ophir J, Kallel F, Varghese T, Konofagou E, Alam SK, Krouskop T, Garra B-S, Righetti R. Elastography, Comptes Rendus de l’Academie des Sciences, Serie IV (Physique. Astrophysique) 2001;2:1193–1212. [Google Scholar]
- Ottensmeyer MP, Kerdok AE, Howe RD, Dawson Sl. International Symposium on Medical Simulation 2004. Cambridge, MA: Springer-Verlag; 2004. The effects of testing environment on the viscoelastic properties of soft tissues. [Google Scholar]
- Privalov PL. Stability of proteins: Proteins do not present a single cooperative system. Advances in Protein Chemistry. 1982;35:55–104. [PubMed] [Google Scholar]
- Sacks MS, Sun W. Multiaxial mechanical behavior of biological materials. Annu Rev Biomed Eng. 2003;5:251–284. doi: 10.1146/annurev.bioeng.5.011303.120714. [DOI] [PubMed] [Google Scholar]
- Samali A, Holmberg CI, Sistonen L, Orrenius S. Thermotolerance and cell death are distinct cellular responses to stress: Dependence on heat shock proteins. FEBS Letters. 1999;461:306–310. doi: 10.1016/s0014-5793(99)01486-6. [DOI] [PubMed] [Google Scholar]
- Sammani A, Bishop J, Luginbuhl C, Plewes DB. Measuring the elastic modulus of ex vivo small tissue samples. Phys Med Biol. 2003;48:2183–2198. doi: 10.1088/0031-9155/48/14/310. [DOI] [PubMed] [Google Scholar]
- Sinkus R, Siegmann K, Xydeas T, Tanter MCC, Fink M. MR elastography of breast lesions: Understanding the solid/liquid duality can improve the specificity of contrast-enhanced MR mammography. Magn Reson Med. 2007;58:1135–1144. doi: 10.1002/mrm.21404. [DOI] [PubMed] [Google Scholar]
- Sridhar M, Liu J, Insana MF. Viscoelasticity imaging using ultrasound: Parameters and error analysis. Phys Med Biol. 2007;52:2425–2443. doi: 10.1088/0031-9155/52/9/007. [DOI] [PMC free article] [PubMed] [Google Scholar]
- Stafford RJ, Kallel F, Price RE, Cromeens DM, Krouskop TA, Hazle JD, Ophir J. Elastographic imaging of thermal lesions in soft tissue: A preliminary study in vitro. Ultrasound in Med & Biol. 1998;24:1449–1458. doi: 10.1016/s0301-5629(98)00099-4. [DOI] [PubMed] [Google Scholar]
- Suki B, Barabási A-L, Lutchen KR. Lung tissue viscoelasticity: A mathematical framework and its molecular basis. J Appl Physiol. 1994;76:2749–2759. doi: 10.1152/jappl.1994.76.6.2749. [DOI] [PubMed] [Google Scholar]
- Taylor LS, Richards MS, Moskowitz AJ, Lerner AL, Rubens DJ, Parker KJ. Viscoelastic effects in sonoelastography: Impact on tumor detectability. 2001 IEEE Ultrasonics Symposium. 2001:1639–1642. [Google Scholar]
- Techavipoo U, Varghese T, Chen Q, Stiles T, Zagzebski JA, Frank G. Temperature dependence of ultrasonic propagation speed and attenuation in excised canine liver tissue measured using transmitted and reflected pulses. J Acoust Soc Am. 2004;115:2859–2865. doi: 10.1121/1.1738453. [DOI] [PubMed] [Google Scholar]
- Techavipoo U, Varghese T, Zagzebski JA, Stiles T, Frank G. Temperature dependence of ultrasonic propagation speed and attenuation in canine tissue. Ultrason Imaging. 2002;24:246–260. doi: 10.1177/016173460202400404. [DOI] [PubMed] [Google Scholar]
- Varghese T, Ophir J, Konofagou E, Kallel F, Righetti R. Tradeoffs in elastographic imaging. Ultrasonic Imaging. 2001;23:216–248. doi: 10.1177/016173460102300402. [DOI] [PubMed] [Google Scholar]
- Varghese T, Zagzebski JA, Lee FT., Jr Elastographic imaging of thermal lesions in the liver in vivo following radiofrequency ablation: preliminary results. Ultrasound Med Biol. 2002;28:11–12. 1467–73. doi: 10.1016/s0301-5629(02)00656-7. [DOI] [PubMed] [Google Scholar]
- Bharat S, Fisher TG, Varghese T, Hall TJ, Jiang J, Madsen EL, Zagzebski JA, Lee FT., Jr Three-dimensional electrode displacement elastography using the Siemens C7F2 fourSight four-dimensional ultrasound transducer. Ultrasound Med Biol. 2008;34(8):1307–16. doi: 10.1016/j.ultrasmedbio.2008.01.007. [DOI] [PMC free article] [PubMed] [Google Scholar]
- Wiederhorn NM, Reardon GV. Studies concerned with the structure of collagen. Ii. Stress-strain behavior of thermally contracted collagen. J Polym Sci. 1952;9:315–325. [Google Scholar]
- Wu T, Felmlee JP, Greenleaf JF, Riederer SJ, Ehman RL. Assessment of thermal tissue ablation with MR elastography. Magn Reson Med. 2001;45:80–87. doi: 10.1002/1522-2594(200101)45:1<80::aid-mrm1012>3.0.co;2-y. [DOI] [PubMed] [Google Scholar]
- Yang W, Fung TC, Chian KS, Chong CK. Viscoelasticity of esophageal tissue and application of a QLV model. J Biomech Eng. 2006;128:909–916. doi: 10.1115/1.2372473. [DOI] [PubMed] [Google Scholar]
- Yeh WC, Li PC, Jeng YM, Hsu HC, Kuo PL, Li ML, Yang PM, Lee PH. Elastic modulus measurements of human liver and correlation with pathology. Ultrasound Med Biol. 2002;28:467–474. doi: 10.1016/s0301-5629(02)00489-1. [DOI] [PubMed] [Google Scholar]


