

Abstract
Brain tumors are relatively rare but deadly cancers, and present challenges in the determination of risk factors in the population. These tumors are inherently difficult to cure because of their protected location in the brain, with surgery, radiation and chemotherapy options carrying potentially lasting morbidity for patients and incomplete cure of the tumor. The development of methods to prevent or detect brain tumors at an early stage is extremely important to reduce damage to the brain from the tumor and the therapy. Developing effective prevention or early detection methods requires a deep understanding of the risk factors for brain tumors. This review explores the difficulties in assessing risk factors in rare diseases such as brain tumors, and discusses how mouse models of cancer can aid in a better understanding of genetic risk factors for brain tumors.
Keywords: astrocytoma, genetic risk factors, glioblastoma multiforme, mouse models, neurofibromatosis, peripheral nerve sheath tumors
ABSENCE OF EVIDENCE IS NOT EVIDENCE OF ABSENCE
The debate over the past decade on whether cell phone use increases brain tumor risk highlights the difficulties in identifying risk factors for brain tumorigenesis. Multiple studies have produced conflicting results, and although it is now accepted that the risk of developing a brain tumor from cell phone use is likely negligible 1, 25, 34, 51, 66, the few studies showing an effect of cell phones continue to raise concerns in the general population. Although risk factors and causes of many common cancers have now been established (http://www.cancer.gov/cancertopics/prevention‐genetics‐causes), understanding the factors that contribute to brain tumors remains elusive.
DISEASE RISK FACTORS
There are multiple types of risk factors governing disease susceptibility. These include behavioral risk factors, such as choosing to smoke or excessive alcohol consumption, environmental risk factors, such as exposure to chemical carcinogens or radiation, biological risk factors, such as puberty or aging and genetic risk factors, such as inheritance of tumor suppressor mutations or susceptibility alleles of modifier genes. These different risk factors form a spectrum of what people can control to what they cannot control, with behavioral risk factors being the easiest to control and biological risk factors being impossible to control. Furthermore, different types of risk factors interact. For example, the behavioral risk factor of smoking likely interacts with genetic variability in the population that determines how easily a person becomes addicted to cigarettes. Similarly, wearing sunscreen is a behavioral factor that reduces risk, counteracting the environmental risk of UV exposure. By understanding different types of risk factors, it is hoped that protective factors that are controllable (such as wearing sunscreen) can be developed to counteract risk factors that are uncontrollable (such as UV exposure). In the case of brain tumors, this might include increased screening for early detection of tumors in individuals at higher risk because of genetic susceptibility. While an individual's exposure to behavioral and environmental risk can be difficult to study and can change at different times of life, genetic risk factors are expected to be stable in the individual over their lifetime. This article will focus primarily on genetic determinants of brain tumor risk because an individual's genetic background forms the foundation against which all other risk factors interact.
GENETIC RISK FACTORS FOR BRAIN CANCER
Although very little is known about the genetic risk factors for brain cancer, a few factors have been identified thus far. Brain tumors are associated with several familial cancer predisposition syndromes. These include Li‐Fraumeni syndrome, neurofibromatosis, tuberous sclerosis and Turcot's syndrome. In these syndromes, individuals inherit a germline mutation in a tumor suppressor gene. Tumors initiate when the remaining copy of the tumor suppressor is mutated or silenced, giving rise to cells with a growth advantage. Because tumorigenesis requires the accumulation of multiple mutations in cells, these individuals have an increased tumor risk because all cells carry an initial mutation. Li‐Fraumeni syndrome is caused by mutations in the cell checkpoint genes TP53 (40) and CHEK2 (4). Turcot's syndrome is caused by mutations in genes involved in DNA repair (24). It is likely that in Li‐Fraumeni syndrome and Turcot's syndrome the risk for brain tumors is increased by an increased rate of DNA mutation leading to uncontrolled growth. Neurofibromatosis is caused by mutations in NF1 or NF2 20, 29 and tuberous sclerosis is caused by mutations in TSC1 or TSC2 2, 36. NF1, NF2, TSC1 and TSC2 are all involved in down regulation of growth promoting signal transduction pathways in the cell. It is therefore likely that in neurofibromatosis and tuberous sclerosis, the risk for brain tumors is increased because brain cells are primed for excessive growth and then develop additional mutations allowing cancer to form.
In addition to known familial cancer predisposition syndromes, it has also been observed that brain tumors can cluster within families [see (45) for review]. Familial clustering can be because of both genetic and environmental factors, as families often share common environmental exposures in addition to common genes. Modeling of the inheritance pattern of familial glioma suggests that at least in some cohorts, genetic factors play a role in susceptibility 15, 41, 42. Segregation analysis of 297 families in Sweden suggested that recessive genes may contribute to familial glioma, although a multifactorial model was not excluded (41). However, homozygosity mapping in a study of seven glioma families in Sweden did not identify any common homozygous alleles (44). Segregation analysis of 639 families in the United States and Canada found evidence for a multifactorial Mendelian model, and suggested that familial glioma is affected by multiple low penetrance genes (15). In contrast, a study of 396 families in Iceland found no evidence for increased risk of gliomas in families, although the authors cite several limitations to the study including small sample size (53).
Although evidence for a genetic risk component in brain tumors has been demonstrated, efforts to identify the underlying genes have had little success. A study of seven families in Sweden found weak linkage to chromosome 1q23 (logarithm of the odds (LOD) = 1.0517) (44). In a study of 15 families in Finland, linkage for susceptibility to glioma was found on four chromosomes, 1q25.1, 6q27, 8p21.3 and 15q26.2, with chromosome 15 showing the most significant linkage. Because the linked region on chromosome 15 covers 40 cM, it was not possible to identify genes in this study (58). These studies are severely hampered by the fact that brain tumors are rare and different brain tumor types often need to be pooled together in studies, possibly diluting out significant effects on specific brain tumor histologies. To begin to address these issues, the GLIOGENE international consortium has recently formed to collect large numbers of brain tumor cases (45).
Because of the difficulties in using unbiased screens for genetic risk factors, many investigators have turned to candidate approaches to test for susceptibility genes. One of the earliest gene families to be examined was the glutathione S‐transferase (GST) family of genes because of their role in detoxifying environmental carcinogens. Studies attempting to link specific GST polymorphisms to brain tumor risk have given conflicting results, with most studies finding no significant link between GST genotype and brain tumor risk 37, 54, 69, 73. Patients carrying a combination of the germ‐line genotype GSTP1*A/*A and GSTM1 null were shown to have an increased survival, but also have greater adverse effects in response to chemotherapy (54). A second candidate approach has been to examine the role of genes involved in DNA repair, such as p53 and XRCC 6, 35, 43, 46, 77. These studies have also shown mixed results, with polymorphisms in p53 showing increased risk in glioblastoma in one study (46), but not another (77), and polymorphisms in XRCC7 being associated with risk for glioma (77). Recently, a polymorphism in the apoptosis gene Caspase 8 has also been shown to be associated with increased glioma risk, although in four out of the five case control studies examined, this association was not statistically significant (5). An observed inverse relationship between asthma and glioma (81) has led investigators to examine polymorphisms in genes associated with immune response and inflammation. Studies of the association of polymorphisms in IL13 and IL4R with glioblastoma risk have produced conflicting results 67, 68, 80.
The studies to link candidate genes to brain tumor risk overall have yielded mixed results, pointing out the difficulty of understanding the genetic basis of brain tumor risk, even when evidence exists for this genetic risk being important. The difficulty in finding genetic risk factors stems from the limited number of brain tumor patients available for these studies, the possibility for necessary interactions of different genetic factors, such that a single candidate factor does not show significant linkage, and the possibility that genetic factors interact with environmental risk factors that are not uniform across different populations and different studies. In essence, this boils down to too many variables and not enough subjects to determine statistical significance. While the GLIOGENE consortium seeks to build a large study population, this may not entirely solve the problem if confounding variables and heterogeneity in the population, both at the genetic and environmental level, are the issue.
MOUSE MODELS OF BRAIN CANCER TO DISSECT ISSUES OF HETEROGENEITY
When studying genetic risk factors in human populations, one must consider and control for many confounding variables. Mouse models of human cancer allow one to start with a relatively homogeneous system and layer on complexity in a controlled way. This allows one to determine genetic risk factors in an unbiased screen using fewer subjects than would be possible in a human study. Genetic risk factors that are identified in mice can then be tested for association in human populations using more straightforward candidate approaches. Mouse models of brain cancer can be bred under relatively constant environmental conditions with a constant diet and a well‐controlled genetic background to isolate genetic factors from environmental factors. Once the genetic factors are well understood, environmental factors can be introduced into the experiment, for example by feeding mice a high‐fat diet or exposing them to pathogens or carcinogens, to determine the effects on cancer risk. Mouse models of skin cancer, lung cancer, colon cancer, plasmocytoma, teratoma, and breast cancer metastasis have already been used to identify modifier genes of cancer susceptibility 13, 16, 19, 21, 55, 64, 84, 85. Ongoing experiments are using a mouse model of astrocytoma and secondary glioblastoma to identify modifiers of brain cancer (61).
The power of mapping modifiers of brain tumors in mouse lies in the ability to generate large numbers of homogeneous individuals. A mouse model of astrocytoma and secondary glioblastoma has been generated by combining mutations in Nf1 and Trp53 on the same chromosome of the mouse (60). Because the mutations are tightly linked on the same chromosome, they are inherited as a single mutation, resulting in near Mendelian inheritance ratios. These mice develop brain tumors with high penetrance in the population, such that in a population of mutant progeny, up to 70% of animals will develop a brain tumor (Figure 1) with many of the characteristics of human astrocytoma and glioblastoma (1, 2). This combination of high penetrance and simple genetics means that large numbers of mice developing brain tumors can be generated relatively easily for studies of brain tumor risk.
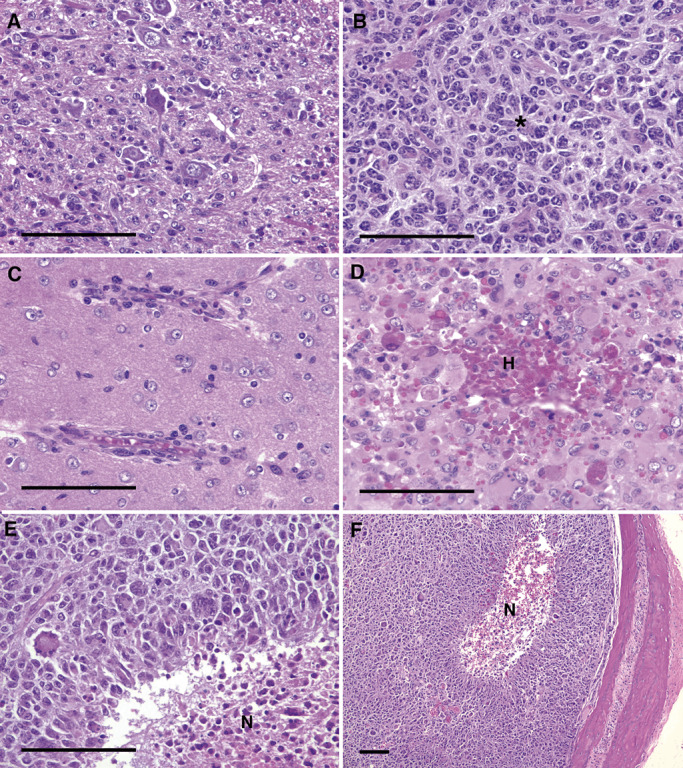
Figure 1.

Astrocytomas in NPcis mice. A. Shows diffuse dysplastic nuclei in a World Health Organization grade (WHO) II astrocytoma. Approximately 40% of astrocytomas observed in NPcis mice are WHO II, depending of the genetic background. B. Shows an anaplastic astrocytoma in the spinal cord (V). Approximately 50% of astrocytomas observed are WHO III in the brain or spinal cord. Up to 40% of astrocytomas are found in the spinal cord and many are suggestive of a primary spinal cord lesion, as opposed to infiltration from a primary brain tumor. C. Shows an aggressive glioblastoma multiforme (GBM) that appears to have exited the brain at the bottom of the panel, broken through the skull (S), and is spreading along the surface of the skull at the top of the panel. D.,E. Show examples of diagnostic criteria in NPcis astrocytomas. Dysplastic nuclei are seen in all astrocytomas (D) with distinctive multinucleated giant cells (arrows) found in up to 15% of astrocytomas, including most WHO IV tumors. WHO III and WHO IV astrocytomas have varying degrees of mitotic activity (E). Arrows point at a couple of the mitoses visible in the panel. (F) WHO IV GBMs have regions of N. Scale bars indicate 100 µm. V = vertebra; S = skull; N = necrosis.
Figure 2.
Secondary structures found in NPcis astrocytomas. A. Shows an example of satellitosis in which tumor cells form satellite structures around large neurons. An especially distinctive satellitosis pattern is found in up to 7% of observed astrocytomas. B. Shows an example of rosette‐like structures (*) in which tumor cells cluster and fan out from a central point. C. Shows an example of perivascular structures in which tumor cells line up along blood vessels in close association. D. Shows an example of hemorrhage (H) that is found in most GBMs and many of the more aggressive anaplastic astrocytomas. E.,F. Show examples of pseudopallisading tumor cells around a central necrotic core (N) that is found in rare cases of GBM. Scale bars indicate 100 µm. H = hemorrhage.
The Nf1 gene encodes the protein neurofibromin that acts as a rasGAP protein to downregulate active ras signaling 3, 22, 26, 47, 82, 83. The gene is mutated in the disease NF1 in which patients develop many benign tumors of the nervous system and are at increased risk for developing astrocytomas, glioblastomas and malignant peripheral nerve sheath tumors. Nf1 has recently been shown to be mutated in a subset of human glioblastoma samples 48, 57. Trp53 encodes the p53 protein that acts as a regulator of cell cycle arrest and apoptosis. The human gene for p53 (Tp53) is mutated in the disease Li‐Fraumeni syndrome in which patients are at an increased risk for developing many types of cancer, including brain tumors. Tp53 or other members of the p53‐signaling pathway are frequently mutated in human astrocytoma and glioblastoma samples. Both Nf1 and Trp53 have been mutated in mice. Homozygous mutation of Nf1 is embryonic, lethal and heterozygous mutation of Nf1 is tumor‐prone 8, 32. Homozygous mutants for Trp53 develop thymic lymphoma with high penetrance, whereas heterozygous mutants develop a variety of tumor types, primarily sarcomas 18, 31. When Nf1 and Trp53 mutations are combined on the same chromosome through a germline recombination event, the resulting Nf1−/+;Trp53−/+cis(NPcis) mice develop malignant peripheral nerve sheath tumors and astrocytomas with high penetrance 11, 75.
Studies of the NPcis mouse model on different strain backgrounds have demonstrated the importance of genetic risk factors in astrocytoma and glioblastoma, as well as the complexity of interactions between different types of risk factors. NPcis mice on a C57BL/6J (B6) strain background are highly susceptible to astrocytomas and glioblastomas, with up to 70% of males developing brain tumors (Table 1). In contrast, NPcis mice on a 129S4/SvJae (129S4) strain background are highly resistant to developing astrocytoma and glioblastoma, with as few as 12% of females developing brain tumors (Table 1). In addition to the effect of strain background, the inheritance of the NPcis mutant chromosome from the mother or father has an effect on astrocytoma risk. In the case of females, progeny of NPcis mutant mothers develop higher‐grade tumors than progeny of mutant fathers, although the percentage of the population with brain tumors is the same. In the case of males, progeny of NPcis mutant mothers develop more tumors than progeny of mutant fathers (Table 1). This data demonstrates that there is a parent‐of‐origin effect on brain tumors, likely because of changes in expression of an imprinted gene on mouse chromosome 11. Interestingly, this imprinted effect has gender‐specific consequences, with females developing higher‐grade tumors and males developing more brain tumors in the population.
Table 1.
Variation in astrocytoma incidence in NPcis mice depends on strain background.
| Cross | Females (%) | Males (%) |
|---|---|---|
| NPcis B6 mother X WT B6 father | 51 | 71 |
| WT B6 mother X NPcis B6 father | 52 | 49 |
| WT 129S4 mother X NPcis 129S4 father | 12 | 17 |
WT = wild‐type.
Studies are ongoing to map the modifier loci responsible for the difference in susceptibility between the B6 and 129S4 strains. However, comparisons between F1 intercrosses of NPcis mice on a 129S4 background and NPcis mice on the B6 background have identified a modifier locus on mouse chromosome 11 in a 30‐Mb congenic region surrounding the Trp53 and Nf1 mutations (61). It is interesting to note that there are strain‐specific differences in the expression level of Nf1 in the brain on the B6 and 129S4 strain backgrounds (27). It is therefore possible that levels of Nf1 expression in the heterozygous brain cell, before the wild‐type (WT) copy of Nf1 is lost, could alter the risk of developing astrocytoma. Further studies are necessary to confirm or disprove this possibility. In addition, there are multiple candidate genes in the region that are polymorphic between B6 and 129S4, and could be responsible for a change in brain tumor risk (61).
In addition to using the NPcis mouse model to identify genetic risk factors for brain tumors, the model has also been used to examine genetic risk factors for malignant peripheral nerve sheath tumors [genetically engineered murine peripheral nerve sheath tumors (GEM PNSTs), in mouse (71)] (Figure 3) (62). These studies have been very informative on the complexity of genetic interactions contributing to nervous system tumor risk, and are shaping the design of experiments to understand risk of brain tumors. The risk of GEM PNSTs is also affected by inheritance of the NPcis mutant chromosome from the mother or the father. In contrast to what is seen with brain tumors, the progeny of mutant fathers have an increased incidence of GEM PNSTs compared to the progeny of mutant mothers (Table 2), with males having a greater risk of GEM PNSTs than females regardless of the cross. Crosses of NPcis B6 mice to the A/J strain have demonstrated the existence of dominant resistance alleles in A/J and backcross mapping has been used to identify loci responsible for resistance to GEM PNSTs. Two nerve sheath tumor resistance loci, Nstr1 and Nstr2, have been identified thus far (62), and the ability of these loci to affect tumor resistance is cross specific. Nstr1 on mouse chromosome 19 only appears to affect tumor resistance in progeny of NPcis mutant fathers, whereas Nstr2 on mouse chromosome 15 appears to affect tumor resistance only in progeny of NPcis mutant mothers. When the combined population of progeny of mutant fathers and progeny of mutant mothers were examined for resistance loci, no significant loci were found. This is due to the fact that because the resistance loci only act in a subset of the population, the other unaffected individuals mask the ability to identify significant linkage. The heterogeneity of the population, even within this well‐defined mouse population, prevents the identification of genetic risk factors that are present in the population. This further illustrates the difficulties for identifying genetic risk factors directly in patient populations, where the degree of heterogeneity is far greater.
Figure 3.
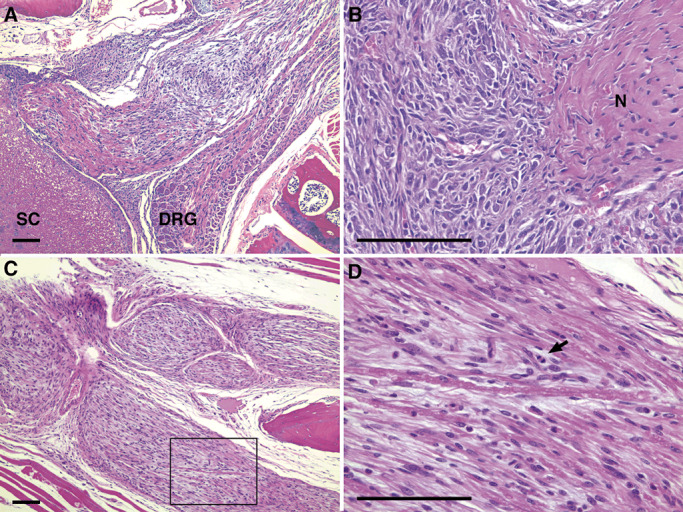
Genetically engineered murine peripheral nerve sheath tumors in NPcis mice. A.,B. SC, DRG and N are indicated for different MPNSTs. D. Shows a high magnification field of the spinal nerve root tumor shown in C. (box), and the arrow points to a mitotic figure found in the tumor. Scale bars indicate 100 µm. SC = spinal cord; DRG = dorsal root ganglion; N = nerve.
Table 2.
Variation in genetically engineered murine peripheral nerve sheath tumor incidence in NPcis mice depends on parental inheritance.
| Cross | Females (%) | Males (%) |
|---|---|---|
| NPcis B6 mother X WT B6 father | 34 | 46 |
| WT B6 mother X NPcis B6 father | 60 | 82 |
WT = wild‐type.
IDENTIFYING MOUSE GENETIC RISK FACTORS FOR CANCER IN THE 21ST CENTURY
Since the sequencing of the human 38, 65, 74 and mouse genomes 39, 50, 76, 78 at the beginning of this century, there has been a rapid acceleration in the ability to map genetic risk factors. These efforts have led to the identification of vast numbers of single nucleotide polymorphisms for following genetic variability in both human and mouse, and made possible the genome‐wide association studies currently underway in patient populations (59). In parallel, new research tools being developed in the mouse genetics community are expected to provide new power to identifying genetic risk factors in mice.
Thus far, most of the modifiers of cancer identified in mice have been found through a combination of mapping in backcross populations, intercross populations (Figure 4), recombinant congenic strains as well as candidate gene approaches 7, 12, 13, 19, 21, 55, 64, 84, 85. These approaches take advantage of the relative simplicity of comparing two strains through different genomic combinations to find regions of the genome responsible for determining cancer risk. These approaches face the challenges of needing to genotype a large number of mice at a large number of genetic loci in order to correlate the change in phenotype to a particular genotype at a particular point in the genome. Although the ability to genotype large numbers of loci is becoming less costly, efforts have been made to develop strain tools that are fixed in their genotype and therefore do not require genotyping for each experiment performed. These include recombinant inbred strain panels and chromosome substitution strains (Figure 5) 52, 70. These panels have the advantage that they are genetically stable and so can be compared across different experiments. As an example, if one found certain strain affected one kind of brain tumor, one could easily go back the these strains and test for effects on other types of brain tumors. More advanced strain tools are now being employed to further balance the need for a simple, experimentally tractable system with the need to increase the heterozygosity of the system to improve mapping resolution [see (28) for a recent review].
Figure 4.

Identifying genetic risk factors between susceptible and resistant strains using F2 intercross or backcross designs. To identify a dominant modifier of resistance (M), a susceptible strain and a resistant strain are crossed to generate F1 progeny. Germline recombination events in F1 progeny will generate chromosomes that are a mixture of the two strain backgrounds. F1 progeny can be intercrossed to give rise to F2 progeny carrying different recombination events on each chromosome and allowing the possibility of detective recessive modifiers. Alternatively, F1 progeny can be backcrossed to the strain carrying the recessive allele of the modifier, simplifying the detection of dominant modifiers.
Figure 5.
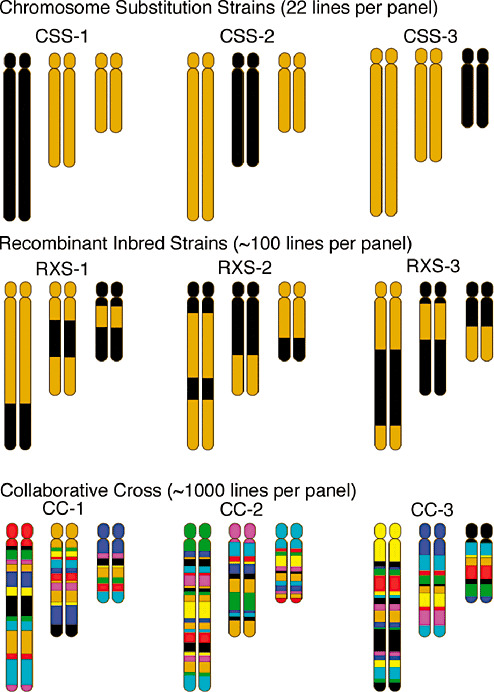
Reference panels for identifying genetic risk factors. Panels of strains with stable genetics and well‐characterized genotypes can be used to identify modifier genes. CSS carry one chromosome from one strain (black) on the background of another strain (gold). By examining the phenotype in a CSS line for each autosomal chromosome, the X and Y chromosomes, and the mitochondria, one can isolate which chromosomes give rise to genetic variation in phenotype. Recombinant inbred strains carry different mixtures of two strains (black and gold), with different combinations in each line. By examining a phenotype across a large number of these lines, one can identify which regions of the genome associate with a particular trait. Because there is limited variation between any two inbred strains, higher order heterogeneous stocks have been generated. A recent example of this is the CC in which eight different strains are combined to preserve variability and then inbred to form lines, with each line carrying different combinations of the eight parental lines. CSS = chromosome substitution strains; CC = collaborative cross; RXS = resistant X susceptible recombinant inbred line.
Because most mapping of genetic risk factors in mouse focuses on the comparison between two inbred strains, there are limitations to the number of modifiers that can be identified. Despite the differences between the inbred strains, there is relatively low allelic diversity between strains (63). This is because of the fact that the laboratory inbred strains were developed only recently, thus their evolutionary history is short. To address this issue, mouse geneticists are developing an expanded panel of recombinant inbred lines, termed the Collaborative Cross, which is derived from eight different founder strains 10, 72. The eight founder strains were chosen for genetic and phenotypic diversity between different strains and subspecies, allowing for the capture of close to 90% of the existing variation in the mouse genome (63) (Figure 5). Through a collaboration of three different breeding locations, up to 1000 independent Collaborative Cross lines are planned and currently being generated 9, 30, 49. These lines will be densely genotyped, such that by comparing phenotypes across many lines one can map modifiers precisely. Modeling of the distribution of allelic frequency in the Collaborative Cross suggests that it closely mimics the distribution found in the human population (63). This resource should allow a system genetics approach to understanding genetic risk to disease, and allow researchers to examine interactions at multiple loci in a controlled way.
Characterized strains of wild‐type mice do not develop spontaneous brain tumors with high enough frequency or short enough latency to provide a tractable experimental system for mapping genetic risk factors. It is therefore important to choose appropriate genetically engineered mouse models for mapping studies. Mouse models on well‐defined strain backgrounds can be crossed into backcross or intercross mapping designs (Figure 4) by maintaining the engineered mutations at each generation, or can be crossed to genetic reference panels such as shown in Figure 5 to look at F1 hybrids for genetic risk factors that act dominantly over the strain background of the brain tumor model. These experiment are best performed with “one‐allele/one‐generation” models. These are models in which the brain tumor phenotype can be observed in the heterozygous state, and either require the inheritance of only one engineered allele, or in which multiple alleles can be homozygosed in a parental line and crossed to the reference panels to examine the phenotype in heterozygotes. Mouse model systems in which many engineered alleles need to be combined, such as in the case for many Cre‐flox models, will be difficult to use for mapping studies because of the low rate of co‐inheritance of multiple alleles in mouse crosses. Several mouse models are available that fit the one allele/one generation criteria, shown in Table 3, although not all of these may be currently available on an inbred strain background. The NPcis model acts as a one‐allele model, because although two genes are mutated in the model, they are tightly linked on the same chromosome and so are inherited as a single allele. Inbred mouse models can be directly crossed to genotyped genetic reference panels to determine the location of modifier loci without further genotyping, since all of the genotypes of the progeny can be inferred from the parents.
Table 3.
Examples of “one allele/one generation” mouse models for mapping brain tumor genetic risk factors in genetic reference populations.
It is highly likely that mouse models using different driver mutations leading to brain cancer will identify different genetic risk factors, since different tumor initiating events may be modified by different factors. It will therefore be important to interpret findings in mouse models according to subtypes of human brain tumors. Careful characterization of mouse models of brain tumors will be important, so that findings can be validated in the most relevant subpopulation of human brain tumors. The Cancer Genome Atlas is characterizing human glioblastomas at the molecular level and will help to better align human glioblastoma subpopulations with the closest available mouse model. As an example, recent studies have found that a subset of glioblastomas carry mutations in NF1 48, 57 and genetic risk loci identified in the NPcis mouse model (61) may be most relevant in patients with this subset of tumors. As discussed above, attempts to validate results from specific mouse models across the entire human population may fail because of the swamping out of specific subpopulation effects.
“. . . A PIGMY AND A PATAGONIAN, A MOUSE AND A MAMMOTH . . .”
Thomas Jefferson noted in his “Notes on the State of Virginia”(33) that although animals of different shapes and sizes had much in common, “. . . all the manna in heaven would never raise the Mouse to the bulk of the Mammoth.” Although there is much to learn from comparisons of mouse models and human brain tumors to better understand risk factors, it is clear there will be species‐specific risk factors that cannot be discovered in model systems. Due to differences in metabolism, mice may respond to dietary and environmental risk factors differently than humans. The differences in the size of the mouse and its lifespan mean that mouse brain tumors are in some ways intrinsically different from human brain tumors. Nonetheless, studies of cancer in mice have demonstrated that many of the fundamental pathways are the same as in humans. It is important to note that mouse models provide a way of getting at some of the fundamental mechanisms underlying genetic risk using a more controlled experimental system. An understanding of these mechanisms can then guide studies in humans toward more focused questions. As an example, one may be able to define different genetic subgroups in the human population and use these subgroups to then examine the effects of environmental factors or diet. It will therefore be important to approach the understanding of risk for brain tumors from both human genome wide association studies, with the clear strengths of looking for strong effects on brain tumors in the human population, and from mouse complex trait studies, with the strengths of being able to isolate different variables and use a more controlled systems genetics approach to understand more complex genetic interactions.
IMPLICATIONS FOR UNDERSTANDING RISK FACTORS FOR BRAIN TUMORS
It has been recently recommended by the American Academy of Pediatrics that children between the ages of 2 and 10 be screened for high cholesterol, and that children with high cholesterol modify diet, lifestyle or take medications to lower cholesterol and reduce the risk of cardiovascular disease (14). This recommendation received a lot of media attention (56), both positive and negative, and it highlights how in very common diseases, such as heart disease and diabetes, medical research has been able to identify risk factors and implement early screening and early intervention in patient populations. It remains to be seen over the next generation how effective these interventions are at lowering the incidence of common diseases in the population. The ability to screen and intervene early depends on an understanding of the mechanism underlying the increased risk. By studying brain tumor risk in both humans and mice, it is hoped that markers of increased risk can be identified to facilitate early screening and that the mechanism can be understood to allow for intervention and reduction of risk.
REFERENCES
- 1. Ahlbom A, Feychting M, Cardis E, Elliott P (2007) Re: cellular telephone use and cancer risk: update of a nationwide Danish cohort study. J Natl Cancer Inst 99:655; author reply ‐6. [DOI] [PubMed] [Google Scholar]
- 2. Astrinidis A, Henske EP (2005) Tuberous sclerosis complex: linking growth and energy signaling pathways with human disease. Oncogene 24:7475–7481. [DOI] [PubMed] [Google Scholar]
- 3. Ballester R, Marchuk D, Boguski M, Saulino A, Letcher R, Wigler M, Collins F (1990) The NF1 locus encodes a protein functionally related to mammalian GAP and yeast IRA proteins. Cell 63:851–859. [DOI] [PubMed] [Google Scholar]
- 4. Bell DW, Varley JM, Szydlo TE, Kang DH, Wahrer DC, Shannon KE et al (1999) Heterozygous germ line hCHK2 mutations in Li‐Fraumeni syndrome. Science 286:2528–2531. [DOI] [PubMed] [Google Scholar]
- 5. Bethke L, Sullivan K, Webb E, Murray A, Schoemaker M, Auvinen A et al (2008) The common D302H variant of CASP8 is associated with risk of glioma. Cancer Epidemiol Biomarkers Prev 17:987–989. [DOI] [PubMed] [Google Scholar]
- 6. Bethke L, Webb E, Murray A, Schoemaker M, Johansen C, Christensen HC et al (2008) Comprehensive analysis of the role of DNA repair gene polymorphisms on risk of glioma. Hum Mol Genet 17:800–805. [DOI] [PubMed] [Google Scholar]
- 7. Bliskovsky V, Ramsay ES, Scott J, DuBois W, Shi W, Zhang S et al (2003) Frap, FKBP12 rapamycin‐associated protein, is a candidate gene for the plasmacytoma resistance locus Pctr2 and can act as a tumor suppressor gene. Proc Natl Acad Sci USA 100:14982–14987. [DOI] [PMC free article] [PubMed] [Google Scholar]
- 8. Brannan C, Perkins A, Vogel K, Ratner N, Nordlund M, Reid S et al (1994) Targeted disruption of the neurofibromatosis type 1 gene leads to developmental abnormalities in heart and various neural crest‐derived tissues. Genes Dev 8:1019–1029. [DOI] [PubMed] [Google Scholar]
- 9. Chesler EJ, Miller DR, Branstetter LR, Galloway LD, Jackson BL, Philip VM et al (2008) The Collaborative Cross at Oak Ridge National Laboratory: developing a powerful resource for systems genetics. Mamm Genome 19:382–389. [DOI] [PMC free article] [PubMed] [Google Scholar]
- 10. Churchill GA, Airey DC, Allayee H, Angel JM, Attie AD, Beatty J et al (2004) The Collaborative Cross, a community resource for the genetic analysis of complex traits. Nat Genet 36:1133–1137. [DOI] [PubMed] [Google Scholar]
- 11. Cichowski K, Shih T, Schmitt E, Santiago S, Reilly K, McLaughlin M et al (1999) Mouse models of tumor development in neurofibromatosis type I. Science 286:2172–2176. [DOI] [PubMed] [Google Scholar]
- 12. Cormier R, Hong K, Halberg R, Hawkins T, Richardson P, Mulherkar R et al (1997) Secretory phospholipase Pla2g2a confers resistance to intestinal tumorigenesis. Nat Genet 17:88–91. [DOI] [PubMed] [Google Scholar]
- 13. Crawford NP, Qian X, Ziogas A, Papageorge AG, Boersma BJ, Walker RC et al (2007) Rrp1b, a new candidate susceptibility gene for breast cancer progression and metastasis. PLoS Genet 3:e214. [DOI] [PMC free article] [PubMed] [Google Scholar]
- 14. Daniels SR, Greer FR (2008) Lipid screening and cardiovascular health in childhood. Pediatrics 122:198–208. [DOI] [PubMed] [Google Scholar]
- 15. De Andrade M, Barnholtz JS, Amos CI, Adatto P, Spencer C, Bondy ML (2001) Segregation analysis of cancer in families of glioma patients. Genet Epidemiol 20:258–270. [DOI] [PubMed] [Google Scholar]
- 16. Dietrich W, Lander E, Smith J, Moser A, Gould K, Luongo C et al (1993) Genetic identification of Mom‐1, a major modifier locus affecting Min‐induced intestinal neoplasia in the mouse. Cell 75:631–639. [DOI] [PubMed] [Google Scholar]
- 17. Ding H, Roncari L, Shannon P, Wu X, Lau N, Karaskova J et al (2001) Astrocyte‐specific expression of activated p21‐ras results in malignant astrocytoma formation in a transgenic mouse model of human gliomas. Cancer Res 61:3826–3836. [PubMed] [Google Scholar]
- 18. Donehower L, Harvey M, Slagle B, McArthur M, Montgomery C Jr, Butel J, Bradley A (1992) Mice deficient for p53 are developmentally normal but susceptible to spontaneous tumors. Nature 356:215–221. [DOI] [PubMed] [Google Scholar]
- 19. Ewart‐Toland A, Briassouli P, De Koning JP, Mao JH, Yuan J, Chan F et al (2003) Identification of Stk6/STK15 as a candidate low‐penetrance tumor‐susceptibility gene in mouse and human. Nat Genet 34:403–412. [DOI] [PubMed] [Google Scholar]
- 20. Friedman JM, Gutmann DH, MacCollin M, Riccardi VM (1999) Neurofibromatosis: Phenotype, Natural History, and Pathogenesis, 3rd edn. Johns Hopkins University Press: Baltimore. [Google Scholar]
- 21. Gould K, Luongo C, Moser A, McNeley M, Borenstein N, Shedlovsky A et al (1996) Genetic evaluation of candidate genes for the Mom1 modifier of intestinal neoplasia in mice. Genetics 144:1777–1785. [DOI] [PMC free article] [PubMed] [Google Scholar]
- 22. Gutmann D, Wood D, Collins F (1991) Identification of the neurofibromatosis type 1 gene product. Proc Natl Acad Sci USA 88:9658–9662. [DOI] [PMC free article] [PubMed] [Google Scholar]
- 23. Hallahan AR, Pritchard JI, Hansen S, Benson M, Stoeck J, Hatton BA et al (2004) The SmoA1 mouse model reveals that notch signaling is critical for the growth and survival of sonic hedgehog‐induced medulloblastomas. Cancer Res 64:7794–7800. [DOI] [PubMed] [Google Scholar]
- 24. Hamilton SR, Liu B, Parsons RE, Papadopoulos N, Jen J, Powell SM et al (1995) The molecular basis of Turcot's syndrome. N Engl J Med 332:839–847. [DOI] [PubMed] [Google Scholar]
- 25. Hardell L, Carlberg M, Soderqvist F, Hansson Mild K (2008) Meta‐analysis of long‐term mobile phone use and the association with brain tumours. Int J Oncol 32:1097–1103. [PubMed] [Google Scholar]
- 26. Hattori S, Maekawa M, Nakamura S (1992) Identification of neurofibromatosis type I gene product as an insoluble GTPase‐activating protein toward ras p21. Oncogene 7:481–485. [PubMed] [Google Scholar]
- 27. Hawes JJ, Tuskan RG, Reilly KM (2007) Nf1 expression is dependent on strain background: implications for tumor suppressor haploinsufficiency studies. Neurogenetics 8:121–130. [DOI] [PMC free article] [PubMed] [Google Scholar]
- 28. Hunter KW, Crawford NP (2008) The future of QTL mapping to diagnose disease in mice in the age of whole‐genome association studies. Annu Rev Genet [Epub ahead of print. [DOI] [PubMed] [Google Scholar]
- 29. Huson S, Hughes R (1994) The Neurofibromatoses: A pathogenetic and Clinical Overview. Chapman & Hall Medical: London. [Google Scholar]
- 30. Iraqi FA, Churchill G, Mott R (2008) The Collaborative Cross, developing a resource for mammalian systems genetics: a status report of the Wellcome Trust cohort. Mamm Genome 19:379–381. [DOI] [PubMed] [Google Scholar]
- 31. Jacks T, Remington L, Williams BO, Schmitt EM, Halachmi S, Bronson RT, Weinberg RA (1994) Tumor spectrum analysis in p53‐mutant mice. Current Biology 4:1–7. [DOI] [PubMed] [Google Scholar]
- 32. Jacks T, Shih TS, Schmitt EM, Bronson RT, Bernards A, Weinberg RA (1994) Tumour predisposition in mice heterozygous for a targeted mutation in Nf1. Nat Genet 7:353–361. [DOI] [PubMed] [Google Scholar]
- 33. Jefferson T (1787) Notes on the State of Virginia. Available at: http://etext.lib.virginia.edu/modeng/modengJ.browse.html (accessed September 22, 2008). [Google Scholar]
- 34. Kan P, Simonsen SE, Lyon JL, Kestle JR (2008) Cellular phone use and brain tumor: a meta‐analysis. J Neurooncol 86:71–78. [DOI] [PubMed] [Google Scholar]
- 35. Kiuru A, Lindholm C, Heinavaara S, Ilus T, Jokinen P, Haapasalo H et al (2008) XRCC1 and XRCC3 variants and risk of glioma and meningioma. J Neurooncol 88:135–142. [DOI] [PubMed] [Google Scholar]
- 36. Kwiatkowski DJ, Manning BD (2005) Tuberous sclerosis: a GAP at the crossroads of multiple signaling pathways. Hum Mol Genet 14 Spec No. 2:R251–258. [DOI] [PubMed] [Google Scholar]
- 37. Lai R, Crevier L, Thabane L (2005) Genetic polymorphisms of glutathione S‐transferases and the risk of adult brain tumors: a meta‐analysis. Cancer Epidemiol Biomarkers Prev 14:1784–1790. [DOI] [PubMed] [Google Scholar]
- 38. Lander ES, Linton LM, Birren B, Nusbaum C, Zody MC, Baldwin J et al (2001) Initial sequencing and analysis of the human genome. Nature 409:860–921. [DOI] [PubMed] [Google Scholar]
- 39. Lindblad‐Toh K, Winchester E, Daly MJ, Wang DG, Hirschhorn JN, Laviolette JP et al (2000) Large‐scale discovery and genotyping of single‐nucleotide polymorphisms in the mouse. Nat Genet 24:381–386. [DOI] [PubMed] [Google Scholar]
- 40. Malkin D (1994) p53 and the Li‐Fraumeni syndrome. Biochim Biophys Acta 1198:197–213. [DOI] [PubMed] [Google Scholar]
- 41. Malmer B, Iselius L, Holmberg E, Collins A, Henriksson R, Gronberg H (2001) Genetic epidemiology of glioma. Br J Cancer 84:429–434. [DOI] [PMC free article] [PubMed] [Google Scholar]
- 42. Malmer B, Henriksson R, Gronberg H (2003) Familial brain tumours‐genetics or environment? A nationwide cohort study of cancer risk in spouses and first‐degree relatives of brain tumour patients. Int J Cancer 106:260–263. [DOI] [PubMed] [Google Scholar]
- 43. Malmer B, Feychting M, Lonn S, Ahlbom A, Henriksson R (2005) p53 Genotypes and risk of glioma and meningioma. Cancer Epidemiol Biomarkers Prev 14:2220–2223. [DOI] [PubMed] [Google Scholar]
- 44. Malmer B, Haraldsson S, Einarsdottir E, Lindgren P, Holmberg D (2005) Homozygosity mapping of familial glioma in Northern Sweden. Acta Oncol 44:114–119. [DOI] [PubMed] [Google Scholar]
- 45. Malmer B, Adatto P, Armstrong G, Barnholtz‐Sloan J, Bernstein JL, Claus E et al (2007) GLIOGENE an International Consortium to Understand Familial Glioma. Cancer Epidemiol Biomarkers Prev 16:1730–1734. [DOI] [PubMed] [Google Scholar]
- 46. Malmer BS, Feychting M, Lonn S, Lindstrom S, Gronberg H, Ahlbom A et al (2007) Genetic variation in p53 and ATM haplotypes and risk of glioma and meningioma. J Neurooncol 82:229–237. [DOI] [PubMed] [Google Scholar]
- 47. Martin G, Viskochil D, Bollag G, McCabe P, Crosier W, Conroy L et al (1990) The GAP‐related domain of the neurofibromatosis type 1 gene product interacts with ras p21. Cell 63:843–849. [DOI] [PubMed] [Google Scholar]
- 48. McLendon R, Friedman A, Bigner D, Van Meir EG, Brat DJ, Mastrogianakis M et al (2008) Comprehensive genomic characterization defines human glioblastoma genes and core pathways. Nature [Epub ahead of print. [DOI] [PMC free article] [PubMed] [Google Scholar]
- 49. Morahan G, Balmer L, Monley D (2008) Establishment of “The Gene Mine”: a resource for rapid identification of complex trait genes. Mamm Genome 19:390–393. [DOI] [PubMed] [Google Scholar]
- 50. Mural RJ, Adams MD, Myers EW, Smith HO, Miklos GL, Wides R et al (2002) A comparison of whole‐genome shotgun‐derived mouse chromosome 16 and the human genome. Science 296:1661–1671. [DOI] [PubMed] [Google Scholar]
- 51. Muscat JE, Hinsvark M, Malkin M (2006) Mobile telephones and rates of brain cancer. Neuroepidemiology 27:55–56. [DOI] [PubMed] [Google Scholar]
- 52. Nadeau JH, Singer JB, Matin A, Lander ES (2000) Analysing complex genetic traits with chromosome substitution strains [published erratum appears in Nat Genet 2000 May]. Nat Genet 24:221–225. [DOI] [PubMed] [Google Scholar]
- 53. O'Neill BP, Blondal H, Yang P, Olafsdottir GH, Sigvaldason H, Jenkins RB et al (2002) Risk of cancer among relatives of patients with glioma. Cancer Epidemiol Biomarkers Prev 11: 921–924. [PubMed] [Google Scholar]
- 54. Okcu MF, Selvan M, Wang LE, Stout L, Erana R, Airewele G et al (2004) Glutathione S‐transferase polymorphisms and survival in primary malignant glioma. Clin Cancer Res 10:2618–2625. [DOI] [PubMed] [Google Scholar]
- 55. Park YG, Zhao X, Lesueur F, Lowy DR, Lancaster M, Pharoah P et al (2005) Sipa1 is a candidate for underlying the metastasis efficiency modifier locus Mtes1. Nat Genet 37:1055–1062. [DOI] [PMC free article] [PubMed] [Google Scholar]
- 56. Parker‐Pope T (2008) Cholesterol screening is urged for young. New York Times. Available at: http://query.nytimes.com/gst/fullpage.html?res=9503E4DD133FF934A35754C0A96E9C8B63.
- 57. Parsons DW, Jones S, Zhang X, Lin JC, Leary RJ, Angenendt P et al (2008) An integrated genomic analysis of human glioblastoma multiforme. Science 321:1807–1812. [DOI] [PMC free article] [PubMed] [Google Scholar]
- 58. Paunu N, Lahermo P, Onkamo P, Ollikainen V, Rantala I, Helen P et al (2002) A novel low‐penetrance locus for familial glioma at 15q23‐q26.3. Cancer Res 62:3798–3802. [PubMed] [Google Scholar]
- 59. Pennisi E (2007) Breakthrough of the year. Human genetic variation. Science 318:1842–1843. [DOI] [PubMed] [Google Scholar]
- 60. Reilly KM, Loisel DA, Bronson RT, McLaughlin ME, Jacks T (2000) Nf1;Trp53 mutant mice develop glioblastoma with evidence of strain‐specific effects. Nat Genet 26:109–113. [DOI] [PubMed] [Google Scholar]
- 61. Reilly KM, Tuskan RG, Christy E, Loisel DA, Ledger J, Bronson RT et al (2004) Susceptibility to astrocytoma in mice mutant for Nf1 and Trp53 is linked to chromosome 11 and subject to epigenetic effects. Proc Natl Acad Sci USA 101:13008–13013. [DOI] [PMC free article] [PubMed] [Google Scholar]
- 62. Reilly KM, Broman KW, Bronson RT, Tsang S, Loisel DA, Christy ES et al (2006) An imprinted locus epistatically influences Nstr1 and Nstr2 to control resistance to nerve sheath tumors in a neurofibromatosis type 1 mouse model. Cancer Res 66:62–68. [DOI] [PMC free article] [PubMed] [Google Scholar]
- 63. Roberts A, Pardo‐Manuel de Villena F, Wang W, McMillan L, Threadgill DW (2007) The polymorphism architecture of mouse genetic resources elucidated using genome‐wide resequencing data: implications for QTL discovery and systems genetics. Mamm Genome 18:473–481. [DOI] [PMC free article] [PubMed] [Google Scholar]
- 64. Ruivenkamp CA, Van Wezel T, Zanon C, Stassen AP, Vlcek C, Csikos T et al (2002) Ptprj is a candidate for the mouse colon‐cancer susceptibility locus Scc1 and is frequently deleted in human cancers. Nat Genet 31:295–300. [DOI] [PubMed] [Google Scholar]
- 65. Sachidanandam R, Weissman D, Schmidt SC, Kakol JM, Stein LD, Marth G et al (2001) A map of human genome sequence variation containing 1.42 million single nucleotide polymorphisms. Nature 409:928–933. [DOI] [PubMed] [Google Scholar]
- 66. Schuz J, Jacobsen R, Olsen JH, Boice JD Jr, Johansen JK, McLaughlin C (2006) Cellular telephone use and cancer risk: update of a nationwide Danish cohort. J Natl Cancer Inst 98:1707–1713. [DOI] [PubMed] [Google Scholar]
- 67. Schwartzbaum J, Ahlbom A, Malmer B, Lonn S, Brookes AJ, Doss H et al (2005) Polymorphisms associated with asthma are inversely related to glioblastoma multiforme. Cancer Res 65:6459–6465. [DOI] [PMC free article] [PubMed] [Google Scholar]
- 68. Schwartzbaum JA, Ahlbom A, Lonn S, Malmer B, Wigertz A, Auvinen A et al (2007) An international case‐control study of interleukin‐4Ralpha, interleukin‐13, and cyclooxygenase‐2 polymorphisms and glioblastoma risk. Cancer Epidemiol Biomarkers Prev 16:2448–2454. [DOI] [PubMed] [Google Scholar]
- 69. Schwartzbaum JA, Ahlbom A, Lonn S, Warholm M, Rannug A, Auvinen A et al (2007) An international case‐control study of glutathione transferase and functionally related polymorphisms and risk of primary adult brain tumors. Cancer Epidemiol Biomarkers Prev 16:559–565. [DOI] [PubMed] [Google Scholar]
- 70. Singer JB, Hill AE, Nadeau JH, Lander ES (2005) Mapping quantitative trait loci for anxiety in chromosome substitution strains of mice. Genetics 169:855–862. [DOI] [PMC free article] [PubMed] [Google Scholar]
- 71. Stemmer‐Rachamimov AO, Louis DN, Nielsen GP, Antonescu CR, Borowsky AD, Bronson RT et al (2004) Comparative pathology of nerve sheath tumors in mouse models and humans. Cancer Res 64:3718–3724. [DOI] [PubMed] [Google Scholar]
- 72. Threadgill DW, Hunter KW, Williams RW (2002) Genetic dissection of complex and quantitative traits: from fantasy to reality via a community effort. Mamm Genome 13:175–178. [DOI] [PubMed] [Google Scholar]
- 73. Trizna Z, De Andrade M, Kyritsis AP, Briggs K, Levin VA, Bruner JM et al (1998) Genetic polymorphisms in glutathione S‐transferase mu and theta, N‐acetyltransferase, and CYP1A1 and risk of gliomas. Cancer Epidemiol Biomarkers Prev 7:553–555. [PubMed] [Google Scholar]
- 74. Venter JC, Adams MD, Myers EW, Li PW, Mural RJ, Sutton GG et al (2001) The sequence of the human genome. Science 291:1304–1351. [DOI] [PubMed] [Google Scholar]
- 75. Vogel K, Klesse L, Velasco‐Miguel S, Meyers K, Rushing E, Parada L (1999) Mouse tumor model for neurofibromatosis type 1. Science 286:2176–2179. [DOI] [PMC free article] [PubMed] [Google Scholar]
- 76. Wade CM, Kulbokas EJ 3rd, Kirby AW, Zody MC, Mullikin JC, Lander ES et al (2002) The mosaic structure of variation in the laboratory mouse genome. Nature 420:574–578. [DOI] [PubMed] [Google Scholar]
- 77. Wang LE, Bondy ML, Shen H, El‐Zein R, Aldape K, Cao Y et al (2004) Polymorphisms of DNA repair genes and risk of glioma. Cancer Res 64:5560–5563. [DOI] [PubMed] [Google Scholar]
- 78. Waterston RH, Lindblad‐Toh K, Birney E, Rogers J, Abril JF, Agarwal P et al (2002) Initial sequencing and comparative analysis of the mouse genome. Nature 420:520–562. [DOI] [PubMed] [Google Scholar]
- 79. Weiss WA, Burns MJ, Hackett C, Aldape K, Hill JR, Kuriyama H et al (2003) Genetic determinants of malignancy in a mouse model for oligodendroglioma. Cancer Res 63:1589–1595. [PubMed] [Google Scholar]
- 80. Wiemels JL, Wiencke JK, Kelsey KT, Moghadassi M, Rice T, Urayama KY et al (2007) Allergy‐related polymorphisms influence glioma status and serum IgE levels. Cancer Epidemiol Biomarkers Prev 16:1229–1235. [DOI] [PubMed] [Google Scholar]
- 81. Wigertz A, Lonn S, Schwartzbaum J, Hall P, Auvinen A, Christensen HC et al (2007) Allergic conditions and brain tumor risk. Am J Epidemiol 166:941–950. [DOI] [PubMed] [Google Scholar]
- 82. Xu G, Lin B, Tanaka K, Dunn D, Wood D, Gesteland R et al (1990) The catalytic domain of the neurofibromatosis type 1 gene product stimulates ras GTPase and complements ira mutants of S. cerevisiae. Cell 63:835–841. [DOI] [PubMed] [Google Scholar]
- 83. Xu G, O'Connell P, Viskochil D, Cawthorn R, Robertson M, Culver M et al (1990) The neurofibromatosis type 1 gene encodes a protein related to GAP. Cell 62:599–608. [DOI] [PubMed] [Google Scholar]
- 84. Youngren KK, Coveney D, Peng X, Bhattacharya C, Schmidt LS, Nickerson ML et al (2005) The Ter mutation in the dead end gene causes germ cell loss and testicular germ cell tumours. Nature 435:360–364. [DOI] [PMC free article] [PubMed] [Google Scholar]
- 85. Zhang S, Ramsay ES, Mock BA (1998) Cdkn2a, the cyclin‐dependent kinase inhibitor encoding p16INK4a and p19ARF, is a candidate for the plasmacytoma susceptibility locus, Pctr1. Proc Natl Acad Sci USA 95:2429–2434. [DOI] [PMC free article] [PubMed] [Google Scholar]