

Abstract
The increasing use of cone-beam computed tomography (CBCT) requires changes in our diagnosis and treatment planning methods as well as additional training. The standard for digital computed tomography images is called digital imaging and communications in medicine (DICOM). In this article we discuss the following concepts: visualization of CBCT images in orthodontics, measurement in CBCT images, creation of 2-dimensional radiographs from DICOM files, segmentation engines and multimodal images, registration and superimposition of 3-dimensional (3D) images, special applications for quantitative analysis, and 3D surgical prediction. CBCT manufacturers and software companies are continually working to improve their products to help clinicians diagnose and plan treatment using 3D craniofacial images.
The numbers of clinicians using 3-dimensional (3D) records during diagnosis and treatment planning stages are increasing steadily. Cone-beam computed tomography (CBCT) scanners are becoming more efficient with reduced acquisition time, and software packages developed to process, manage, and analyze 3D images are also undergoing a rapid growth phase. The management of CBCT images differs from that of conventional 2-dimensional (2D) images. Most orthodontists were trained in the 2D era, and the transition to 3D images requires a learning stage. With today’s hardware and software improvements, the learning curve is not as steep, but some basic concepts should be taken into account with this new technology.
The purpose of this article is to give the clinician some core concepts for 3D diagnosis and treatment planning. The current commercial software applications for clinical management of craniofacial CBCT images are presented and compared with the current standards. The concepts presented here are applicable regardless of the constantly changing software applications.
DICOM FILES
In the early 1980s, the American College of Radiology and the National Electrical Manufacturers Association joined forces to standardize the coding of images obtained through computed tomography and magnetic resonance imaging. After successive improvements, in 1993, the term digital imaging and communications in medicine (DICOM) was adopted.1 A DICOM record consists of (1) a DICOMDIR file, which includes patient information, specific information about image acquisition, and a list of images that correspond to axial slices forming the 3D image; and (2) a number of sequentially coded images that correspond to the axial slices. (When those axial slices are combined in the correct order they form the 3D image) (Fig 1).
Fig 1. Example of a DICOM record.
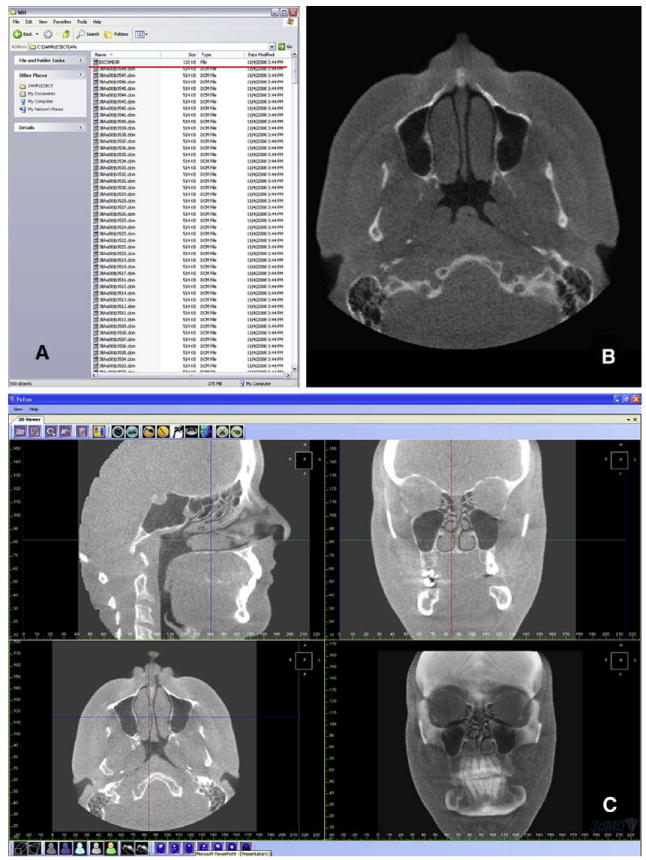
A, DICOMDIR file (red underline) and sequential axial slices; B, an axial slice; C, reformatted stack of slices allows the user to scroll in any direction (saggital, coronal, axial). Three-dimensional view of the CBCT volume is also available (3dMDvultus Software).
Once a CBCT scan has been acquired, some basic handling and measurements on the data set can be performed with the software provided by the manufacturers. CBCT manufacturers also offer the option through their software to convert their proprietary formats into an exportable DICOM file; this is a first step in managing 3D CBCT information. When ordering a CBCT acquisition through an imaging laboratory, this is normally performed at the laboratory, and the patient or the clinician is given a compact disk containing the DICOM file. If the clinician owns a CBCT scanner, its software allows for exporting images in DICOM format. Further research is needed to validate the process of converting images from a proprietary format into DICOM format.
The tools for visualization, landmarking, measurement, registration, superimposition, and computation of 3D images are different from those used in their counterpart 2D images.2 The information obtained through 3D visualization in orthodontics has not been completely linked to a diagnostic or prognostic meaning. For instance, when we observe a differently shaped mandibular condyle, it does not necessarily mean pathology. Further research should establish the links between observed morphology, pathology, pathogenesis, and response to treatment.
The legal implications of acquiring a CBCT image are also important. More information than the conventional diagnostic records is obtained through a full 3D image of the head and neck, leading to responsibility and accountability issues regarding the diagnosis of pathology outside the region of interest. Whether the orthodontist or a radiologist should be accountable for any pathology beyond the region of interest is a current controversy beyond the scope of this article.3
VISUALIZATION OF CBCT IMAGES
Among the increasing number of software packages dedicated to managing and analyzing DICOM images, we focus on 3 with special emphasis in orthodontics. In alphabetical order they are 3dMDvultus software (3dMD, Atlanta, Ga), Dolphin Imaging (Dolphin Imaging, Chatsworth, Calif), and InVivoDental (Anatomage, San Jose, Calif). There are other software packages and applications (even freeware) available to manage DICOM files.
A 3D image is composed of a stack of 2D images or slices. In a similar fashion that a 2D image is composed of pixels, a 3D image is composed of voxels. Each voxel has a gray-level value based on indirect calculation of the amount of radiation absorbed or captured by the charge-coupled device and calculated through a filtered-back projection algorithm. Visualization is based on a threshold filter. This filter assigns a binary value, either transparent or visible, to each voxel based on its gray-level value. The user defines the critical value that splits the voxels into visible and invisible. The result is a rendered image on the screen composed of all visible voxels.
The operator can visualize the data set by looking at the stack of slices or the rendered 3D image. Computers can reformat the 3D image, allowing the operator to scroll through these 2D images in any direction (Fig 1, C). The most common ones are sagittal, coronal, and axial. All 3 orthodontic programs allow scrolling through the stack of images. A cursor represented by 2 crossing lines indicates the precise localization in virtual space. The data set can also be rotated, panned, or zoomed to allow visualization of the region of interest; at any angle, scale, or position, a rendered image can be created. Multiple threshold filters can be applied to the same image to distinguish between tissues of different density—eg, soft and hard tissues. Transparency can also be applied to allow visualization of hard tissues through the soft tissues (Fig 2). Clipping tools are also available. These allow for isolation and visualization of specific regions—eg, the mandibular condyles. Dolphin Imaging allows for 2 threshold filters: for hard tissues and soft tissues. Transparency can be applied to visualize soft-tissue thickness at various points. InVivoDental allows the user to modify the threshold values through preloaded filters. Additionally, segmentations can be created. The 3dMDvultus software also has threshold filters, in addition to the ability to create segmentations to isolate and define regions of interest (described later).
Fig 2. Different visualization modes and interfaces of 3 programs.
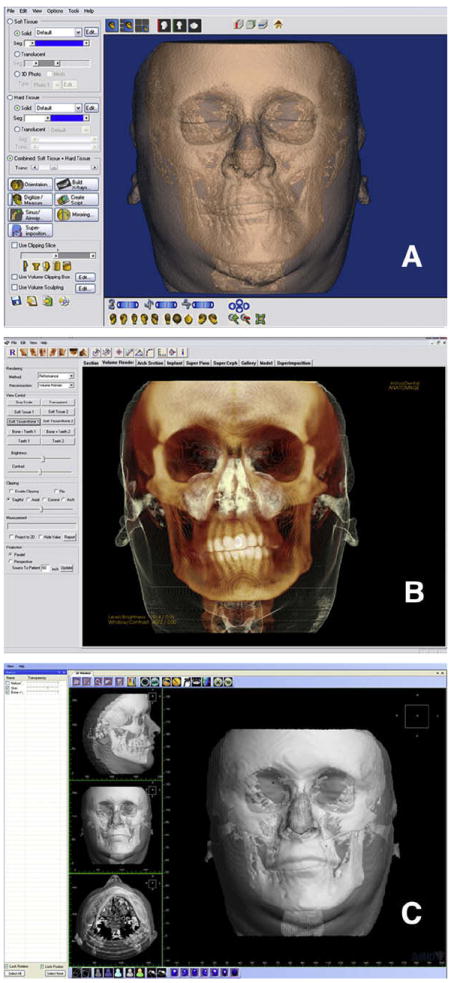
A, Dolphin Imaging interface, with thresholding filters applied to visualize both hard and soft tissues, and a semitransparency applied to the soft tissue to visualize the hard tissue underneath; B, InVivoDental volume interface, with modified thresholding filters applied by a preset visualization “Soft tissue + Bone 1”; C, 3dMDvultus software interface, with hard- and soft-tissue surface models created (segmentations) and a semi-transparency applied to the soft-tissue segmentation.
It is crucial to understand that the rendered image is the result of a user-entered threshold value. The visual perception of the operator defines what is bone and what is soft tissue, and many factors can affect this: contrast of the image, noise in the image, individual visual perception and prior knowledge of anatomy among others. For a qualitative assessment, these rendered images are appropriate, but, for a quantitative assessment, they present many challenges that are discussed in the next section.
MEASUREMENT IN CBCT IMAGES
In 2D radiographs, distances and angles are measured between landmarks. These landmarks are defined by the superimposition of the projection of different structures. This is a property of transmission radiographs. Landmarks can defined as an inflection point in a curved line, the geometric center of a structure, superimposition of projection of different structures, the tip of a structure, or the crossing point of 2 planes. Most landmarks cannot be visualized or are difficult to locate on a curved surface in a 3D image. There are no clear operational definitions for specific cephalometric landmarks in the 3 planes of space.4 A second challenge is that the rendered image depends on many factors, including contrast of the image, movement during acquisition, presence of metal that creates noise, overall signal-to-noise ratio of the image, and the threshold filters applied by the operator. Because of all these factors, it make sense that the landmarks should be located in the stack of slices rather than in the 3D rendered volume.5
Many studies have assessed the accuracy and reliability of measurements on CBCT images. Those studies can be classified based on 2 criteria. The first is whether they use radiopaque markers or structures of known geometry. This classification yields 2 groups: when landmark location does not need anatomic operational definitions, and when anatomic definitions are important, and another interexaminer or intraexaminer factor (landmark location) is introduced. The second classification, applicable to both groups, is based on where the landmarks were located. According to this second criterion, 3 groups are established: (1) landmarks located in the stack of slices, (2) landmarks located on a segmented surface (more later), and (3) landmarks located on the rendered image.
Studies from group 1 report good accuracy regardless of where the measurements were made. For most measurements, there were no statistically significant differences compared with the gold standard (measurements with a caliper or structures of known geometry). Some measurements had statistically significant differences, but those were small and not clinically significant.6-11 Studies from group 2 report subclinical accuracy when landmarks were located on segmentations or in the stack of slices, 12,13 but not when they were located on the rendered image.14 When all studies are considered regardless of their classification, reliability in measurements and landmark identification in CBCT images was reported to be good to very good.5,10,14,15
Based on the available evidence, we can conclude that it is more accurate to locate landmarks in the stack of slices or on a segmented surface; this is possible in all 3 software packages. Landmarks located in the rendered volume must be carefully evaluated.
CREATION OF 2D RADIOGRAPHS FROM DICOM FILES
Longitudinal growth databases are no longer allowed for ethical reasons, and there are no normative data in 3 dimensions. However, available 2D growth databases can be used to compare with current clinical data.16 To be able to compare the new modalities with our current databases, algorithms have been created to extract information from the CBCT image and simulate a conventional cephalogram, panoramic projection, tomographic image of the temporomandibular joint, and posteroanterior cephalogram. Cephalogram registration and superimposition are the most common and efficient ways to quantitatively assess growth and treatment changes. All 3 software packages allow for the extraction of synthetic radiographic projections. The procedure starts by orienting the patient’s head image in virtual space similarly to what the technician does in a cephalostat (Fig 3). The advantage of this virtual orientation is the possibility of using a semitransparent image to match bilateral structures and obtain the correct head rotation.
Fig 3. Creation of synthetic cephalograms.
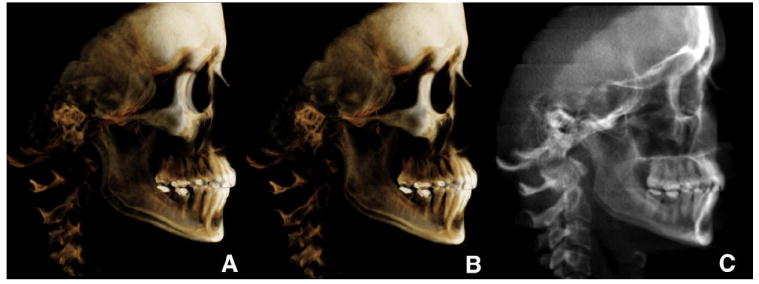
A, unoriented volume; B, oriented to obtain the correct head rotation (note the difference between the orbits and zygomatic bone); C, once oriented, the cephalogram was generated or has been generated (InVivoDental).
Measurements performed on CBCT synthetic cephalograms have proven to be on average similar to those on conventional cephalograms.17-20 Some statistically significant differences were found between some measurements, but no clinically significant differences were found. When both modalities—conventional and CBCT synthetic cephalograms—are combined in the same longitudinal study, the researcher must account for an increase in landmark error calculation.21
For the creation of CBCT synthetic cephalograms, Dolphin Imaging allows the user to choose an orthogonal or a perspective projection type, and, with the latter, the projection center can be repositioned to match the transporionic axis. Once created, many visualization filters can be applied to the synthetic cephalogram. The 3 companies are now working to improve the options offered by the cephalogram-creation module. The creation of CBCT synthetic panoramic radiographs starts by delineating the focal trough, its upper and lower limits, and its thickness.
SEGMENTATION ENGINES AND MULTIMODAL IMAGES
The segmentation process in medical imaging could be defined as the construction of 3D virtual surface models (called segmentations) to best match the volumetric data. There are many different segmentation processes, and this topic is beyond the scope of this article. For more information, the reader is referred to the study of Yushkevich et al.22 The reader must distinguish between a virtual surface and a rendered image. The importance of having a segmentation engine in the software package is twofold. First, it allows the user to export anatomic models in a nonproprietary format; this information can be used in research and will always be accessible regardless of constantly changing software applications. The second advantage is the option of loading anatomic models—segmentations—in a non-proprietary format into the imaging software interface; that allows combining different modalities with the CBCT images. An example is combining digital models obtained through laser or optical scanners with the CBCT data and soft-tissue meshes obtained through 3D cameras. These multimodal images are the foundation of digital dentistry, rapid prototyping, and computer-aided design and computer-aided manufacturing applications.
Currently, InVivoDental offers a segmentation engine that allows the user to export anatomic models. Dolphin Imaging allows importing 3D soft-tissue meshes to be combined with the CBCT data. The 3dMDvultus software has a segmentation engine, which performs segmentations by thresholding and smoothing filters (Fig 2, C). The 3dMDvultus software also allows for both exporting and importing segmentations.
REGISTRATION AND SUPERIMPOSITION OF 3D IMAGES
Traditionally, the best and almost only way to quantitatively assess changes in orthodontics was cephalogram superimpositions. Stable structures described by Bjork, 23 Bjork and Skieller, 24-26 and others 27 are used as registration and orientation landmarks. Changes can be described relative to those reference structures.28 Registration can be defined as the process of combining 2 or more images from different time points, each with its own coordinate system, into a common coordinate system. Today, it is possible to register CBCT records acquired at different time points and analyze changes due to treatment, growth, aging, and relapse in 3 dimensions.
The 3 software packages can register and superimpose CBCT images from different time points in the same virtual space. The procedure differs slightly between Dolphin Imaging and InVivoDental and 3dMDvultus software. In the first 2 programs, the process includes 5 steps.
The user loads the 2 CBCT images from different time points.
The user inputs homologous landmarks found in both images. Those landmarks will be the registration references and must be anatomically stable between time points.
Once the landmarks are input, the program computes the best fit between the 2 sets of landmarks in each CBCT image. A transformation matrix is obtained (rotation and translation). The program then relocates 1 CBCT image relative to the other based on this transformation matrix, and the result is that both images share the same coordinate system.
Because of the difficulty of locating stable landmarks in curved surfaces, especially along the cranial base, both programs allow for manually refining the registration process until most cranial base structures match.
Once the images are registered, the user can evaluate changes in the rendered volume with semitransparencies or at the stack of slices. Changes can be described relative to the registration landmarks (Fig 4, A, B, C, G, and H).
Fig 4. Registration and superimposition of sequential CBCT images.
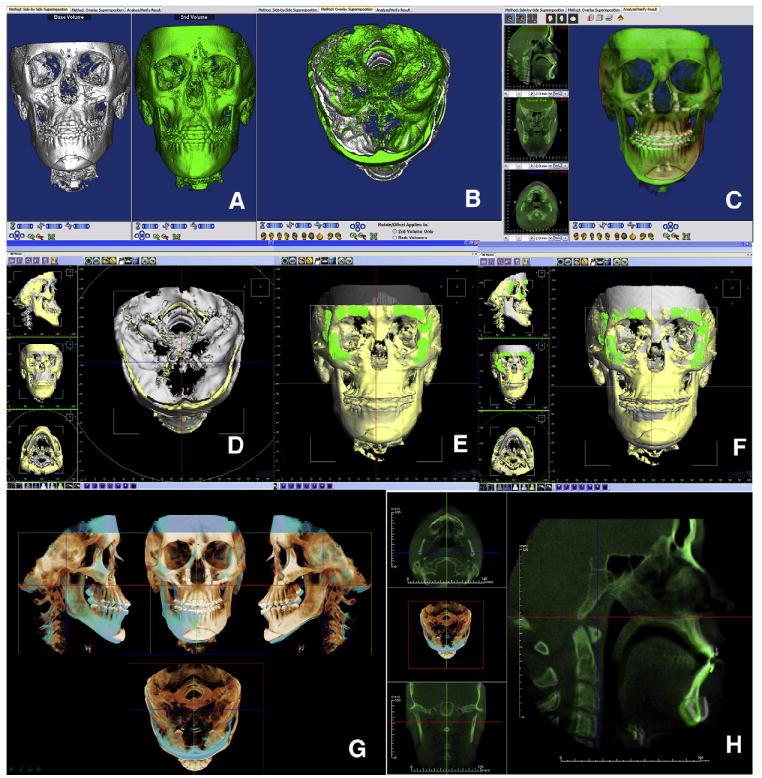
A, Dolphin Imaging uses a landmark-based registration process that allows the user to manually refine the relative position of the CBCT images until, B, stable structures are matching. C, Once registered, semitransparency visualization allows the user to measure and assess changes. D, The 3dMDvultus software uses a surface-based registration process in which the first 2 images are manually positioned; E, anatomically stable surfaces are selected, and the program refines the registration by matching those surfaces; once registered, changes can be determined. F, Surgical outcome assessment—in this case, maxillary advancement, autorotation of the mandible and genioplasty—can be measured and visualized in the volumetric rendered image and the stack of slices. G and H, Different InVivoDental visualizations of the registered volumes.
The 3dMDvultus software operates in a slightly different manner; the process also consists of 5 steps.
The images are loaded into the software interface, and segmentations are created.
The user unlocks the rotation and translation parameters of 1 segmentation.
The user performs an initial manual registration to approximate the surfaces as much as possible.
Anatomically stable surfaces must be selected by the user. In this case, the registration is surface-based, rather than landmark-based. The program performs a surface-to-surface registration to refine the initial manual registration.
Once the segmentations are registered, the user can visualize them by means of semitransparencies and assess changes in the segmentations, the rendered volume, or the stack of slices. Change can be described relative to the registration surfaces (Fig 4, D through F).
We believe the latter registration process offers a more precise registration, because it is based on surfaces composed of thousands of landmarks instead of a few landmarks selected by the user; however, it still depends on the precision of the 3D surface models. Researchers at the University of North Carolina have developed a registration process that does not depend on the precision of the 3D surface models. This process compares voxel by voxel between gray-level CBCT images. The region to be compared is defined by the user. A transformation matrix (translation and rotation) is computed and applied to a CBCT image.2,29
SPECIAL APPLICATIONS OF QUANTITATIVE ANALYSIS
Today, it is easier to analyze the shape and contours of airway passages in 3 dimensions. All 3 programs have tools to measure airway volume. This will open the door to research on airway volume changes with growth, treatment, and pathology. InVivoDental allows for segmenting the airway passages and measuring their volumes. Dolphin Imaging has a tool for segmenting the airway and allows for careful visual examination of airway contours and shapes. Airway volume can also be calculated (Fig 5). The 3dMDvultus software computes airway volume and allows visualization of the cross-section images along the airway. This software detects the smallest cross-sectional area or airway stenosis. A virtual endoscopy is also a feature of this program.
Fig 5.
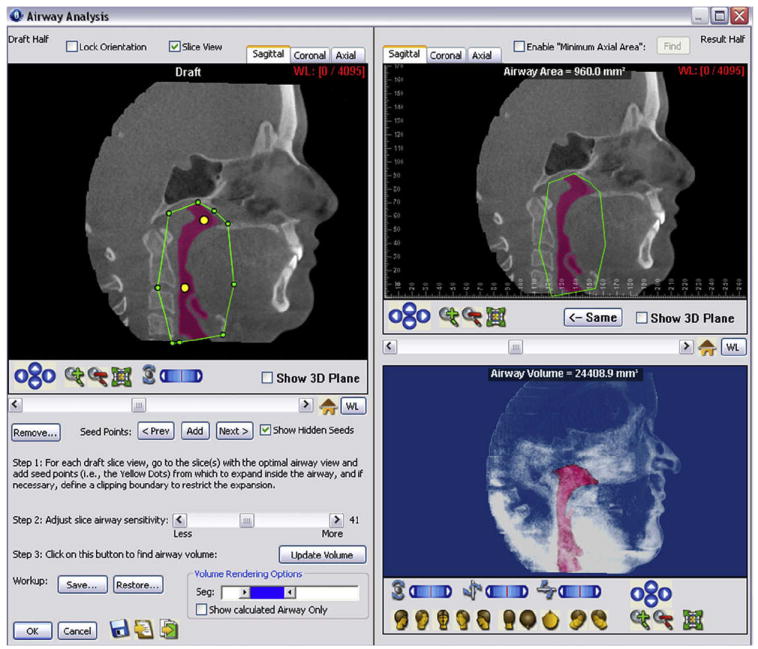
Airway analysis module by Dolphin Imaging: at the upper right corner, the airway passages are segmented by initialization spheres. Both area and volume can be calculated. The airway segmentation can be rotated, panned, and zoomed in space.
An implant simulation module is offered by InVivo-Dental software. The program allows the user to visualize and measure the alveolar bone and sections of the dental arch. The operator can then simulate the placement of a dental implant or an orthodontic temporary skeletal anchorage device (Fig 6, A). The size and manufacturer of the implant are chosen by the operator. The implant and its relationship to the bone and neighboring roots can be assessed and measured in both the 3D volume view and the arch section slices (Fig 6, B and C). The position of the implant can be controlled in 3 dimensions. On the left lower corner, a color map representing bone density around the implant is shown.
Fig 6. Implant simulation and arch section module in InVivoDental.
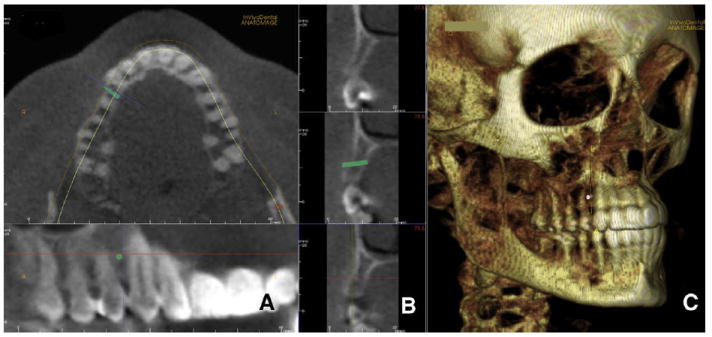
A, a microimplant is virtually placed between the roots of the maxillary right canine and first premolar; B, cortical bone thickness can be measured as well as total bone; C, InVivoDental also allows 3D visualization to assess anatomic relationships. The position on the implant can be modified with 6 degrees of freedom.
Dolphin Imaging allows combining the CBCT data with either a 3D or a 2D photograph. The registration is performed by landmark selection. The user locates homologous landmarks in both the CBCT volume and the photograph. The program then matches those landmarks, registering the 2 records (Fig 7).
Fig 7. Matching a 2D picture on the 3D soft-tissue volume.
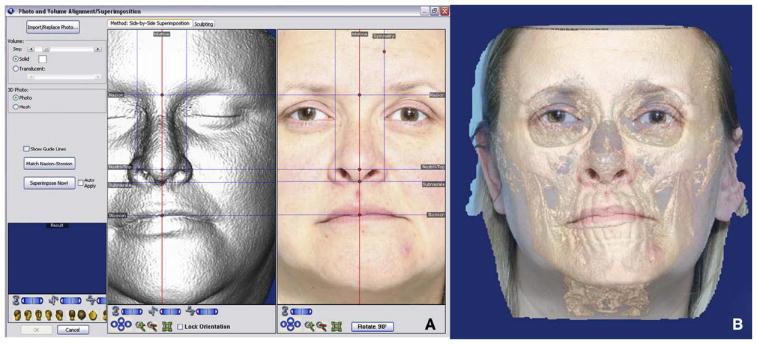
A, homologous landmarks are located in the volume and the 2D picture; B, Dolphin Imaging registers both images to create a multimodal image. Note the eye difference between the 2 modalities. There might be other, less-obvious areas of discrepancy between photographic and CBCT data.
InVivoDental also has this feature. Users or company technicians combine the CBCT volume with the photograph. Segmentations of the dental arches from the CBCT can also be incorporated into this anatomic model.
The 3dMDvultus software uses a surface-to-surface registration process to combine CBCT volume with the 3D photograph. The soft tissue must be segmented based on the CBCT volume. The photograph is then loaded, approximated, and registered.
All methods are an approximation of actual anatomic truth. Because the CBCT image and the photograph are not taken at the same time, the soft tissue extracted from the CBCT data is not exactly the same as the soft tissue obtained through 3D photography. Many variables could be involved: differences in head position, muscular tone, movement during CBCT acquisition, and circadian rhythms. In the future, we hope that CBCT acquisition will be faster to prevent patient motion during acquisition (respiratory movements, deglutition, involuntary movements), and that the CBCT and photograph can be taken at the same time and in natural head position.
Three-dimensional surgical prediction
The 3dMDvultus software released a 3D surgical prediction module. This process encompasses 6 steps.
The CBCT volume is loaded, and hard- and soft-tissue segmentations are created (Fig 8, A).
A 3D photograph could be combined with the CBCT segmentations (optional).
Virtual cuts are made to simulate the actual surgical cuts (Fig 8, B).
The bone segments are repositioned (translated and rotated) to the desired position (Fig 8, C).
The program applies soft-tissue algorithms to calculate the soft-tissue changes.
The user visualizes and measures the changes (Fig 8, D and E).
Fig 8. Three-dimensional surgical simulation by the 3dMDvultus software.
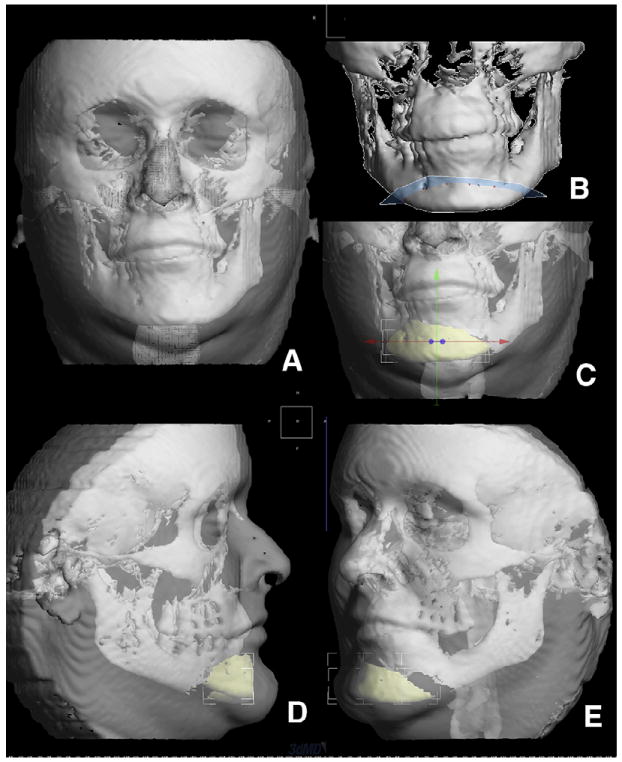
A, surface models were created for both hard and soft tissues; B, virtual surgical osteotomies are performed—here, a lower border osteotomy (genioplasty); C, the chin segment is slid to the left to correct the asymmetry and also moved forward for illustration purposes; D and E, changes predicted in the soft tissues.
These soft-tissue algorithms are based on series of patients before and after surgery. Because of the great variability in soft-tissue response to surgical changes and the huge amount of data points predicted on the skin surface, a large sample is needed to obtain valid algorithms. It is also important to be consistent during sample collection; timing of records acquisition, surgical procedure, patient’s age, sex, ethnicity, and head position are variables that should be controlled for.
CONCLUSIONS
The soft-tissue paradigm has paved the road toward 3D diagnosis, treatment planning, and computer-aided design and computer-aided manufacturing orthodontics. Because of the advances in both CBCT scanners and software designed to manage CBCT data, it is possible to take advantage of CBCT information in a clinical setting. Clinicians should be careful in 2 areas: first, most visual information gathered with these systems has not been yet linked to a clear diagnosis classification. Further research is needed in the interpretation of orthodontic information from CBCT data. Second, some available tools have not been validated yet, and studies to assess accuracy and precision are mandatory before these applications become standard. Companies are investing huge amounts of time and money to improve their programs, and we as clinicians should use them and give the companies feedback; their success affects our patients and our success.
This is an extraordinary and interesting time in orthodontics and dentistry; digital dentistry is around the corner. In a few years, all specialties will have common goals and be able to interact, predict results, and improve their outcomes by taking advantage of the virtual patient. We hope that this introductory article will clarify some 3D image analysis concepts and encourage the reader to use this fascinating technology.
Footnotes
The authors report no commercial, proprietary, or financial interest in the products or companies described in this article.
References
- 1.DICOM digital imaging and communications in medicine. Rosslyn,Va: National Electrical Manufacturers Association (NEMA); 2008. [Google Scholar]
- 2.Cevidanes LH, Styner MA, Proffit WR. Image analysis and superimposition of 3-dimensional cone-beam computed tomography models. Am J Orthod Dentofacial Orthop. 2006;129:611–8. doi: 10.1016/j.ajodo.2005.12.008. [DOI] [PMC free article] [PubMed] [Google Scholar]
- 3.Jerrold L. Liability regarding computerized axial tomography scans. Am J Orthod Dentofacial Orthop. 2007;132:122–4. doi: 10.1016/j.ajodo.2007.03.016. [DOI] [PubMed] [Google Scholar]
- 4.Bookstein FL. Landmark methods for forms without landmarks: morphometrics of group differences in outline shape. Med Image Anal. 1997;1:225–43. doi: 10.1016/s1361-8415(97)85012-8. [DOI] [PubMed] [Google Scholar]
- 5.Oliveira AE, Cevidanes LH, Phillips C, Motta A, Burke B, Tyndall D. Observer reliability of three-dimensional cephalometric landmark identification on cone-beam computerized tomography. Oral Surg Oral Med Oral Pathol Oral Radiol Endod. 2000;107:256–65. doi: 10.1016/j.tripleo.2008.05.039. [DOI] [PMC free article] [PubMed] [Google Scholar]
- 6.Ballrick JW, Palomo JM, Ruch E, Amberman BD, Hans MG. Image distortion and spatial resolution of a commercially available cone-beam computed tomography machine. Am J Orthod Dentofacial Orthop. 2008;134:573–82. doi: 10.1016/j.ajodo.2007.11.025. [DOI] [PubMed] [Google Scholar]
- 7.Lascala CA, Panella J, Marques MM. Analysis of the accuracy of linear measurements obtained by cone beam computed tomography (CBCT-NewTom) Dentomaxillofac Radiol. 2004;33:291–4. doi: 10.1259/dmfr/25500850. [DOI] [PubMed] [Google Scholar]
- 8.Marmulla R, Wortche R, Muhling J, Hassfeld S. Geometric accuracy of the NewTom 9000 cone beam CT. Dentomaxillofac Radiol. 2005;34:28–31. doi: 10.1259/dmfr/31342245. [DOI] [PubMed] [Google Scholar]
- 9.Mischkowski RA, Pulsfort R, Ritter L, Neugebauer J, Brochhagen HG, Keeve E, et al. Geometric accuracy of a newly developed cone-beam device for maxillofacial imaging. Oral Surg Oral Med Oral Pathol Oral Radiol Endod. 2007;104:551–9. doi: 10.1016/j.tripleo.2007.02.021. [DOI] [PubMed] [Google Scholar]
- 10.Pinsky HM, Dyda S, Pinsky RW, Misch KA, Sarment DP. Accuracy of three-dimensional measurements using cone-beam CT. Dentomaxillofac Radiol. 2006;35:410–6. doi: 10.1259/dmfr/20987648. [DOI] [PubMed] [Google Scholar]
- 11.Stratemann SA, Huang JC, Maki K, Miller AJ, Hatcher DC. Comparison of cone beam computed tomography imaging with physical measures. Dentomaxillofac Radiol. 2008;37:80–93. doi: 10.1259/dmfr/31349994. [DOI] [PubMed] [Google Scholar]
- 12.Hassan B, van der Stelt P, Sanderink G. Accuracy of three-dimensional measurements obtained from cone beam computed tomography surface-rendered images for cephalometric analysis: influence of patient scanning position. Eur J Orthod. 2009;31:129–34. doi: 10.1093/ejo/cjn088. [DOI] [PubMed] [Google Scholar]
- 13.Ludlow JB, Laster WS, See M, Bailey LJ, Hershey HG. Accuracy of measurements of mandibular anatomy in cone beam computed tomography images. Oral Surg Oral Med Oral Pathol Oral Radiol Endod. 2007;103:534–42. doi: 10.1016/j.tripleo.2006.04.008. [DOI] [PMC free article] [PubMed] [Google Scholar]
- 14.Periago DR, Scarfe WC, Moshiri M, Scheetz JP, Silveira AM, Farman AG. Linear accuracy and reliability of cone beam CT derived 3-dimensional images constructed using an orthodontic volumetric rendering program. Angle Orthod. 2008;78:387–95. doi: 10.2319/122106-52.1. [DOI] [PubMed] [Google Scholar]
- 15.Moerenhout BA, Gelaude F, Swennen GR, Casselman JW, Van Der Sloten J, Mommaerts MY. Accuracy and repeatability of cone-beam computed tomography (CBCT) measurements used in the determination of facial indices in the laboratory setup. J Craniomaxillofac Surg. 2009;37:18–23. doi: 10.1016/j.jcms.2008.07.006. [DOI] [PubMed] [Google Scholar]
- 16.Hunter WS, Baumrind S, Moyers RE. An inventory of United States and Canadian growth record sets: preliminary report. Am J Orthod Dentofacial Orthop. 1993;103:545–55. doi: 10.1016/0889-5406(93)70095-6. [DOI] [PubMed] [Google Scholar]
- 17.Cattaneo PM, Bloch CB, Calmar D, Hjortshoj M, Melsen B. Comparison between conventional and cone-beam computed tomography-generated cephalograms. Am J Orthod Dentofacial Orthop. 2008;134:798–802. doi: 10.1016/j.ajodo.2008.07.008. [DOI] [PubMed] [Google Scholar]
- 18.Kumar V, Ludlow JB, Mol A, Cevidanes L. Comparison of conventional and cone beam CT synthesized cephalograms. Dentomaxillofac Radiol. 2007;36:263–9. doi: 10.1259/dmfr/98032356. [DOI] [PubMed] [Google Scholar]
- 19.Moshiri M, Scarfe WC, Hilgers ML, Scheetz JP, Silveira AM, Farman AG. Accuracy of linear measurements from imaging plate and lateral cephalometric images derived from cone-beam computed tomography. Am J Orthod Dentofacial Orthop. 2007;132:550–60. doi: 10.1016/j.ajodo.2006.09.046. [DOI] [PubMed] [Google Scholar]
- 20.van Vlijmen OJ, Berge SJ, Swennen GR, Bronkhorst EM, Katsaros C, Kuijpers-Jagtman AM. Comparison of cephalometric radiographs obtained from cone-beam computed tomography scans and conventional radiographs. J Oral Maxillofac Surg. 2009;67:92–7. doi: 10.1016/j.joms.2008.04.025. [DOI] [PubMed] [Google Scholar]
- 21.Grauer D, Cevidanes LH, Styner MA, Heulfe I, Harmon ET, Zhu H, Proffit WR. Accuracy and landmark error calculation using CBCT generated cephalograms. Angle Orthod. 2009 doi: 10.2319/030909-135.1. in press. [DOI] [PMC free article] [PubMed] [Google Scholar]
- 22.Yushkevich PA, Piven J, Hazlett HC, Smith RG, Ho S, Gee JC, et al. User-guided 3D active contour segmentation of anatomical structures: significantly improved efficiency and reliability. Neuroimage. 2006;31:1116–28. doi: 10.1016/j.neuroimage.2006.01.015. [DOI] [PubMed] [Google Scholar]
- 23.Bjork A. Sutural growth of the upper face studied by the implant method. Acta Odontol Scand. 1966;24:109–27. doi: 10.3109/00016356609026122. [DOI] [PubMed] [Google Scholar]
- 24.Bjork A, Skieller V. Facial development and tooth eruption. An implant study at the age of puberty. Am J Orthod. 1972;62:339–83. doi: 10.1016/s0002-9416(72)90277-1. [DOI] [PubMed] [Google Scholar]
- 25.Bjork A, Skieller V. Growth of the maxilla in three dimensions as revealed radiographically by the implant method. Br J Orthod. 1977;4:53–64. doi: 10.1179/bjo.4.2.53. [DOI] [PubMed] [Google Scholar]
- 26.Bjork A, Skieller V. Normal and abnormal growth of the mandible. A synthesis of longitudinal cephalometric implant studies over a period of 25 years. Eur J Orthod. 1983;5:1–46. doi: 10.1093/ejo/5.1.1. [DOI] [PubMed] [Google Scholar]
- 27.Doppel DM, Damon WM, Joondeph DR, Little RM. An investigation of maxillary superimposition techniques using metallic implants. Am J Orthod Dentofacial Orthop. 1994;105:161–8. doi: 10.1016/S0889-5406(94)70112-1. [DOI] [PubMed] [Google Scholar]
- 28.Johnston LE., Jr Balancing the books on orthodontic treatment: an integrated analysis of change. Br J Orthod. 1996;23:93–102. doi: 10.1179/bjo.23.2.93. [DOI] [PubMed] [Google Scholar]
- 29.Cevidanes LH, Bailey LJ, Tucker GR, Jr, Styner MA, Mol A, Phillips CL, et al. Superimposition of 3D cone-beam CT models of orthognathic surgery patients. Dentomaxillofac Radiol. 2005;34:369–75. doi: 10.1259/dmfr/17102411. [DOI] [PMC free article] [PubMed] [Google Scholar]