Abstract
Phosphopantetheinyl transferase plays an essential role in activating fatty acid, polyketide and nonribosomal peptide biosynthetic pathways, catalyzing covalent attachment of a 4’-phosphopantetheinyl group to a conserved residue within carrier protein domains. This enzyme has been validated an essential gene to primary metabolism and presents a target for the identification of antibiotics with a new mode of action. Here we report the development of a homogenous resonance energy transfer assay utilizing fluorescent coenzyme A derivatives and a surrogate peptide substrate that can serve to identify inhibitors of this enzyme class. This assay lays a blueprint for translation of these techniques to other transferase enzymes that accept fluorescent substrate analogues.
Keywords: phosphopantetheinyl transferase, assay development, high throughput screen, FRET assay, fluorescent analogue, Coenzyme A, Acyl carrier protein, Peptidyl carrier protein, secondary metabolism
Introduction
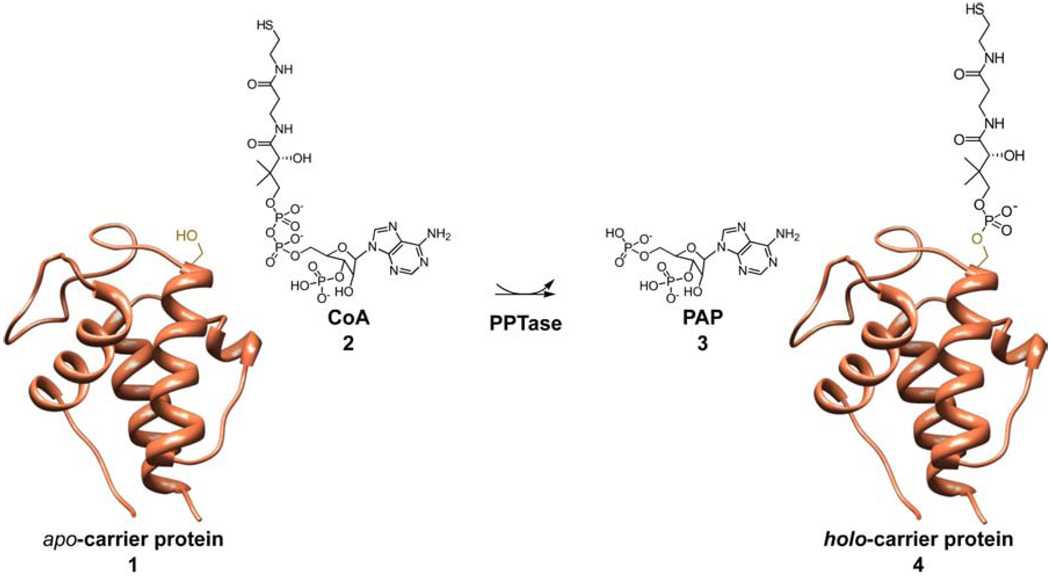
A unifying characteristic in the biosynthesis of fatty acid, non-ribosomal peptide, and polyketide compounds is the tethering of the nascent polymer to small carrier protein domains of the synthases through thioester linkage about a phosphopantetheinyl (4’-PP) arm. This 4’-PP is installed on the proteins post-translationally from coenzyme A (CoA) 2 on a conserved serine residue by action of phosphopantetheinyl transferase (PPTase) enzymes, converting them from their apo- 1 to holo- 4 form (Fig. 1). This modification is essential for synthase activity, and ablation of the PPTase gene precludes natural product production [1–4], or in the case of fatty acid biosynthesis, renders the organism unviable [3–5]. Within bacteria, there exist two major classes of enzymes within the PPTase superfamily: the AcpS-type and the Sfp-type [1]. Grouping in these designations are made based on primary sequence, and their canonical representatives, AcpS of Escherichia coli and Sfp of Bacillus subtilis, are structurally distinct [6; 7].
Fig. 1. Post-translational modification of carrier proteins.
The translated apo-carrier proteins 1 and coenzyme A 2 react with PPTase to generate 3’-phosphoadenosine-5’-phosphate (PAP) 3 and holo-carrier proteins 4.
It has been demonstrated that acpS is an essential E. coli gene [8; 9], thus validating it as a target for inhibitor development with the potential to treat multi-drug resistance. Indeed, a number of groups have begun focused programs to develop AcpS inhibitors [10–14] and several candidates have recently been discussed [10–12]. In addition to fatty acids, a number of compounds are produced from 4’-PP dependent pathways that have been identified as virulence factors, and disruption of their biosynthesis has received much attention as a new angle for therapeutic development [15– 19]. We have been intrigued by the central role of phosphopantetheinylation in these metabolic pathways, and are interested in studying the potential effects that PPTase inhibitors may have on the coordinate attenuation of numerous aspects of pathogenicity.
While AcpS-directed inhibitor development has been reported [10–14], this work has generally omitted screening protocols. The only described method utilizes homogenous time-resolved fluorescence resonance energy transfer (HT-RF) as a means for activity determination [11]. We found replication of this technique beyond our capabilities due to limitations imposed by instrumentation, and we desired the use of readily available and affordable biochemical reagents. Herein we report the development of a homogenous fluorescence resonance energy transfer (FRET) screen for the two canonical PPTase representatives, AcpS and Sfp. This method is simple, requiring only addition of reagents to reaction wells of a microtiter plate, and is herein validated as a process to identify inhibitors of these enzymes. Furthermore, we describe the details that led to successful development of this screen, so it may serve to blueprint assay design for other transferase enzymes that accept reporter-modified substrate analogues.
Materials and Methods
General
7-dimethylamino-4-methyl-coumarin-3-maleimide (DACM) and N,N,N’,N’-tetramethylrhodamine-5-maleimide (TAMRA) were purchased from Invitrogen Corporation (Carlsbad, CA). Coenzyme A trilithium salt was purchased from EMD biochemicals (San Diego, CA). 3’-phosphoadenosine-5’-phosphate disodium salt (PAP), 4-(2-hydroxyethyl)-1-piperazine ethanesulfonic acid (HEPES), dimethylsulfoxide (DMSO, Hybri-Max grade), and fluorescein-isothiocyanate isomer I (FITC) was purchased from Sigma (Saint Louis, MO). Concentrations of all fluorescently labeled reagents were quantified by UV-VIS spectroscopy with an Agilent 8354 diode array spectrophotometer (Agilent Technologies, Santa Clara, CA) using the following extinction coefficients: DACM: 23,000 cm−1 M−1, FITC: 77,000 cm−1 M−1, TAMRA: 95,000 cm−1 M−1.
Enzyme expression & Purification
Sfp was expressed and purified as described previously [2]. The enzyme was concentrated to 40 mg/mL, diluted with an equal volume of 75 % glycerol, and stored in 100 µL aliqouts at −80°C. For routine use, this stock (20 mg/mL, 765 µM) was diluted to 1 mg/mL in Sfp storage buffer (50 mM NaHEPES, 120 mM NaCl, 33 % v/v glycerol) supplemented with 0.1% w/v BSA and stored at −20°C. Under these conditions, there was no noticeable reduction in enzymatic activity with storage for periods longer than 6 months.
E. coli AcpS was expressed and purified as a native protein from pDPJ according published procedures [20]. The protein concentration of the final preparation was adjusted to 10 mg/mL by addition of 2X storage buffer, an equal volume of glycerol added in 3 portions, and aliquots stored at −80°C. For routine work, single tubes (200 µL portions) were stored at −20°C, with no degradation of enzymatic activity observed after 1 year of storage.
Synthesis of assay components
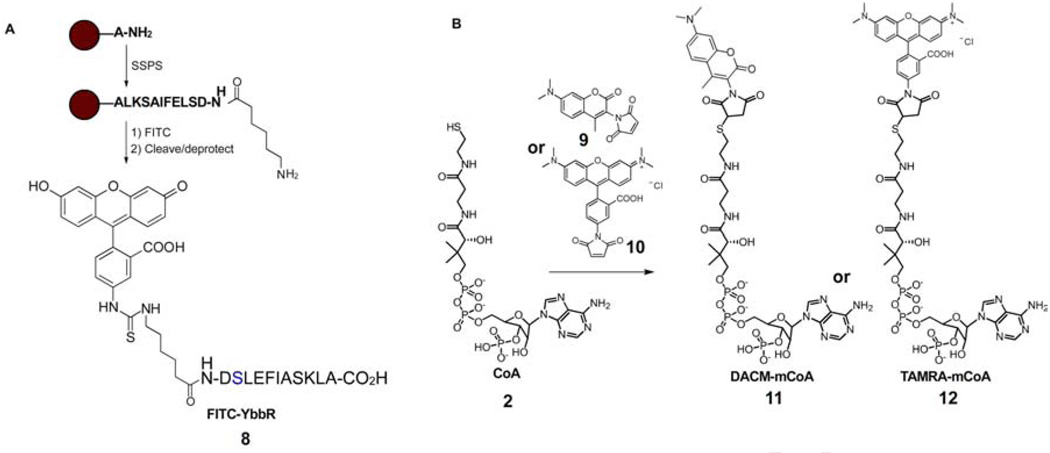
An exploratory quantity (ca. 8 mg) of fluorescein-5-isothiocyanate-modified YbbR peptide (FITC-YbbR) 8 (sequence: Fluorescein-Ahx-DSLEFIASKLA-OH) was initially purchased from GL Biochem (Shanghai, China). For the final screen evaluation, the peptide was prepared on the 0.2 mmol scale using an automated solid phase peptide synthesizer (Applied Biosystems Pioneer) using standard 9-fluorenylmethyloxycarbonyl (FMOC) chemistry with 2-(1H-7-Azabenzotriazol-1-yl)-1,1,3,3-tetramethyl uronium hexafluorophosphate (HATU) activation (Fig. 3A) [21]. The sequence was appended with an N-terminal N-FMOC-ε-aminocaproic acid spacer, deprotected, and coupled overnight with FITC. Following cleavage from the solid support, the product was HPLC purified to yield 84 mg of FITC-YbbR 8 and its identity verified by ESI-MS.
Fig. 3. Synthesis of assay components.
(A) Beginning with L-alanine loaded polystyrene resin, standard SPPS procedures afford the YbbR sequence appended with an ε-aminocaproic acid residue. Reaction with FITC, followed by cleavage and HPLC purification gives the FITC-YbbR peptide substrate 8. (B) CoA 2 is reacted with maleimide bearing probes 9 or 10 to produce their fluorescent mCoA derivatives 11 or 12, respectively.
Fluorescent reporter CoA (mCoA) analogues 11 and 12 were prepared by reaction of reduced CoA trilithium salt 2 (1 mg/mL in 50 mM NaH2PO4, pH 7.4) with 1.1 equivalents of maleimide bearing probe 9 or 10, respectively (both dissolved at 1 mg/mL in methanol) (Fig. 3B). The reaction was followed to completion by HPLC, determined by disappearance of the CoA peak. Excess 9 and 10 were removed by extraction three times with ethyl acetate or dichloromethane, respectively. The resultant aqueous phase was placed under vacuum (< 2 mm/Hg) for 2h to remove residual organic solvent. The purity of mCoA analogues 11 and 12 were verified to be >95% by HPLC.
Kinetic evaluation of fluorescent substrates
Kinetic parameters for FITC-YbbR 8 and TAMRA-mCoA 12 were determined by HPLC. Reactions were conducted in a final volume of 50 µL in a buffer containing 10 mM MgCl2, 50 mM Na-HEPES, pH 7.6, 0.1 mg/mL BSA. Reactions were initiated by the addition of 0.5 µM enzyme, allowed to progress for 15 minutes, and quenched by addition of 50 µL 50 mM sodium ethylenediaminetetraacetic acid, pH 8.0. The reaction mixtures were then separated by reversed phase chromatography with an Agilent 1100 instrument fitted with a diode array detector (Agilent Technologies, Santa Clara, CA) using an OD5 C18 column (250 × 4.6 mm, product number 9575, Burdick & Jackson, Morristown, NJ). The separation was performed under the following conditions: Buffer A: 10 mM ammonium acetate, Buffer B: Acetonitrile, flow rate: 1.5 mL/min. After injection, the run initiated with a 2 minute isocratic flow of 10% Buffer B, followed by sample elution with a 10 minute linear gradient from 10% to 60% Buffer B. The column was regenerated with a 2 minute isocratic flow of 100% Buffer B, and then the column equilibrated to 10% Buffer B.
Fluorescence spectroscopy
Steady state single sample fluorescence spectra were recorded on a QuantaMaster 2000 spectrofluorometer (Photon Technologies International, Princeton, NJ), using excitation and emission slit widths of 4 nm and integration times of 0.1 sec.
FRET screen conditions
PAP parent inhibitor plates were made by dissolving the compound in dry DMSO at a concentration of 10 mM and serial diluting this (2-fold) in DMSO. The final protocol (Table 1) is as follows: 2.5 µL of the parent DMSO solutions (or DMSO as a negative control) were transferred to individual wells of a black polystyrene 96 well plate (Costar # 3694) followed by 37.5 µL of a 1.33 X Enzyme solution [16.62 nM Sfp or 66.6 nM AcpS in 1.33 X PPTase assay buffer (66 mM Na-HEPES, 13.3 mM MgCl2, 1.33 mg/mL BSA, pH 7.6). Reactions were initiated by the addition of 10 µL 5X reagent solution (50 µM TAMRA-mCoA 12, 25 µM FITC-YbbR 8, 10 mM NaH2PO4, pH 7.0). The reaction was monitored continuously (cycle time 2 minutes) for 15 cycles in a Perkin Elmer HTS7000plus microtiter plate reader with excitation filter λ = 485 nm, emission filter λ = 535 nm.
Table 1.
Summarized assay protocol
| step | parameter | value | description |
|---|---|---|---|
| 1 | compound library | 2.5µL | transfer to COSTAR 3694 black 96 well plate; Row G & H = DMSO for control |
| 2 | Enzyme solution | 37.5µL |
1.33X solution: 1.33mg/mL BSA, 66.6mM NaHEPES, pH 7.6, 13.3mM MgCl2, |
| 3 | time | 15 min | Room tempertature incubation |
| 4 | substrate reagent | 10µL |
5X solution: 25µM FITC-YbbR 8, 50µM TAMRA-mCoA 12 in 10mM sodium phosphate |
| 5 | detection | Ex 485, Em 535 nm | Perkin-Elmer HTS7000 plus, kinetic read, once evey 2 min for 15 cycles |
Data analysis
Kinetic data was processed with Microsoft Excel. Assay statistics were evaluated according to standard equations [22]. Plotting and nonlinear regression was performed with GraphPad Prism version 5.00 (GraphPad Inc, La Jolla, CA), and IC50 curves were fit with the four-parameter dose response equation using the ordinary (least squares) setting. In all cases, error bars and reported error values represent one standard deviation. Molecular graphics images (Fig. 1 & Fig. 2) are renditions of the apo-actinorhodin acyl carrier protein (PDB identifier: 2K0Y) and were generated using the UCSF Chimera package [23].
Fig. 2. Fluorescence resonance energy transfer assay for phosphopantetheinyl transferase.
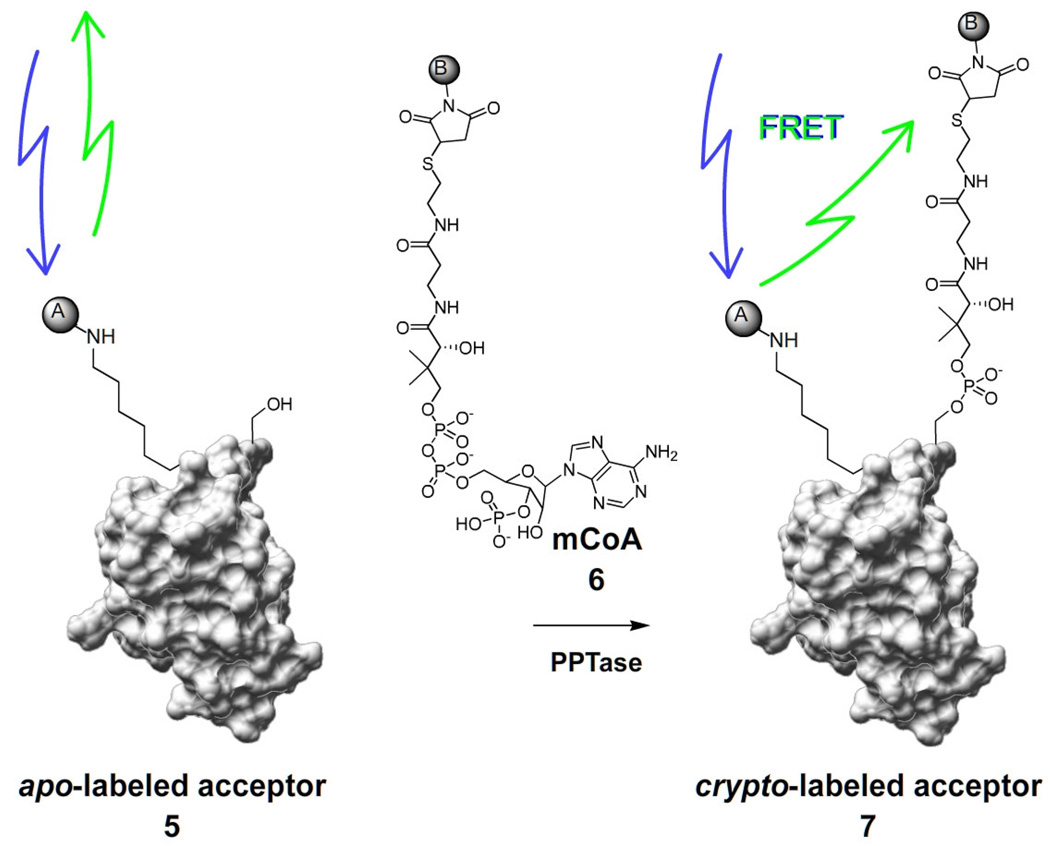
Action of PPTase on a fluorescently labeled acceptor substrate 5, in conjunction with a fluorphore-modified coenzyme A analogue (mCoA) 6, assembles a FRET pair upon conversion to the thiol-blocked crypto-acceptor substrate 7. The assembly of this FRET pair can be detected with a fluorescence microplate reader.
Results & Discussion
Design of a high-throughput PPTase assay
Traditionally, PPTase bioassays have been conducted in a low throughput manner, either by monitoring radiolabel incorporation to precipitated protein mass from [3H]-CoA [4] or by HPLC separation of the apo- and holo-states of the carrier protein substrate [3]. These systems utilize centrifugation and chromatographic separations, respectively, and are not readily amenable to high throughput screening. In designing a high throughput screen for PPTase activity, we desired a system that would allow direct monitoring of reaction progress to eliminate the probability of false-positive hits that arrive from inhibition of coupled enzyme systems. To accomplish this, we chose to exploit the synthetic aspect of the PPTase reaction in conjunction with a fluorescent reporter-CoA (mCoA) technology developed previously in our laboratory [24]. In this system, fluorophore-appended carrier protein domains/mimics 5 generate a FRET signal upon conversion to their thiol-blocked crypto-form 7 by modification with mCoA 6 analogs by PPTase (Fig. 2).
Fluorescent probe selection and substrate synthesis
We chose to make a fluorescein-5-isothiocyanate (FITC) modification to the protein-based substrate, as this fluorophore possesses absorption and emission centered about the visible light spectrum, allowing it to function as either FRET donor or acceptor, depending on the identity of compounds chosen for mCoA 6 preparation (Fig. 2). This would allow us to probe both modes of FRET from a singly prepared pool of reagent. In turning to select a carrier protein domain to function as the acceptor substrate, we initially considered the E. coli fatty acid synthase acyl carrier protein (ACP) as a candidate, as previous reports note that ACP contains a single tyrosine residue present at the C-terminus of α-helix 3 and modification of this residue with a dansyl-moiety does not hinder its function [25; 26]. We found this protocol and other tyrosine-modifying techniques [27; 28] to provide low yields of fluorescein-modified proteins due to the insolubility of FITC and its derivatives in low pH reaction conditions (data not shown), and the purification of this labeled material was insufficient for our needs.
Subsequently, we chose to investigate the use of the eleven residue YbbR peptide (sequence H-DSKLEFIASKLA-OH) identified by Yin et al. that undergoes modification by PPTases, thus serving as an ACP surrogate [29]. This choice was strengthened by the fact that solid phase peptide synthesis (SPPS) allows access to large quantities of uniformly labeled material, a crucial requirement for FRET applications, and avoids the potential for batch-to-batch variability. In selecting the placement of the label, we noted that YbbR was isolated as a collection of N-terminal extensions to the consensus, suggesting a site for modification that would not abrogate activity. As such, we chose to attach FITC to the YbbR consensus via a 6-aminocaproic acid spacer unit to sufficiently distance the molecule from the central motif (Fig. 3A) and impart a number of freely rotatable bonds, thus ensuring a random spatial orientation upon FRET-pair assembly (vide infra).
In selecting complimentary probes containing modest spectral overlap with FITC for mCoA 6 production, we sought maleimide-bearing compounds that were amenable to organic extraction after reaction with CoA (Fig. 3B), as this would circumvent HPLC purification; a characteristic that would make the procedure easily scaleable for a high screening volume application. With this in mind, dimethylaminocoumarin (DACM) 9 and tetramethylrhodamine (TAMRA) 10 were chosen and used to prepare DACM-mCoA 11 and TAMRA-mCoA 12 (Fig. 3B) to be evaluated as a FRET donor (Fig. 4A) and FRET acceptor (Fig. 4E), respectively.
Fig. 4. Probe selection and photophysical evaluation of the crypto-YbbR peptides.
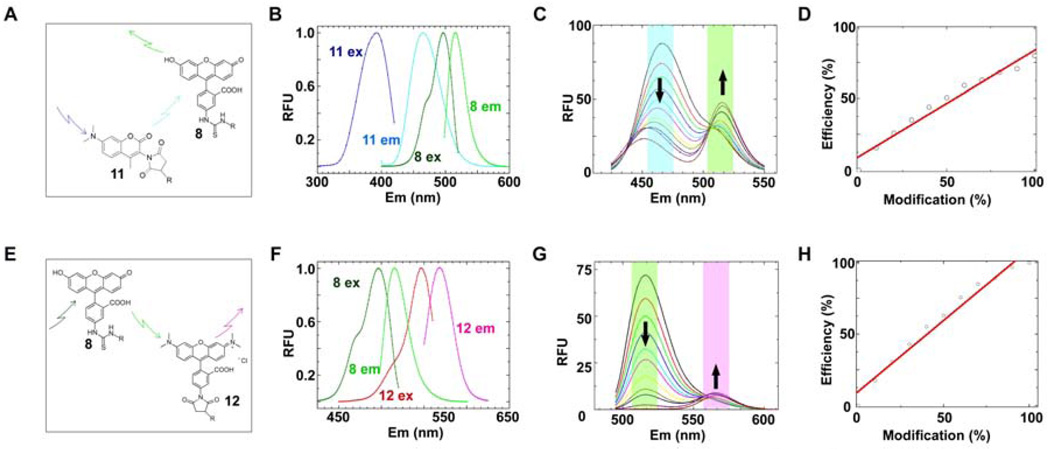
DACM-mCoA 11 and TAMRA-mCoA 12 probes were evaluated for their FRET characteristics with FITC-YbbR 8. (A) DACM-mCoA 11 acts as a FRET donor to FITC-YbbR 8. (B) Excitation and emission spectra of probes 11 and 8 were recorded and normalized to determine the spectral overlap of 11 emission with 8 excitation to calculate an overlap integral J(λ) [Eq. (3)] and theoretical Forster’s radius R0 [Eq. (2)] of this system. Summation of the normalized data gave a J(λ) of 1.60 × 10⁻¹³cm4 and a R0 =38Å. (C) FRET characterization of the crypto-DACM-FITC-YbbR peptide. Equimolar solutions of 11 and 8 were prepared with varying degree of modification to the crypto-DACM-FITC-YbbR 7, and their fluorescent spectra recorded with excitation at 403nm. The spectra are overlayed, and increase in 10% increments of modification from 0 to 100%; starting from the maximal emission observed at 462nm to minimum at this wavelength. (D) Eq. (5) was fitted to emission data from (C) and gave an efficiency of transfer value of 0.82. (E) FITC-YbbR 8 acts as a FRET donor to TAMRA-mCoA 12. (F) Excitation and emission spectra of probes 11 and 12 were recorded and normalized to determine the spectral overlap of 11 emission with 12 excitation to calculate an overlap integral J(λ) [Eq. (3)] and theoretical Forster’s radius R0 [Eq. (2)] of this system. Summation of the normalized data gave a J(λ,) of 3.01 × 10⁻¹³cm4 and a R0 =56Å. (G) FRET characterization of the crypto-TAMRA-YbbR peptide. Equimolar solutions of 11 and 12 were prepared with varying degree of modification to the crypto-TAMRA-YbbR 7, and their fluorescent spectra recorded with excitation at 475nm. The spectra are overlayed, and increase in 10% increments of modification from 0 to 100%; starting from the maximal emission observed at 513nm to the spectrum with the minimum value at this wavelength.
(H) Eq. (5) was fitted to emission data at 513nm from (G) and gave an efficiency of transfer value of 0.99.
HPLC analysis of the labeled substrates
The labeled substrates were evaluated by HPLC to probe the effects that modification of the substrates would have upon the kinetic parameters displayed by the enzymes. Evaluation of FITC-YbbR 8 with AcpS and Sfp, with a saturating concentration of CoA 2 returned Km values of 86 and 101 µM and Kcat values of 4.4 and 12.1 µM, respectively. These are in agreement with the values previously determined for the unmodified substrate (Km values of 200 and 123 µM for AcpS and Sfp, respectively) [29; 30]. Additionally, the kinetic parameters for TAMRA-mCoA 12 were determined at a saturating concentration of FITC-YbbR 8 and gave Km values of 22 and 6 µM for AcpS and Sfp, with Kcat values of 3.2 and 8.9, respectively. Again, these values were found to be in agreement with previously determined parameters [29; 30] and demonstrate the modifications made to the substrates were well tolerated by the enzymes.
Determination of Förster Radius
In order to assess the viability of the donor and acceptor substrates chosen, we sought to determine the theoretical Forster’s radius, R0, of these pairs. This value, the distance where transfer efficiency is 50%, is related to donor quantum yield ФD, the relative orientation of donor and acceptor transition dipoles κ, and J(λ), the overlap integral of the donor emission FD and the absorption of the acceptor εA [31]:
| (1) |
For κ a value of 2/3 is assumed and corresponds to a random orientation of the two fluorophores in space, given that they will be linked by numerous freely rotatable bonds. η, the index of refraction of the medium, is assumed to be 1.44 for biological samples [31] and NA, avagadro’s number, is a constant, leaving R0 to be determined by ФD, and J(λ). Quantum yields for these fluorophores have been previously determined [32], J(λ) is expressed as,
| (2) |
Simple equations cannot be written for FD(λ) and εA(λ), and thus, J(λ) is calculated as a summation [33]:
| (3) |
Absorption and emission spectra were recorded for the three conjugated substrates 8, 11 and 12 (Fig. 4B & F) and summation of the values at each wavelength according to Eq. (3) and use of these J(λ) values in Eq. (1) gave Förster’s radii of 38 Å and 56 Å for the DACM-FITC (Fig. 4A) and TAMRA-FITC pairs (Fig. 4E), respectively.
Photophysical evaluation of the phosphopantetheinylated peptide and efficiency of transfer determination
With the theoretical Förster’s radii, we mathematically calculated the maximum distance that two fluorophores could achieve in the crypto-FITC-YbbR product (exemplified as 7, Fig. 2) by summation of average bond lengths, and determined this to be 42 Å (radius, r, of 21 Å) if a rigid linear extension were to occur. This suggests a high theoretical FRET efficiency, E, which is strictly related to the radius separating the two fluorophores, r, by
| (4) |
with a rapid decay in E when r exceeds R0. Using the R0 values determined from Eq. (1) and our calculated r of 21Å; Eq. (4) gives theoretical E values of 97 % and 99 % for the DACM-FITC and TAMRA-FITC pairs, respectively. However, r exists as a distribution due to the number of freely rotatable bonds, and thus transfer efficiency must be experimentally determined by measurement of donor fluorescence in the absence (FD) or presence (FDA) of acceptor and fitting of Eq. (5) to the experimental data:
| (5) |
Reactions were set up with mCoA analogues 11 and 12, Sfp, and FITC-YbbR 8 and followed to completion by HPLC. The corresponding crypto-FITC-YbbR 7 peptides were then isolated by semi-preparative HPLC. These products were used to prepare equimolar mixtures of the probes with varying degrees of modification. Fluorescent emission spectra of these mixtures were recorded (Fig. 4C & G). Analysis of these data (Fig. 4D & H) by Eq. (5) yields efficiency of transfers of 0.82 and 0.99 for the DACM-FITC (Fig. 4A) and TAMRA-FITC (Fig. 4E) pairs, respectively.
Mode of observation
Data in Fig. 4 (C & G) was also informative with regard to the mode of monitoring for this biochemical system. FRET pairs offer flexibility in that their assembly can be detected by either the quench of the donor emission (down arrows) or by sensitization of acceptor fluorescence at shorter excitation wavelengths (up arrows). Evaluation of data for both systems shows a greater response for the quenching mode, with a 5-fold and 10-fold reduction in donor fluorescence upon conversion to crypto-FITC-YbbR 7 for the DACM-FITC and TAMRA-FITC pairs, respectively. Evaluation of acceptor sensitized emission at shorter excitation wavelengths showed an increase of 2-fold for complete conversion, indicating that the system would give a greater signal to background ratio by monitoring the quench of donor fluorescence. This screen would therefore function optimally as a substrate-consumption assay.
Of these two FRET systems, TAMRA-mCoA probe 12 possessed better FRET characteristics (i.e. full attenuation of donor fluorescence upon complete conversion) and was chosen to be carried forward for screen implementation.
Determination of screen conditions
We arrived at initial assay conditions based on the requirement that the end point would need complete attenuation of donor fluorescence; requiring TAMRA-mCoA 12 to be present in excess of FITC-YbbR 8. With this in mind, we probed the linearity of detector response with respect to FITC-YbbR 8 concentration. This was done to identify the maximal concentration that could be obtained before direct correlations between relative fluorescence units and substrate concentration became obscured by an inner filter effect, a phenomenon where all incedent light irradiated upon the sample is absorbed and does not sufficiently transition all target molecules to the excited state. With our plate reader (Perkin Elmer HTS7000) we found delineation to occur at concentrations exceeding 10 µM, and thus chose to hold FITC-YbbR 8 at a concentration of 5 µM.
We then sought to determine the effects of increasing the concentration of TAMRA-mCoA 12 on FITC-YbbR 8 signal. The purpose of this analysis was to find an acceptably high concentration of TAMRA-mCoA 12 that did not impart an effect on FITC-YbbR 8 emission, as it displays some absorption at the FITC-YbbR 8 excitation wavelengths. We found the signal to be maintained at concentrations up to 12.5 µM and arrived at the final concentration in the screen for TAMRA-mCoA 12 to be 10 µM.
Assay optimization: Requirement of BSA for enzyme stability
The screen was first developed by initiating reactions in 96 well plates with varied enzyme concentration. These experiments were monitored continuously using standard fluorescein optics, and analysis of the progress curves revealed that reaction rate did not follow linearly with respect to enzyme concentration. This was identified to be a complication with time-dependent inactivation of the enzyme using Selwyn’s method [34] (data not shown). A number of reaction additives, including buffer and salt composition, ionic strength, and detergents were screened in an attempt to stabilize the enzyme, and we found that inclusion of bovine serum albumin (BSA) at a concentration of 1 mg/mL (15 µM) stabilized the enzyme and eliminated this complication.
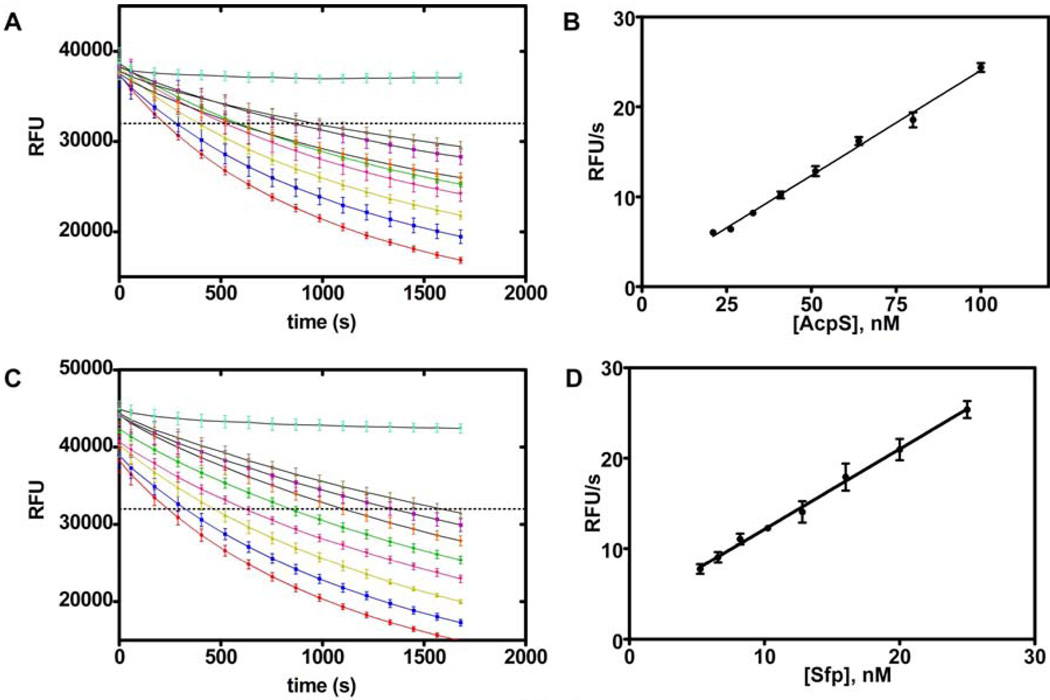
With this modification, stable reaction progress plots were observed (Fig. 5A & C) that displayed a linear relationship between rate and enzyme concentration (Fig. 5B & D). From this data, we determined optimal enzyme concentrations to be 50 and 12.5 nM for AcpS and Sfp, respectively, based on obtaining a complete progress curve terminating in approximately 30% substrate consumption over a 30 minute time interval (vide infra). It is noteworthy that while inclusion of BSA may be traditionally considered unattractive in a screening campaign, this carrier provides an excellent source of amine and thiol moieties and may serve to repress inhibition of the enzyme by nonspecific electrophilic species present in diverse compound libraries.
Fig. 5. Reaction progress and enzyme titration.
(A) Reaction progress plots for eight concentrations of AcpS. Rates were determined for the experiments when they intersect the dashed threshold at 32,000 RFU. (B) Reaction rates for the progress curves in A are plotted against AcpS concentration and demonstrate a linear response. (C) Reaction progress curves for eight concentrations of Sfp. Rates were determined for the experiments when they intersect the dashed threshold at 32,000 RFU. (D) Reaction rates for the progress curves in C are plotted against Sfp concentration and demonstrate a linear response.
DMSO tolerance
Since most compound libraries are stocked as solutions in DMSO, we sought to evaluate the tolerance of the screen to this organic solvent. Inclusion of any organic solvent in the reaction caused an immediate 10% increase in RFU signal from the substrate mixture but did not deteriorate the observed rate until reaching a concentration greater than 10% total volume (data not shown). For our routine screening conditions, we maintained a final DMSO concentration of 5% v/v.
Progress curve analysis and signal statistics
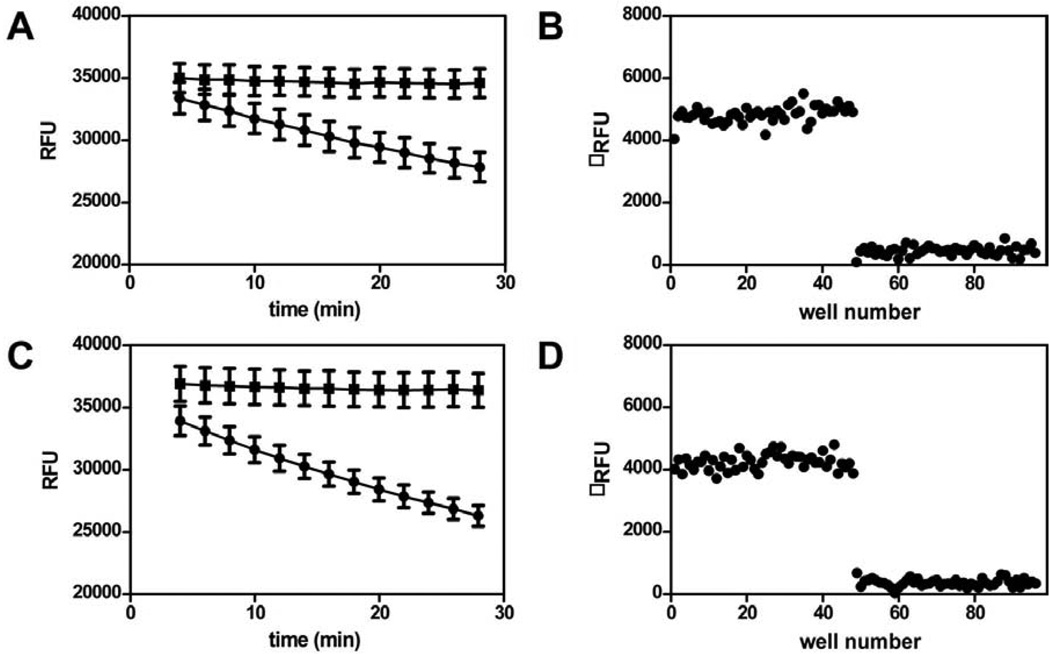
With final assay conditions in hand, a screening protocol was developed and is presented in Table 1. Following this protocol, we recorded progress curves and analysed this data statistically to determine the appropriate time for analysis. Since known inhibitors of PPTases are not commercially available, an enzyme-free reaction was used as the fully inhibited (negative) control. Analysis of these data (presented in Fig. 6A & B) demonstrated the assay performance relied heavily on the amount of substrate consumption that was allowed to occur, with the parameter values becoming better with further consumption (Table 2). However, excessive substrate consumption can lead to erroneous determination of inhibition characteristics [35], and a progression of ~20% (Table 2, boxed values) was chosen as a balance of conditions where a minimum of substrate was consumed and assay statistics reached acceptable values, including Z’ values of 0.7, and signal to noise of 20 (Table 2).
Fig. 6. Determination of analysis timepoint and Z’.
(A) Progress curve for a 96 well plate containing 48 reactions in the presense (●) or absence (▪) of 50 nM AcpS The data for each timepoint were analysed statistically and presented in Table 2. The 24 minute time point was selected for routine analysis, as it gave acceptable assay statistics during the linear range of the screen. (B) Change in relative fluorescence units for the 24 minute time point (Table 2, boxed data) is plotted against well number. The Z’ value for this data is 0.72. (C) Progress curve for a 96 well plate containing 48 reactions in the presense (●) or absence (▪) of 12.5 nM Sfp. The data for each timepoint were analysed statistically and presented in Table 2. The 16 minute time point was selected for routine analysis, as it gave acceptable assay statistics during the linear range of the screen. (B) Change in relative fluorescence units for the 16 minute time point (Table 2, boxed data) is plotted against well number. The Z’ value for this data is 0.71.
Table 2.
Statistical analysis of 50nM AcpS and 12.5 nM Sfp progress curves
| time | 6 | 8 | 10 | 12 | 14 | 16 | 18 | 20 | 22 | 24 | 26 | 28 | |
|---|---|---|---|---|---|---|---|---|---|---|---|---|---|
| AcpS | |||||||||||||
| Z' | −0.92 | 0.02 | 0.35 | 0.47 | 0.59 | 0.59 | 0.68 | 0.68 | 0.72 | 0.71 | 0.74 | 0.74 | |
| signal:noise | 3.1 | 6.1 | 9.2 | 11.2 | 14.6 | 14.6 | 18.3 | 18.5 | 20.5 | 20.2 | 21.8 | 21.9 | |
| signal:background | 4.0 | 8.2 | 6.4 | 8.4 | 8.6 | 8.3 | 8.1 | 11.4 | 10.7 | 10.8 | 10.7 | 13.3 | |
| signal window | −2.9 | 0.1 | 3.2 | 5.2 | 8.7 | 8.7 | 12.5 | 12.6 | 14.9 | 14.4 | 16.0 | 16.2 | |
| Sfp | |||||||||||||
| Z' | −0.11 | 0.33 | 0.51 | 0.62 | 0.64 | 0.70 | 0.70 | 0.73 | 0.76 | 0.76 | 0.77 | 0.78 | |
| signal:noise | 5.4 | 8.9 | 12.2 | 15.4 | 15.5 | 19.2 | 19.4 | 20.8 | 23.5 | 23.4 | 24.5 | 25.5 | |
| signal:background | 7.0 | 8.8 | 9.3 | 10.1 | 10.0 | 11.6 | 10.8 | 11.4 | 11.9 | 14.0 | 15.9 | 14.6 | |
| signal window | −0.6 | 2.9 | 6.2 | 9.6 | 9.9 | 13.5 | 13.7 | 15.2 | 17.8 | 17.8 | 19.0 | 19.9 |
Subsequently, this experiment was repeated on three separate days to assess the robustness of the method, and the data are presented in Table 3. The Z’ factor [36] is often used to evaluate the suitability of a screening method for high throughput implementation, with values greater than 0.5 being considered satisfactory. The assay performed well, and gave Z’ values of 0.72 ± 0.01 and 0.75 ± 0.02 for Sfp and AcpS, respectively.
Table 3.
Day-to-day variability
| statistical value | AcpS | Sfp |
|---|---|---|
| Z' | 0.75 ± 0.02 | 0.72 ± 0.01 |
| Signal:noise | 23.1 ± 2.1 | 19.9 ± 1.2 |
| Signal:background | 10.8 ± 0.3 | 11.7 ± 1.5 |
| Signal window | 17.3 ± 2.0 | 14.3 ± 1.1 |
Screen validation for inhibitor identification
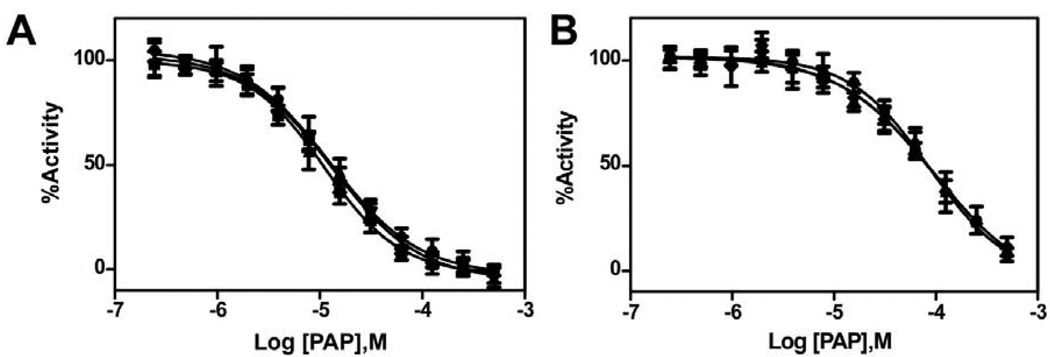
To demonstrate the ability of this screen to identify inhibitors of PPTases, we evaluated the effects of product inhibition by 3’-phosphoadenosine-5’-phosphate (PAP) 3 (Fig. 1), the nucleotide product released by the enzyme, utilized by McAllister et al. in their studies of the reaction mechanism of AcpS [13]. PAP was serial diluted (2-fold) from a top concentration of 10 mM in DMSO and stocked in polypropylene plates, and evaluated in the assay with both enzymes on three separate days (Fig. 7), again to demonstrate reproducibility of the screen. The method proved to yield consistent inhibition curves, with IC50 values 12.3 ± 1.1 µM and 92 ± 6 µM for Sfp and AcpS, respectively; and Hill coefficients for these analyses of −1.06 ± 0.09 for Sfp and −0.98 ± 0.11 for AcpS. Taken together, these data support the suitability of this method to determine inhibitory characteristics of compounds for these PPTase enzymes.
Fig. 7. Reproducibility of IC50 values for 3’-phosphoadenosine-5’-phosphate.
(A) Sfp was screened against 12 concentrations of PAP ranging from 244 nM to 500 µM on three separate days. The data were fit with the four-parameter dose response curve using GraphPad and returned IC50 values of 13, 11, and 13 µM. (B) Replication of the same experiment as in A.) except using the AcpS enzyme. These curves returned IC50 values of 86, 98 and 94 µM.
Conclusions
In summary, we have developed a homogenous screen for PPTase that requires a minimum number of liquid handling steps, and meets the criteria set forth by the NIH Chemical Genomics Center as acceptable for automation [37]. Importantly, this method utilizes simple reagents that can be prepared through traditional techniques [24; 38], and are pure chemical entities that do not require interbatch standardization, a luxury not afforded by complex biochemical reagents. It is anticipated that this method can be used to evaluate the crossreactivity of currently known AcpS inhibitors, and to identify new inhibitor architectures for Sfp and AcpS, and this work is currently in progress.
Acknowledgements
This work was funded by NIH R01GM075797 and 1R03MH083266. We thank Christopher T. Walsh (Harvard Medical School) for plasmids containing the Sfp and AcpS expression systems, Elizabeth A. Komives for guidance and assistance with peptide synthesis, and Adam Yasgar and Anton Simeonov (NIH Chemical Genomics Center) for helpful discussions.
Abbreviations used
- 4’-PP
4’-phosphopantetheine
- ACP
acyl carrier protein
- CoA
coenzyme A
- mCoA
modified-coenzyme A
- PPTase
phosphopantetheinyl transferase
- FRET
fluorescence resonance energy transfer
- DACM
7-dimethylamino-4-methyl-coumarin-3-maleimide
- TAMRA
tetrametylrhodamine-5-maleimide
- PAP
3’-phosphoadeosine-5’-phosphate
- UV-VIS
ultraviolet-visible
- FITC
fluorescein-5-isothiocyanate
- HEPES
4-(2-hydroxyethyl)-1-piperazine ethanesulfonic acid
- BSA
bovine serum albumen
- FMOC
9-Fluorenylmethyloxycarbonyl
- HATU
2-(1H-7-Azabenzotriazol-1-yl)-1,1,3,3-tetramethyl uronium hexafluorophosphate
- DMSO
dimethyl sulfoxide
- RFU
relative fluorescence unit
Footnotes
Publisher's Disclaimer: This is a PDF file of an unedited manuscript that has been accepted for publication. As a service to our customers we are providing this early version of the manuscript. The manuscript will undergo copyediting, typesetting, and review of the resulting proof before it is published in its final citable form. Please note that during the production process errors may be discovered which could affect the content, and all legal disclaimers that apply to the journal pertain.
References
- 1.Lambalot RH, Gehring AM, Flugel RS, Zuber P, LaCelle M, Marahiel MA, Reid R, Khosla C, Walsh CT. A new enzyme superfamily - the phosphopantetheinyl transferases. Chem Biol. 1996;3:923–936. doi: 10.1016/s1074-5521(96)90181-7. [DOI] [PubMed] [Google Scholar]
- 2.Quadri LE, Weinreb PH, Lei M, Nakano MM, Zuber P, Walsh CT. Characterization of Sfp,a Bacillus subtilis phosphopantetheinyl transferase for peptidyl carrier protein domains in peptide synthetases. Biochemistry. 1998;37:1585–1595. doi: 10.1021/bi9719861. [DOI] [PubMed] [Google Scholar]
- 3.Barekzi N, Joshi S, Irwin S, Ontl T, Schweizer HP. Genetic characterization encoding the multifunctional phosphopantetheinyl transferase of Pseudomonas aeruginosa. Microbiology. 2004;150:795–803. doi: 10.1099/mic.0.26823-0. [DOI] [PubMed] [Google Scholar]
- 4.Finking R, Solsbacher J, Konz D, Schobert M, Schafer A, Jahn D, Marahiel MA. Characterization of a new type of phosphopantetheinyl transferase for fatty acid and siderophore synthesis in Pseudomonas aeruginosa. J Biol Chem. 2002;277:50293–50302. doi: 10.1074/jbc.M205042200. [DOI] [PubMed] [Google Scholar]
- 5.Lambalot RH, Walsh CT. Cloning, overproduction, and characterization of the Escherichia coli holo-acyl carrier protein synthase. J Biol Chem. 1995;270:24658–24661. doi: 10.1074/jbc.270.42.24658. [DOI] [PubMed] [Google Scholar]
- 6.Parris KD, Lin L, Tam A, Mathew R, Hixon J, Stahl M, Fritz CC, Seehra J, Somers WS. Crystal structures of substrate binding to Bacillus subtilis holo-(acyl carrier protein) synthase reveal a novel trimeric arrangement of molecules resulting in three active sites. Structure with Folding & Design. 2000;8:883–895. doi: 10.1016/s0969-2126(00)00178-7. [DOI] [PubMed] [Google Scholar]
- 7.Reuter K, Mofid MR, Marahiel MA, Ficner R. Crystal structure of the surfactin synthetase-activating enzyme Sfp: a prototype of the 4 ‘-phosphopantetheinyl transferase superfamily. Embo Journal. 1999;18:6823–6831. doi: 10.1093/emboj/18.23.6823. [DOI] [PMC free article] [PubMed] [Google Scholar]
- 8.Lam HM, Tancula E, Dempsey WB, Winkler ME. Suppression of Insertions in the Complex Pdxj Operon of Escherichia-Coli K-12 by Ion and Other Mutations. Journal of Bacteriology. 1992;174:1554–1567. doi: 10.1128/jb.174.5.1554-1567.1992. [DOI] [PMC free article] [PubMed] [Google Scholar]
- 9.Takiff HE, Baker T, Copeland T, Chen SM, Court DL. Locating Essential Escherichia-Coli Genes by Using Mini-Tn10 Transposons - the Pdxj Operon. Journal of Bacteriology. 1992;174:1544–1553. doi: 10.1128/jb.174.5.1544-1553.1992. [DOI] [PMC free article] [PubMed] [Google Scholar]
- 10.Chu M, Mierzwa R, Xu L, Yang SW, He L, Patel M, Stafford J, Macinga D, Black T, Chan TM, Gullo V. Structure elucidation of Sch 538415 a novel acyl carrier protein synthase inhibitor from a microorganism. Bioorg Med Chem Lett. 2003;13:3827–3829. doi: 10.1016/j.bmcl.2003.07.011. [DOI] [PubMed] [Google Scholar]
- 11.Gilbert AM, Kirisits M, Toy P, Nunn DS, Failli A, Dushin EG, Novikova E, Petersen PJ, Joseph-McCarthy D, McFadyen I, Fritz CC. Anthranilate 4H–oxazol-5-ones: novel small molecule antibacterial acyl carrier protein synthase (AcpS) inhibitors. Bioorg Med Chem Lett. 2004;14:37–41. doi: 10.1016/j.bmcl.2003.10.032. [DOI] [PubMed] [Google Scholar]
- 12.Joseph-McCarthy D, Parris K, Huang A, Failli A, Quagliato D, Dushin EG, Novikova E, Severina E, Tuckman M, Petersen PJ, Dean C, Fritz CC, Meshulam T, DeCenzo M, Dick L, McFadyen IJ, Somers WS, Lovering F, Gilbert AM. Use of structure-based drug design approaches to obtain novel anthranilic acid acyl carrier protein synthase inhibitors. J Med Chem. 2005;48:7960–7969. doi: 10.1021/jm050523n. [DOI] [PubMed] [Google Scholar]
- 13.McAllister KA, Peery RB, Meier TI, Fischl AS, Zhao G. Biochemical and molecular analyses of the Streptococcus pneumoniae acyl carrier protein synthase,an enzyme essential for fatty acid biosynthesis. J Biol Chem. 2000;275:30864–30872. doi: 10.1074/jbc.M004475200. [DOI] [PubMed] [Google Scholar]
- 14.Payne DJ, Gwynn MN, Holmes DJ, Pompliano DL. Drugs for bad bugs: confronting the challenges of antibacterial discovery. Nat Rev Drug Discov. 2007;6:29–40. doi: 10.1038/nrd2201. [DOI] [PubMed] [Google Scholar]
- 15.Neres J, Labello NP, Somu RV, Boshoff HI, Wilson DJ, Vannada J, Chen L, Barry CE, Bennett EM, Aldrich CC. Inhibition of siderophore biosynthesis in Mycobacterium tuberculosis with nucleoside bisubstrate analogues: Structure-activity relationships of the nucleobase domain of 5 ‘-O-[N-(salicyl)sulfamoyl]adenosine. Journal of Medicinal Chemistry. 2008;51:5349–5370. doi: 10.1021/jm800567v. [DOI] [PMC free article] [PubMed] [Google Scholar]
- 16.Stirrett KL, Ferreras JA, Jayaprakash V, Sinha BN, Ren T, Quadri LEN. Small molecules with structural similarities to siderophores as novel antimicrobials against Mycobacterium tuberculosis and Yersinia pestis. Bioorganic & Medicinal Chemistry Letters. 2008;18:2662–2668. doi: 10.1016/j.bmcl.2008.03.025. [DOI] [PMC free article] [PubMed] [Google Scholar]
- 17.Ferreras JA, Stirrett KL, Lu XQ, Ryu JS, Soll CE, Tan DS, Quadri LEN. Mycobacterial phenolic glycolipid virulence factor biosynthesis: Mechanism and small-molecule inhibition of polyketide chain initiation. Chemistry & Biology. 2008;15:51–61. doi: 10.1016/j.chembiol.2007.11.010. [DOI] [PMC free article] [PubMed] [Google Scholar]
- 18.Cisar JS, Ferreras JA, Soni RK, Quadri LEN, Tan DS. Exploiting ligand conformation in selective inhibition of non-ribosomal peptide synthetase amino acid adenylation with designed macrocyclic small molecules. Journal of the American Chemical Society. 2007;129 doi: 10.1021/ja0721521. 7752-+ [DOI] [PMC free article] [PubMed] [Google Scholar]
- 19.Meier JL, Barrows-Yano T, Foley TL, Wike CL, Burkart MD. The unusual macrocycle forming thioesterase of mycolactone. Molecular Biosystems. 2008;4:663–671. doi: 10.1039/b801397g. [DOI] [PubMed] [Google Scholar]
- 20.Lambalot RH, Walsh CT. Holo-[acyl-carrier-protein] synthase of Escherichia coli, Vitamins and Coenzymes. 1997;(Pt I):254–262. doi: 10.1016/s0076-6879(97)79029-3. [DOI] [PubMed] [Google Scholar]
- 21.Glover KJ, Martini PM, Vold RR, Komives EA. Preparation of insoluble transmembrane peptides: Glycophorin-A, prion (110–137)and FGFR (368–397) Analytical Biochemistry. 1999;272:270–274. doi: 10.1006/abio.1999.4182. [DOI] [PubMed] [Google Scholar]
- 22.Inglese J, Johnson RL, Simeonov A, Xia MH, Zheng W, Austin CP, Auld DS. High-throughput screening assays for the identification of chemical probes. Nature Chemical Biology. 2007;3:466–479. doi: 10.1038/nchembio.2007.17. [DOI] [PubMed] [Google Scholar]
- 23.Pettersen EF, Goddard TD, Huang CC, Couch GS, Greenblatt DM, Meng EC, Ferrin TE. UCSF chimera - A visualization system for exploratory research and analysis. Journal of Computational Chemistry. 2004;25:1605–1612. doi: 10.1002/jcc.20084. [DOI] [PubMed] [Google Scholar]
- 24.La Clair JJ, Foley TL, Schegg TR, Regan CM, Burkart MD. Manipulation of carrier proteins in antibiotic biosynthesis. Chem Biol. 2004;11:195–201. doi: 10.1016/j.chembiol.2004.02.010. [DOI] [PubMed] [Google Scholar]
- 25.Haas JA, Frederick MA, Fox BG. Chemical and posttranslational modification of Escherichia coli acyl carrier protein for preparation of dansyl-acyl carrier proteins’. Protein Expression and Purification. 2000;20:274–284. doi: 10.1006/prep.2000.1293. [DOI] [PubMed] [Google Scholar]
- 26.Blommel PG, Fox BG. Fluorescence anisotropy assay for proteolysis of specifically labeled fusion proteins. Analytical Biochemistry. 2005;336:75–86. doi: 10.1016/j.ab.2004.09.023. [DOI] [PubMed] [Google Scholar]
- 27.Joshi NS, Whitaker LR, Francis MB. A three-component Mannich-type reaction for selective tyrosine bioconjugation. Journal of the American Chemical Society. 2004;126:15942–15943. doi: 10.1021/ja0439017. [DOI] [PubMed] [Google Scholar]
- 28.Schlick TL, Ding ZB, Kovacs EW, Francis MB. Dual-surface modification of the tobacco mosaic virus. Journal of the American Chemical Society. 2005;127:3718–3723. doi: 10.1021/ja046239n. [DOI] [PubMed] [Google Scholar]
- 29.Yin J, Straight PD, McLoughlin SM, Zhou Z, Lin AJ, Golan DE, Kelleher NL, Kolter R, Walsh CT. Genetically encoded short peptide tag for versatile protein labeling by Sfp phosphopantetheinyl transferase. Proc Natl Acad Sci U S A. 2005;102:15815–15820. doi: 10.1073/pnas.0507705102. [DOI] [PMC free article] [PubMed] [Google Scholar]
- 30.Zhou Z, Cironi P, Lin AJ, Xu YQ, Hrvatin S, Golan DE, Silver PA, Walsh CT, Yin J. Genetically encoded short peptide tags for orthogonal protein labeling by sfp and AcpS phosphopantetheinyl transferases. Acs Chemical Biology. 2007;2:337–346. doi: 10.1021/cb700054k. [DOI] [PubMed] [Google Scholar]
- 31.Lakowicz JR. Principles of fluorescence spectroscopy. New York: Kluwer Academic/Plenum; 1999. [Google Scholar]
- 32.Machida M, Ushijima N, Machida MI, Kanaoka Y. Fluorescent Thiol Reagents.9 N-(7-Dimethylamino-4-Methyl-Coumariny)Maleimides (Dacm) - Novel Fluorescent Thiol Reagents. Chemical & Pharmaceutical Bulletin. 1975;23:1385–1386. [Google Scholar]
- 33.Campbell ID, Dwek RA, Dwek RA. Biological spectroscopy. Menlo Park, Calif: Benjamin/Cummings Pub. Co; 1984. [Google Scholar]
- 34.Selwyn MJ. A Simple Test for Inactivation of an Enzyme During Assay. Biochimica Et Biophysica Acta. 1965;105:193–194. doi: 10.1016/s0926-6593(65)80190-4. [DOI] [PubMed] [Google Scholar]
- 35.Wu G, Yuan Y, Hodge CN. Determining appropriate substrate conversion for enzymatic assays in high-throughput screening. Journal of Biomolecular Screening. 2003;8:694–700. doi: 10.1177/1087057103260050. [DOI] [PubMed] [Google Scholar]
- 36.Zhang JH, Chung TDY, Oldenburg KR. A simple statistical parameter for use in evaluation and validation of high throughput screening assays. Journal of Biomolecular Screening. 1999;4:67–73. doi: 10.1177/108705719900400206. [DOI] [PubMed] [Google Scholar]
- 37.NCGC, Assay Guidance Criteria. 2009 http://www.ncgc.nih.gov/guidance/HTS_Assay_Guidance_Criteria.html March 31 2009.
- 38.Wellings DA, Atherton E. Standard Fmoc protocols. Methods in Enzymology. 1997;289:44–67. doi: 10.1016/s0076-6879(97)89043-x. [DOI] [PubMed] [Google Scholar]


