


Abstract
Most cell-specific enhancers are thought to lack an inherent organization, with critical binding sites distributed in a more or less random fashion. However, there are examples of fixed arrangements of binding sites, such as helical phasing, that promote the formation of higher-order protein complexes on the enhancer DNA template. Here, we investigate the regulatory ‘grammar’ of nearly 100 characterized enhancers for developmental control genes active in the early Drosophila embryo. The conservation of grammar is examined in seven divergent Drosophila genomes. Linked binding sites are observed for particular combinations of binding motifs, including Bicoid–Bicoid, Hunchback–Hunchback, Bicoid–Dorsal, Bicoid–Caudal and Dorsal–Twist. Direct evidence is presented for the importance of Bicoid–Dorsal linkage in the integration of the anterior–posterior and dorsal–ventral patterning systems. Hunchback–Hunchback interactions help explain unresolved aspects of segmentation, including the differential regulation of the eve stripe 3 + 7 and stripe 4 + 6 enhancers. We also present evidence that there is an under-representation of nucleosome positioning sequences in many enhancers, raising the possibility for a subtle higher-order structure extending across certain enhancers. We conclude that grammar of gene control regions is pervasively used in the patterning of the Drosophila embryo.
INTRODUCTION
Cell-fate specification in the Drosophila embryo is controlled by genomic regulatory DNAs, primarily enhancers, which coordinate the expression of genes encoding sequence-specific transcription factors (TFs) or cell-signaling components that impinge on the activities of these TFs (1–4). For many developmental control genes the cis-regulatory regions far exceed the size of the protein coding sequences (5,6). Understanding how this regulatory information is used to control precise on/off patterns of gene expression has captured the attention of developmental biologists for many years and it has recently became a subject of quantitative explorations as well (7–15). Enhancers contain binding sites for multiple transcriptional regulators, which are sometimes organized to facilitate cooperative DNA binding interactions and/or other forms of synergy between the regulators (16–18).
It is not known to what extent the transcriptional networks controlling the early Drosophila embryo depend on fixed arrangements of DNA-binding sites (19–21). To date, direct cooperative interactions have been documented for just a handful of TFs. For example, Bicoid (Bcd) binds DNA in a cooperative manner (22,23), and these interactions depend on fixed arrangements of Bcd-binding sites in the enhancers controlling the expression of hunchback and knirps (3,23,24). Another confirmed example of cooperativity is seen for the two major regulators of dorsal–ventral patterning, namely, Dorsal (Dl) and Twist (Twi) (17,25,26). Arrangements of Dl and Twi-binding sites have been identified in a number of enhancers that control gene expression in the neurogenic ectoderm where there are diminishing levels of the Dl and Twi gradients (13). Bcd and Hunchback (Hb) are also thought to function in a highly synergistic fashion, although the underlying mechanism is not known (27).
In addition to cooperative occupancy of linked sites, there are other forms of transcriptional synergy that might depend on fixed arrangements of binding sites. For example, interacting TFs can form novel protein interfaces on the enhancer DNA template, which are required for the recruitment of co-activator complexes (e.g. mediator) that are essential for transcriptional activation. In some cases, these interactions depend on the helical phasing of binding sites (20,28,29). In contrast, anti-helical site distributions might suggest avoidance of specific protein–protein contacts, facilitating independent action of multiple inputs (3,16). Short-range arrangements of binding sites might occur in the context of even less obvious long-distance organizational rules, influencing, for instance, nucleosome positioning or other aspects of higher-order chromatin structure (30).
In this study, the organization of binding sites has been examined for 30 different TFs in a collection of 96 early developmental enhancers that control the AP (anterior–posterior) and DV (dorso–ventral) patterning of the early Drosophila melanogaster embryo (31). The conservation of distances between sites has been examined in orthologous enhancer sequences in divergent Drosophila species (32). Binding site organization was investigated using distance histograms (3,33), and informational entropy (17). Statistically significant site arrangements were detected for a number of homotypic interactions, including linked sites for Bcd, Dl and Hb. Significant heterotypic site pairs were also identified. Clustered-binding sites are sometimes separated by nucleosome-positioning sequences, suggesting a subtle higher order organization across the length of the enhancer.
MATERIALS AND METHODS
Motif matches were identified using standard position weighted matrices (PWM), constructed from binding site alignments (34). Distance histograms were generated for pairwise motif combinations, distances were measured between the centers of binding motif matches (3). Informational cutoff values (or PWM cutoffs) were set equal for all motifs in each type of analysis; cutoff ranges were selected in a way that matches for all motifs are likely to have the same frequency (Supplementary Figure S1). Fourier analysis was performed using commercial signal processing software ‘Sigview’ by SignalLab. Statistical significance of periodic signals was estimated by bootstrapping positions of binding motif matches in each enhancer.
Scoring conservation and sharing was performed using information entropy (17,35). The scores were calculated for each site pair with respect to the number of genes (96) and the number of species (7). Given a set of M sequence groups (enhancers), each represented by N different sequences (orthologs), one can calculate loss of entropy for a feature (motif combination) shared by a subset of sequences in every sequence group. Loss of the system entropy ΔH is equal to the loss of entropy due to conservation ΔHC (sharing by sequences) plus loss of entropy due to sharing ΔHS (sharing by sequence groups):
| 1 |
Substituting each term by the standard Shannon entropy formula returns the entropy score for a motif combination:
| 2 |
In this formula, M is the number of sequence groups (enhancers), N is the number of sequences (orthologs), equal in each group; Ki is the number of orthologs in each sequence group, where the feature is present; Lj is the number of sequence groups, where the feature is present, calculated for each species (group of orthologs). Distribution of motif combinations among species was neglected in this study; therefore Lj was calculated as the maximal possible number of the sequence groups in each species (see Figure S6 in Supplementary Data). The resulting formula is symmetric: the higher the number of species under consideration, the less the weight of the conservation (first term), the higher the number of genes (enhancers), the less the weight of the sharing (second term). Supplementary Figure S7 (Supplementary Data, file 1) demonstrates this dependency. P-values for the entropy scores were estimated by shuffling columns in the binding motif alignments (bootstrapping) and repeating search with the randomized motifs 100 times. Formula (2) is valid only if orthologs are significantly different; therefore closely related species were eliminated from the consideration. Database of the extracted site pairs is available from UC Berkeley web resource: http://flydev.berkeley.edu/cgi-bin/Annotation/index.htm.
Drosophila melanogaster strain yw67 was used for in situ hybridizations, as described previously (36). Bcd−/− embryos were collected from non-Cy females harvested from the stock of flies with the genotype [yw; CyO, bcd+/+; ri, bcdE1, roe, pp] received as a gift from Dr H. Struhl Laboratory. Antisense dig-labeled RNA probes against brk, sog and rho were generated as described earlier (15). Expression data for gap and pair-rule genes was downloaded from FlyEx database (37).
RESULTS
Enhancer sequences, binding motifs and divergent Drosophila species
Nearly 100 characterized enhancers and ∼30 associated binding motifs control the patterning of the early Drosophila embryo, probably the best understood developmental process (8,9,31,38–40). These enhancers and sequence-specific TFs regulate the expression of ∼50 genes controlling AP and DV patterning, including segmentation (9,41) and gastrulation (42). The known TFs controlling embryogenesis represent less than ∼10% of all TFs in the Drosophila genome (11). Thus, we restrict our analysis of regulatory grammar to the ∼100 AP and DV enhancers and their ∼30 TF inputs (31).
The recent completion of whole-genome sequence assemblies for 12 divergent Drosophila species has created an unprecedented opportunity for analyzing enhancer evolution (32,43). Here, 96 selected enhancer sequences from D. melanogaster were mapped to all 12 Drosophila genomes, using the UCSC Browser (44). The resulting collection combined 1420 kb of genomic sequence data in 1127 sequences, representing 60 enhancers in 23 AP genes and 36 enhancers in 31 DV genes. The entire collection of sequences and binding motifs is available at UC, Berkeley on-line resource: http://flydev.berkeley.edu/cgi-bin/Annotation/index.htm.
Inspection of aligned enhancer sequences among all 12 Drosophila species revealed strong conservation within the D. melanogaster subgroup (D. melanogaster, D. simulans, D. seichellia, D. yakuba and D. erecta) and also within the D. obscura group (D. pseudoobscura and D. persimilis). In order to focus on evolutionary changes in these enhancers we analyzed the seven most divergent Drosophilids: D. melanogaster, D. ananassae, D. pseudoobscura, D. willistoni, D. mojavensis, D. virilis and D. grimshawi. The remaining five species contain conservation patterns that are similar to those present in D. melanogaster or D. pseudoobscura.
Short-range distance preferences and periodicities
Short-range TF-binding linkages (0–80 bp) were examined in the collection of 96 enhancers from seven species for homo- and heterotypic pairs of binding motifs. Binding sites for the 30 most reliable TF motifs (see the UC, Berkeley online resource) were mapped in enhancers using position weight matrices with match probability cutoff values set to ∼2E-04 (see ‘Materials and Methods’ section and Supplementary Figure S1). Distance histograms were generated for distances smaller than 80 bp, measured between the putative centers of each pair of neighboring site matches (Supplementary Figure S2). Periodic signals were identified in the distance histograms using Fourier analysis, and statistical significance was estimated by bootstrapping positions of site matches in each enhancer sequence (see ‘Materials and Methods’ section and Supplementary Figure S3).
Fourier analysis has identified helical phasing (∼11 bp spacing) for several different homotypic activator–activator motif pairs (Figure 1 and Table 1). Such periodic signals were found in the distributions of Bcd-binding sites, as previously reported (3) (Figure 1E and Table 1). Weaker helical-phasing signals were also identified for Caudal (Cad) and Dl-binding sites (Figure 1C and H). Periodic signals close to two DNA turns (∼20–22 bp) were found for Twi, Hb and Kruppel. Such helical phasing raises the possibility of direct protein–protein interactions (see ‘Discussion’ section).
Figure 1.

Periodic distribution of binding sites in fly enhancers. Fourier analysis of distance histograms reveals periodic distribution of binding sites. All helical signals are marked by red (one DNA turn), green (two turns) or blue (three turns) labels. Black labels mark anti-helical signals, numbers above show periodicities. Red gridline show expectation, grey gridlines show standard deviations, found from bootstrapping positions of the binding site matches in each enhancer. (A) Spectrum for all motif combinations; (B) Spectrum for homotypic motif pairs: Bcd–Bcd, Brk–Brk, Cad–Cad, Dl–Dl, Gt–Gt, Hb–Hb, Kni–Kni, Kr–Kr, Sna–Sna, Twi–Twi, Vnd–Vnd, Zen–Zen. (C, E, F, H and I) Spectra constructed for individual homotypic motif pairs. (D) Spectrum for heterotypic activator–repressor motif pairs combined from AP activators (Bcd, Cad, Hb)—AP repressors (Gt, Kr, Kni), and DV activators (Dl, Twi, Zen)—DV repressors (Brk, Vnd, Sna). (G) Spectrum constructed for relevant heterotypic activator–activator motif pairs: Bcd–Cad, Bcd–Hb, Cad–Hb, Dl–Twi, Dl–Zen, Twi–Zen.
Table 1.
Short-range periodicities in the distributions of binding sites
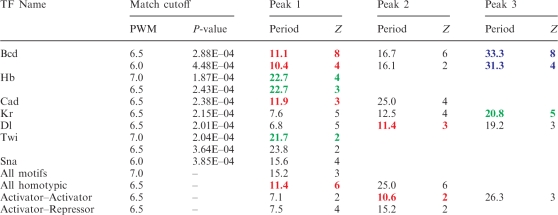 |
Exact periods (in bases) for the Fourier spectra shown in Figure 1 are presented here. Z-scores for each signal were computed by bootstrapping site match positions in each enhancer. The helical phasing signals (shown in color) are present in homotypic and heterotypic Activator–Activator site combinations. Majority of heterotypic site combinations, including Activator–repressor combinations, demonstrate anti-helical signals with periodicity ∼15 bases.
A weaker, ∼11.4-bp periodic signal was detected in the distribution of heterotypic activator–activator site pairs, including Dl–Twi and Bcd–Cad (Figure 1G). In contrast, there is a significant reduction in helical phasing signatures for activator–repressor motif pairs, and in fact, an over-representation of site pairs with ‘anti-helical’ spacing (15.2 bp) (Figure 1D). A similar 15.2 bp anti-helical signal was detected in distributions of all possible pair-wise combinations of the 30 binding motifs examined in this study (Figure 1A). Thus, it would appear that any two randomly chosen binding sites are more likely to occupy the opposite sides of the DNA duplex as compared with helical phasing (3,16). This observation raises the possibility that most TFs function either additively or antagonistically to one another and just a special subset of TFs function in a synergistic fashion as reflected by helical phasing of the associated binding sites (see ‘Discussion’ section).
Long-range distance preferences
In the preceding analysis we considered ‘short-range’ organizational constraints, involving linked binding sites separated by <25–30 bp. We now consider the possibility of ‘long-range’ constraints. The 96 enhancers under study possess characteristic ‘unit lengths’ of ∼500 bp – 1.5 kb (300 bp minimum, see Supplementary Figure S4). The minimal/maximal sizes of the functional enhancers and the ‘optimal’ site densities can be determined by the amount of encoded information (pattern complexity) (38,45), mechanisms of TF–DNA recognition such as lateral diffusion (46,47), or structural chromatin features like nucleosome positioning (48,49).
Differential distance histograms reveal an over-representation of short-range linkages (<50 bp), but a depletion in mid-range distances (100–500 bp). These observations raise the possibility that TFs are distributed in a non-uniform manner across the length of the enhancer. That is, there may be sub-clusters, or ‘hotspots’, of binding sites within a typical enhancer. Such hotspots are observed in the prototypic eve stripe 2 enhancer, whereby 8 of the 12 critical binding sites are observed within two ∼50-bp fragments located at either end of the minimal 480 bp enhancer (1). Homotypic motifs display the greatest propensity for such sub-clustering (Figure 2A). Homotypic clusters (38) usually contain 3–5-binding sites distributed over 50–100 bp. Heterotypic activator–activator motif pairs also demonstrate sub-clustering, but these clusters are smaller (<25–30 bp) and usually contain just a pair of heterotypic sites (Figure 2B). Heterotypic activator–repressor pairs (Figure 2D) show moderate enrichment over a distance of 50–70 bp, which is in agreement with the well-documented phenomenon of ‘short-range repression’ (50). Depletion of mid-range spacing constraints (around ∼200 bp) is especially striking in the case of heterotypic motif pairs (Figure 2B–D). Thus, activator synergy is like short-range repression: it appears to depend on closely linked binding sites.
Figure 2.

Long-range dependencies in the binding site distributions. (A–D) show differential long-range distance histograms (ΔN = Nobserved – Nexpected) for selected homo- and heterotypic motif combinations. Gridlines on A–D show standard deviations, σ. Both ΔN and σ were computed by bootstrapping positions of the binding site matches in each enhancer. Two distance depleted regions in the ranges 100–250 and 300–450 on (C) may represent generalized nucleosomal footprint in all enhancers. (E–G). Enhancers of even-skipped display negative agreement between the site density (red line) and the nucleosome formation potential (green line).
A possible explanation for this depletion of mid-range spacing is the occurrence of positioned nucleosomes, which might separate functionally distinct regions within an enhancer, and also separate neighboring enhancers (48,51,52). To test this hypothesis, nucleosome formation potential was compared with the distributions of TF-binding motifs in enhancers using the ‘Recon’ program (53,54) (Figure 2E–G). Three of the four eve enhancers that were examined (eve 1+5, eve 2 and eve 4+6) display a clear negative correlation between potential nucleosome formation and the distribution of TF-binding sites. This observation is consistent with the depletion of nucleosomes near TF-binding sites in vertebrates (52). This anti-correlation is especially striking in the case of the bipartite eve stripe 1+5 enhancer (Figure 2G), where two enhancer regions (stripe 1 and stripe 5) are separated by a 400 bp ‘spacer’ DNA (in positions 600–1000), which might promote positioning of two nucleosomes and associated linker sequences.
To investigate nucleosome positioning further, nucleosome-forming potential (53) was measured in two sets of sequences, previously identified based on clustering of Dl sites and tested in vivo for enhancer activity (8). One set of sequences functioned as bona fide enhancers and produced localized patterns of gene expression across the DV axis of early embryos. The other set produced no expression in transgenic embryos, despite the presence of the same quality Dl-binding site clusters. The nucleosome-forming potential of the enhancers (true positives) was lower than that of the non-functional sequences (false-positives, see Supplementary Table S1). These observations raise the possibility that the false Dl-binding clusters fail to function due to the formation of inactive nucleosomal structures (see ‘Discussion’ section).
Shared and conserved binding site pairs
All 465 possible pairwise motif combinations for the 30 relevant binding motifs (see the UC, Berkeley web resource) were tested for conservation in divergent drosophilids. Only linked binding sites, separated by a distance with small variations (max. distance bin = five bases) were considered. In the case of motif pairs, statistical significance was evaluated by bootstrapping columns in the binding motif alignments, thus preserving patterns of conservation (see ‘Materials and Methods’ section). Table 2 shows the most significant of the identified site pairs. Pairs of homotypic motifs strongly prevailed in this type of analysis (28% of total pairs versus 6.5% expected, see also distance histograms in Figure 2), suggesting that homotypic interactions are important and pervasive in embryonic patterning. The strongest linkages were found for Bcd, Cad and Hb homotypic pairs. Each of these pairs was shared by five to six different enhancers and conserved in four to seven species. Among the identified heterotypic motif pairs, the most interesting were Bcd–Dl, Bcd–Cad and Dl–Twi (see ‘Discussion’ section).
Table 2.
Shared and conserved motif combinations
 |
The top 25 most significant shared and conserved motif combinations (P < 0.03). An exception was made for Bcd-Hb motif combination with P-value 0.06. Curly brackets in the column ‘Target enhancers’ show the number of species, where the motif combinations were detected. Variations in the parameter values and the resulting changes are shown in red. All identified motif combinations are available from the University of California, Berkeley web resource: http://flydev.berkeley.edu/cgi-bin/Annotation/index.htm.
To identify cases of binding site pairs organized in a more flexible fashion, significant motif combinations were extracted using large distance bins or large distance variations (Table 3). Along with the previously identified motif pairs, this analysis revealed several additional combinations, mainly involving the ‘TAG-team’ sequence motif, which is recognized by Zelda, a ubiquitous zinc finger TF. Zelda participates in the activation of the early zygotic genome and regulates a wide range of critical patterning genes (55,56). Indeed, significant combinations were identified for the TAG motif and Bcd, Dl and Hb. However, all of these TAG-X combinations exhibit spacing variability in different Drosophilids (Table 3).
Table 3.
Flexible motif combinations
| Motif combination |
Search parameters |
Search results |
|||||
|---|---|---|---|---|---|---|---|
| Motif 1 | Motif 2 | Cutoff, Bit | Distance bin, bases | Distance, bases | Entropy | P-value | Target enhancers, seven species |
| Bcd | Bcd | 6.0 | 40 | 0–40 | 19.86 | <0.01 | tll-plus4, kni-cis, kr-CD1, eve-15, sal-E, tll-AD, gt-1 |
| Bcd | Dl | 6.0 | 40 | 0–40 | 11.23 | 0.02 | sal-E, brk, kr-CD1, sog |
| Bcd | Gt | 6.0 | 40 | 0–40 | 8.42 | 0.03 | kr-CD1, eve-2, gt-P |
| Bcd | Hb | 6.0 | 40 | 0–40 | 14.04 | 0.11* | ems-up, kr-CD1, kni-cis, gt-P, kni-plus1 |
| Bcd | caggtag | 6.0 | 40 | 0–40 | 8.42 | 0.03 | tll-plus4, sal-E, h-1 |
| Cad | Cad | 6.0 | 40 | 0–40 | 22.71 | 0.02 | kr-CD2, h-267, kni-cis, hb-cis, ems-up, nub-blst, h-15, kr-AD2 |
| Dl | Grh | 6.0 | 40 | 0–40 | 8.42 | 0.03 | brk-S, sog, dpp |
| Dl | Sna | 6.0 | 40 | 0–40 | 8.42 | 0.03 | sog-S, rho, zen |
| Dl | caggtag | 6.0 | 40 | 0–40 | 14.04 | 0.01 | brk-S, sog-S, dpp, sog, fkh-minus2 |
| Dl | Twi | 6.0 | 40 | 0–40 | 11.23 | 0.02 | vn, brk, rho, vnd-V |
| Hb | Hb | 6.0 | 40 | 0–40 | 42.72 | <0.01 | odd-36, gt-P, kr-AD2, ems-up, eve-15, kr-CD2, eve-37, eve-46, kr-CD1, kni-plus1, h-15, h-267, nub-blst, hb-cis, kni-cis |
| Hb | Kni | 6.0 | 40 | 0–40 | 14.04 | 0.11* | kni-plus1, eve-37, eve-46, odd-36, kni-cis |
| Hb | Kr | 6.0 | 40 | 0–40 | 19.86 | 0.04 | gt-P, kni-cis, kni-plus1, eve-15, pdm2-plus3, hb-cis, h-267 |
| Hb | caggtag | 6.0 | 40 | 0–40 | 19.86 | 0.04 | kr-CD2, kni-cis, hb-cis, gt-P, eve-15, tll-AD, nub-blst |
| Hb | Tll | 6.0 | 40 | 0–40 | 16.84 | 0.04 | odd-36, kni-cis, nub-blst, kni-plus1, h-267, eve-37 |
| Kr | Kr | 6.0 | 40 | 0–40 | 8.42 | 0.03 | h-1, ftz-15, eve-15 |
| Kr | caggtag | 6.0 | 40 | 0–40 | 8.42 | 0.03 | h-1, odd-5, gt-P |
| Pnt | caggtag | 6.0 | 40 | 0–40 | 8.42 | 0.03 | tll-AD, sal-E, twi |
The most significant motif combinations with flexible distances are shown. Notice presence of TAGteam (caggtag) motif in combinations with all major morphogenes—Bcd, Hb, Dl. Exact distance conservation in these combinations is not essential, however the actual distances (data not shown) still conform to the long-range grammar rules (see Figure 2 and ‘Discussion’ section). *P-values exceeding P-value threshold.
The most prominent motif combination models, along with several isomorphic motif pairs, are shown in Figure 3. It is conceivable that these results represent an underestimate of significantly linked motif combinations since very conservative cutoff values were used for statistical evaluation (bootstrapping-binding motifs, see ‘Materials and Methods’ section). A database of shared and/or conserved motif pairs, including those below the selected significance cutoff P = 0.03 is available from the UC, Berkeley online resource.
Figure 3.

Shared and conserved motif combinations. (A) Sequence logos demonstrate models for the most significant shared and conserved motif combinations; some motif combinations produced more than one model. (B–D) Alignment of sequences for three selected combinations: (C) Bcd–Dl, (B) Hb–Hb1 and (D) Hb–Hb2. Alignments for the other motif combinations are available from UC Berkeley web resource. Sequence logos with asterisk on (A) marks previously known motif combinations, which produced low P-value (Bcd–Hb), or were missed in the automatic search (AT–Dl).
Role of Bcd–Dl and Hb–Hb site pairs
Conserved Bcd-Dl-binding site pairs were identified in the enhancers of several AP- and DV-patterning genes (Figure 3C), including sal (AP), brk and sog (DV). The sites were found at similar distances, in the same orientation and were conserved in all seven species. It was suggested that the Bcd sites in the brk enhancer might augment gene expression in anterior regions, but this possibility was not directly tested (4). In wild-type embryos, both brk and sog exhibit significantly broader patterns of gene expression in anterior regions (Figure 4C, D, E and F). This expanded pattern is lost in bcd - mutants.
Figure 4.

Ap modulation of dv genes. Expression patterns of dv genes brk, rho and sog in wild-type (A, C and E) and in bcd– embryos (B, D and F). In the absence of Bcd, all three genes are expressed as lateral stripes, corresponding to future ventral neuroectoderm. In the wild-type embryos, brk and sog, but not rho stripes are significantly broader in the anterior. Bcd–Dl motif combinations were identified in brk and sog, but not in rho enhancers. Embryos oriented anterior-to-posterior from left to right and dorsal-to-ventral from top to bottom.
Highly conserved Hb tandem repeats were detected in the regulatory regions of pair-rule genes, in the gap gene Kruppel, and in the Notch-signaling gene nubbin (Table 2 and Figure 3). Most of the homotypic Hb-Hb site pairs fall into two major groups, separated by either 6–8 or 13–15 bases (Figure 3B and D). Some of the pair-rule enhancers selectively conserve either the ‘short’ or ‘long’ arrangement. For example, the eve stripe 4 + 6 enhancer contains two short Hb elements, while the stripe 3 + 7 enhancer contains a single long element. The odd 3 + 6 enhancer contains both short and long elements with various degrees of conservation. The hairy stripe 2,6,7 enhancer contains a single short element. Among the known gap genes, the long and short Hb elements were widely present in the enhancers of Kruppel, and in the blastoderm enhancer of nubbin, but not in any of the known knirps enhancers. It is conceivable that the distinct Hb site arrangements are important for the differential regulation of pair-rule genes by the Hb gradient (see below).
DISCUSSION
The engineering of functional enhancers with predicted properties depends on an understanding of regulatory grammar and its role in enhancer function. Synthetic enhancers created from the simple ‘sum’ of the binding sites often fail to capture the activities of the authentic enhancers (7,57–59). The comprehensive search for grammar led to the identification of conserved short-range and long-range features in enhancer organization. The short-range arrangements correspond to linked binding sites, or composite elements, for a number of the sequence-specific TFs that control AP and DV patterning. In some cases, it is possible that the long-range arrangements are constrained by nucleosome-positioning sequences, as we discuss below.
Periodic site arrays and ‘surface’ arrangements
We have investigated the distribution of ∼30 well-defined sequence motifs within nearly 100 confirmed enhancers active in the early Drosophila embryo. Both short-range (0–80 bp) and long-range (0–1000 bp) organizational features were observed. One of the most striking short-range arrangements is helical phasing (11-bp periodicity, see Figure 1 and Table 1). For instance, the first three peaks in the distance histograms for Cad–Cad and Bcd–Bcd pairs are very similar and correspond to ∼11 bp, 22 bp and 33 bp, i.e. one, two and three turns of the DNA double helix. Peaks close to 23 bp and 35 bp are also present in the Dl–Dl distance histogram (Supplementary Figure S2). Periodic signals close to two DNA turns were also found for Hb–Hb and Twi–Twi site pairs. Moreover, helical phasing is also observed for certain pairs of heterotypic activators (Figure 1G). In contrast, helical phasing signals are not present in the histograms of heterotypic site pairs containing repressors (Figure 1A and D).
Periodic spacing suggests direct cooperative interactions between TFs. Indeed, cooperative binding has been documented for Bcd monomers (23) (Figure 1E). Alternatively, periodic phasing might reflect preferential ‘surface arrangements’ of binding sites on one side of the double helix. This might serve to foster multiple protein–protein contacts and the efficient recruitment of ‘coactivator’ complexes (20). Both cooperativity and surface arrangements might be important for Hb (see below), given the complex biological activities of this TF (60,61).
Helical phasing is not detected for pairs of activators and repressors (Figure 1A and D). Instead, such pairs tend to be located on opposite DNA surfaces, which might reflect independent or additive action of the corresponding TFs (3). Indeed, the peak distance of activator–repressor pairs is clearly a half-turn out of phase with the peak distance for activator–activator arrangements (compare Figure 1D and G). The activator–repressor spectrum contains a clear anti-helical signal of 15.2 bp, with a significant dip in the vicinity ∼11 bp.
Nucleosome positioning in enhancers
There is an under-representation of mid-range distances among binding sites (∼200–300 bp) (Figure 2 and Supplementary Figure S3, panels B and D). Indeed, comparison of binding site densities and enhancer borders with nucleosome positioning sequences (Figure 2E–G and Supplementary Table S1) suggested the occurrence of nucleosome depleted ‘windows’ along with positioned nucleosomes in enhancer regions (48,51,52).
There is a very striking inverse correlation between the position of linked Dl-Twi-binding sites and nucleosome positioning potential within the rho and vn enhancers (Figure 5B and D). Nucleosome positioning might be a mechanism for limiting the potential activities of spurious TF-binding sites. Nucleosomes might also serve to separate neighboring enhancers or separate inputs of different types within enhancers or complex regulatory regions. For instance, the even-skipped 1 + 5 enhancer is a bipartite unit (62) that might be functionally separated by positioned nucleosomes (Figures 2G and 5C). The eve stripe 2 enhancer appears to have a nucleosome positioned between the two most critical TF-binding clusters (open windows, Figure 5A). Alternatively, the positioned nucleosomes might serve to bridge different enhancer regions, thus increasing the local concentration of binding sites or fostering synergy between distant sites. Interestingly, positions of nucleosomes in the eve 2 and eve 1 + 5 enhancers coincide with previously identified in these enhancers periodic sequences (31,63) (see legend to Figure 6A and B).
Figure 5.

Nucleosome formation potential and enhancer organization. Nucleosome formation potential [‘Recon’ program (53)] is shown in comparison with distribution of binding sites and binding site clusters in enhancers of eve, vn and rho. (A) eve stripe 2 enhancer has two regions with low nucleosome formation potential (see the map below). It is conceivable that two most critical site combinations (Bcd+Kr+Gt) are located in the ‘open windows’ with a nucleosome positioned in between. Blue bars on the map mark positions of fuzzy tandem repeats (63), coinciding with the local maximum of the nucleosome formation potential. Grey bars show predicted position of the positioned nucleosomes. Red line tracing of nucleosome formation potential marks the positions of enhancers. (B) eve stripe 5+1 enhancer region also has two regions with low nucleosome formation potential, possibly corresponding to the stripe 1 and stripe 5 enhancers. Positions of binding site clusters for Bcd, Hb and Kr (see plots below the map) coincide with the nucleosome-depleted regions. Two nucleosomes, separating eve stripe 1 and eve stripe 5 enhancers can prevent mixing of inputs to each enhancer. (C and D) Enhancers rho and vn have an open window coinciding with positions of the most critical Dl–Twi element (66).
Figure 6.

Regulation of gap and pair-rule genes by Hb. Spatial expression patterns of gap (A) and pair-rule genes (B) in comparison with Hb gradient at cell division cycle 14, stage 3 and stage 7 correspondingly. (A) Hb regulates Kr in a concentration-dependent manner, activating it a low concentrations and repressing at high; Hb acts as a dedicated repressor of kni. (B) Pair-rule stripes Eve 3, Odd 3 and Eve 4 overlap different levels of Hb gradient, as well as their ‘mirror’ stripes Eve 6, Odd 6, Eve 7. Single enhancer (see connecting brackets) regulates each pair of such mirror stripes. (C) Kr enhancers (three enhancers, including all orthologs, 21 sequences) contain closely spaced Hb tandems, separated by 4–6 bases; kni enhancers contain Hb palindromes, separated by 11–12 bases. (D) Genes dual regulated by Hb contain conserved tandems of Hb sites (see also Figure 3). There is also a striking reverse correlation between spacing in the Hb tandems and the position of posterior expression borders of the target genes relatively to Hb gradient: the farther the stripe from Hb peak the shorter the spacing between the Hb sites in tandem (compare B and D).
Heterotypic site pairs and signal modulation
We have previously argued that linked heterotypic activator sites can amplify transcriptional signals in a manner analogous to bipolar transistors in electronic circuits (17). One activator in the pair has a very specific expression pattern (or profile) and serves as the signal carrier. The second activator has a broad (ubiquitous) distribution and is expressed at higher levels. Interactions between the two activators lead to amplification of the specific signal. This hypothesis was originally suggested for linkage between Dl and Twi sites, where Dl serves as the general activator, and Twi as the specific (signal carrier) activator (13,17).
Additional heterotypic site combinations were identified in the present study: Bcd–Dl, Bcd–Cad, Dl–TAG (see Tables 2 and 3; Figure 3 and UC Berkeley web resource). In the case of linked Dl–TAG sites, the ubiquitous Zelda activator might amplify Dorsal in lateral and dorsal regions of the presumptive neurogenic ectoderm, where there are diminishing levels of nuclear Dorsal. Here, the Dorsal gradient might play the role of the signal carrier, amplified by the ubiquitously distributed maternal Zelda activator. Similarly, Bcd–Dl interactions might amplify sog and brk expression in anterior–lateral regions, where the concentration of Dorsal is low (specific activator) but Bcd is high (see Figure 4 and mathematical model in Supplementary Figure S5). Similar integration of intersecting patterning signals has been described for Drosophila oogenesis (64).
Homotypic site pairs and sensitivity thresholds
The most significant homotypic site combinations were found for Bcd, Cad and Hb (Table 2). Bcd cooperativity has been reported previously (23), along with periodic distributions of Bcd-binding sites (3). It is possible that Bcd–Bcd synergy does not always depend on direct cooperative binding interactions. For example, one significant Bcd–Bcd combination (see UC Berkeley web resource) contains two sets of tandem Bcd-binding sites separated by 44–46 bases. This configuration might promote a surface arrangement of Bcd monomers, and the formation of higher-order structures for the recruitment of coactivators, as discussed earlier.
Significant homotypic combinations were identified for Hb (Figure 3B and D). Several pair-rule and gap enhancers contain tandem pairs of Hb-binding sites that are separated by 5–15 bp (Figure 6). This particular arrangement of sites is observed only in enhancers that appear to be activated by Hb (60,61,65). A distinct arrangement of Hb-binding sites, with a palindromic orientation, is detected in the knirps enhancer, which is repressed by Hb (15) (Figure 6A, C and D). Moreover, there is a reverse correlation between positions of posterior limits of the expression stripes: Kr > Eve4 > Odd3 > Eve3 and distances between Hb sites in enhancers: Kr < eve4 + 6 < odd3 + 6 < eve3 + 7. It appears that enhancers responding to low Hb concentrations (e.g. the eve 4 + 6 enhancer) contain Hb-binding site pairs that are separated by smaller distances, as compared with enhancers responding to higher levels of Hb (e.g. eve 3 + 7 enhancer) (Figure 6B and D). Different binding distances might influence the strength of protein–protein cooperative interactions, with more closely linked sites fostering stronger cooperativity (13). Thus, the differential regulation of the eve 4 + 6 and 3 + 7 enhancers might depend not only on the number and affinity of Hb-binding sites (38,45,61), but also on their organization.
In conclusion, the systematic analysis of TF-binding sites in AP and DV patterning enhancers suggests a much higher degree of grammar, or fixed arrangements of binding sites, than is commonly believed. Developmental enhancers are thought to be highly flexible, with randomly distributed binding sites sufficing for the integration of multiple TFs. Our results suggest that a large number of enhancers contain conserved short-range arrangements of pairs of binding sites. For instance, virtually all of the enhancers that respond to intermediate and low levels of the Dl gradient contain conserved arrangements of Dl-binding sites along with recognition sequences for other critical DV determinants, such as Twist and Zelda. Cooperating pairs of Bcd sites are found in enhancers responding to low Bcd concentrations, such as Knirps. Finally, distinctive arrangements of Hb-binding sites might influence whether the associated target genes are activated or repressed by high or low levels of the Hb gradient.
SUPPLEMENTARY DATA
Supplementary Data are available at NAR Online.
FUNDING
National Institutes of Health [grant GM34431]. Funding for open access charge: Grant GM34431.
Conflict of interest statement. None declared.
Supplementary Material
ACKNOWLEDGEMENTS
The authors thank David Hendrix for mapping enhancer data to GBrowser and for critical comments. They also thank members of the Levine lab and the Center for Integrative Genomics for critical comments and stimulating discussions. Sequences, binding motifs, motif combinations and programs used in this study are available from UC, Berkeley online resource: http://flydev.berkeley.edu/cgi-bin/Annotation/index.htm; software programs are available from D.P. upon request (dxp@berkeley.edu).
REFERENCES
- 1.Small S, Kraut R, Hoey T, Warrior R, Levine M. Transcriptional regulation of a pair-rule stripe in Drosophila. Genes Dev. 1991;5:827–839. doi: 10.1101/gad.5.5.827. [DOI] [PubMed] [Google Scholar]
- 2.Stanojevic D, Small S, Levine M. Regulation of a segmentation stripe by overlapping activators and repressors in the Drosophila embryo. Science. 1991;254:1385–1387. doi: 10.1126/science.1683715. [DOI] [PubMed] [Google Scholar]
- 3.Makeev VJ, Lifanov AP, Nazina AG, Papatsenko DA. Distance preferences in the arrangement of binding motifs and hierarchical levels in organization of transcription regulatory information. Nucleic Acids Res. 2003;31:6016–6026. doi: 10.1093/nar/gkg799. [DOI] [PMC free article] [PubMed] [Google Scholar]
- 4.Markstein M, Zinzen R, Markstein P, Yee KP, Erives A, Stathopoulos A, Levine M. A regulatory code for neurogenic gene expression in the Drosophila embryo. Development. 2004;131:2387–2394. doi: 10.1242/dev.01124. [DOI] [PubMed] [Google Scholar]
- 5.Engstrom PG, Ho Sui SJ, Drivenes O, Becker TS, Lenhard B. Genomic regulatory blocks underlie extensive microsynteny conservation in insects. Genome Res. 2007;17:1898–1908. doi: 10.1101/gr.6669607. [DOI] [PMC free article] [PubMed] [Google Scholar]
- 6.Papatsenko D, Kislyuk A, Levine M, Dubchak I. Conservation patterns in different functional sequence categories of divergent Drosophila species. Genomics. 2006;10:10. doi: 10.1016/j.ygeno.2006.03.012. [DOI] [PubMed] [Google Scholar]
- 7.Ludwig MZ, Bergman C, Patel NH, Kreitman M. Evidence for stabilizing selection in a eukaryotic enhancer element. Nature. 2000;403:564–567. doi: 10.1038/35000615. [DOI] [PubMed] [Google Scholar]
- 8.Markstein M, Markstein P, Markstein V, Levine MS. Genome-wide analysis of clustered Dorsal binding sites identifies putative target genes in the Drosophila embryo. Proc. Natl Acad. Sci. USA. 2002;99:763–768. doi: 10.1073/pnas.012591199. [DOI] [PMC free article] [PubMed] [Google Scholar]
- 9.Schroeder MD, Pearce M, Fak J, Fan H, Unnerstall U, Emberly E, Rajewsky N, Siggia ED, Gaul U. Transcriptional control in the segmentation gene network of Drosophila. PLoS Biol. 2004;2:E271. doi: 10.1371/journal.pbio.0020271. [DOI] [PMC free article] [PubMed] [Google Scholar]
- 10.Levine M, Davidson EH. Gene regulatory networks for development. Proc. Natl Acad. Sci. USA. 2005;102:4936–4942. doi: 10.1073/pnas.0408031102. [DOI] [PMC free article] [PubMed] [Google Scholar]
- 11.Ashburner M, Bergman CM. Drosophila melanogaster: a case study of a model genomic sequence and its consequences. Genome Res. 2005;15:1661–1667. doi: 10.1101/gr.3726705. [DOI] [PubMed] [Google Scholar]
- 12.Jaeger J, Reinitz J. On the dynamic nature of positional information. Bioessays. 2006;28:1102–1111. doi: 10.1002/bies.20494. [DOI] [PubMed] [Google Scholar]
- 13.Zinzen RP, Senger K, Levine M, Papatsenko D. Computational models for neurogenic gene expression in the Drosophila embryo. Curr. Biol. 2006;16:1358–1365. doi: 10.1016/j.cub.2006.05.044. [DOI] [PubMed] [Google Scholar]
- 14.Gregor T, Wieschaus EF, McGregor AP, Bialek W, Tank DW. Stability and nuclear dynamics of the bicoid morphogen gradient. Cell. 2007;130:141–152. doi: 10.1016/j.cell.2007.05.026. [DOI] [PMC free article] [PubMed] [Google Scholar]
- 15.Zinzen RP, Papatsenko D. Enhancer responses to similarly distributed antagonistic gradients in development. PLoS Comput. Biol. 2007;3:e84. doi: 10.1371/journal.pcbi.0030084. [DOI] [PMC free article] [PubMed] [Google Scholar]
- 16.Hochschild A, Ptashne M. Cooperative binding of lambda repressors to sites separated by integral turns of the DNA helix. Cell. 1986;44:681–687. doi: 10.1016/0092-8674(86)90833-0. [DOI] [PubMed] [Google Scholar]
- 17.Papatsenko D, Levine M. A rationale for the enhanceosome and other evolutionarily constrained enhancers. Curr. Biol. 2007;17:R955–R957. doi: 10.1016/j.cub.2007.09.035. [DOI] [PubMed] [Google Scholar]
- 18.Apostolou E, Thanos D. Virus infection induces NF-kappaB-dependent interchromosomal associations mediating monoallelic IFN-beta gene expression. Cell. 2008;134:85–96. doi: 10.1016/j.cell.2008.05.052. [DOI] [PubMed] [Google Scholar]
- 19.Calhoun VC, Stathopoulos A, Levine M. Promoter-proximal tethering elements regulate enhancer-promoter specificity in the Drosophila Antennapedia complex. Proc. Natl Acad. Sci. USA. 2002;99:9243–9247. doi: 10.1073/pnas.142291299. [DOI] [PMC free article] [PubMed] [Google Scholar]
- 20.Casamassimi A, Napoli C. Mediator complexes and eukaryotic transcription regulation: an overview. Biochimie. 2007;89:1439–1446. doi: 10.1016/j.biochi.2007.08.002. [DOI] [PubMed] [Google Scholar]
- 21.Maksimenko O, Golovnin A, Georgiev P. Enhancer-promoter communication is regulated by insulator pairing in a Drosophila model bigenic locus. Mol. Cell Biol. 2008;23:23. doi: 10.1128/MCB.00461-08. [DOI] [PMC free article] [PubMed] [Google Scholar]
- 22.Zhao C, Dave V, Yang F, Scarborough T, Ma J. Target selectivity of bicoid is dependent on nonconsensus site recognition and protein-protein interaction. Mol. Cell Biol. 2000;20:8112–8123. doi: 10.1128/mcb.20.21.8112-8123.2000. [DOI] [PMC free article] [PubMed] [Google Scholar]
- 23.Lebrecht D, Foehr M, Smith E, Lopes FJ, Vanario-Alonso CE, Reinitz J, Burz DS, Hanes SD. Bicoid cooperative DNA binding is critical for embryonic patterning in Drosophila. Proc. Natl Acad. Sci. USA. 2005;102:13176–13181. doi: 10.1073/pnas.0506462102. [DOI] [PMC free article] [PubMed] [Google Scholar]
- 24.Fu D, Ma J. Interplay between positive and negative activities that influence the role of Bicoid in transcription. Nucleic Acids Res. 2005;33:3985–3993. doi: 10.1093/nar/gki691. [DOI] [PMC free article] [PubMed] [Google Scholar]
- 25.Ip YT, Park RE, Kosman D, Yazdanbakhsh K, Levine M. dorsal-twist interactions establish snail expression in the presumptive mesoderm of the Drosophila embryo. Genes Dev. 1992;6:1518–1530. doi: 10.1101/gad.6.8.1518. [DOI] [PubMed] [Google Scholar]
- 26.Jiang J, Levine M. Binding affinities and cooperative interactions with bHLH activators delimit threshold responses to the dorsal gradient morphogen. Cell. 1993;72:741–752. doi: 10.1016/0092-8674(93)90402-c. [DOI] [PubMed] [Google Scholar]
- 27.Simpson-Brose M, Treisman J, Desplan C. Synergy between the hunchback and bicoid morphogens is required for anterior patterning in Drosophila. Cell. 1994;78:855–865. doi: 10.1016/s0092-8674(94)90622-x. [DOI] [PubMed] [Google Scholar]
- 28.Kim YJ, Lis JT. Interactions between subunits of Drosophila mediator and activator proteins. Trends Biochem. Sci. 2005;30:245–249. doi: 10.1016/j.tibs.2005.03.010. [DOI] [PubMed] [Google Scholar]
- 29.Keller SA, Mao Y, Struffi P, Margulies C, Yurk CE, Anderson AR, Amey RL, Moore S, Ebels JM, Foley K, et al. dCtBP-dependent and -independent repression activities of the Drosophila Knirps protein. Mol. Cell Biol. 2000;20:7247–7258. doi: 10.1128/mcb.20.19.7247-7258.2000. [DOI] [PMC free article] [PubMed] [Google Scholar]
- 30.Kolesov G, Wunderlich Z, Laikova ON, Gelfand MS, Mirny LA. How gene order is influenced by the biophysics of transcription regulation. Proc. Natl Acad. Sci. USA. 2007;104:13948–13953. doi: 10.1073/pnas.0700672104. [DOI] [PMC free article] [PubMed] [Google Scholar]
- 31.Papatsenko DA, Makeev VJ, Lifanov AP, Regnier M, Nazina AG, Desplan C. Extraction of functional binding sites from unique regulatory regions: the Drosophila early developmental enhancers. Genome Res. 2002;12:470–481. doi: 10.1101/gr.212502. [DOI] [PMC free article] [PubMed] [Google Scholar]
- 32.Clark AG, Eisen MB, Smith DR, Bergman CM, Oliver B, Markow TA, Kaufman TC, Kellis M, Gelbart W, Iyer VN, et al. Evolution of genes and genomes on the Drosophila phylogeny. Nature. 2007;450:203–218. doi: 10.1038/nature06341. [DOI] [PubMed] [Google Scholar]
- 33.Ioshikhes I, Trifonov EN, Zhang MQ. Periodical distribution of transcription factor sites in promoter regions and connection with chromatin structure. Proc. Natl Acad. Sci. USA. 1999;96:2891–2895. doi: 10.1073/pnas.96.6.2891. [DOI] [PMC free article] [PubMed] [Google Scholar]
- 34.Papatsenko D. ClusterDraw web server: a tool to identify and visualize clusters of binding motifs for transcription factors. Bioinformatics. 2007;23:1032–1034. doi: 10.1093/bioinformatics/btm047. [DOI] [PubMed] [Google Scholar]
- 35.Shultzaberger RK, Chiang DY, Moses AM, Eisen MB. Determining physical constraints in transcriptional initiation complexes using DNA sequence analysis. PLoS ONE. 2007;2:e1199. doi: 10.1371/journal.pone.0001199. [DOI] [PMC free article] [PubMed] [Google Scholar]
- 36.Stathopoulos A, Van Drenth M, Erives A, Markstein M, Levine M. Whole-genome analysis of dorsal-ventral patterning in the Drosophila embryo. Cell. 2002;111:687–701. doi: 10.1016/s0092-8674(02)01087-5. [DOI] [PubMed] [Google Scholar]
- 37.Poustelnikova E, Pisarev A, Blagov M, Samsonova M, Reinitz J. A database for management of gene expression data in situ. Bioinformatics. 2004;20:2212–2221. doi: 10.1093/bioinformatics/bth222. [DOI] [PubMed] [Google Scholar]
- 38.Lifanov AP, Makeev VJ, Nazina AG, Papatsenko DA. Homotypic regulatory clusters in Drosophila. Genome Res. 2003;13:579–588. doi: 10.1101/gr.668403. [DOI] [PMC free article] [PubMed] [Google Scholar]
- 39.Papatsenko D, Levine M. Quantitative analysis of binding motifs mediating diverse spatial readouts of the Dorsal gradient in the Drosophila embryo. Proc. Natl Acad. Sci. USA. 2005;102:4966–4971. doi: 10.1073/pnas.0409414102. [DOI] [PMC free article] [PubMed] [Google Scholar]
- 40.Halfon MS, Gallo SM, Bergman CM. REDfly 2.0: an integrated database of cis-regulatory modules and transcription factor binding sites in Drosophila. Nucleic Acids Res. 2008;36:D594–D598. doi: 10.1093/nar/gkm876. [DOI] [PMC free article] [PubMed] [Google Scholar]
- 41.Ochoa-Espinosa A, Yucel G, Kaplan L, Pare A, Pura N, Oberstein A, Papatsenko D, Small S. The role of binding site cluster strength in Bicoid-dependent patterning in Drosophila. Proc. Natl Acad. Sci. USA. 2005;102:4960–4965. doi: 10.1073/pnas.0500373102. [DOI] [PMC free article] [PubMed] [Google Scholar]
- 42.Stathopoulos A, Levine M. Whole-genome analysis of Drosophila gastrulation. Curr. Opin. Genet. Dev. 2004;14:477–484. doi: 10.1016/j.gde.2004.07.004. [DOI] [PubMed] [Google Scholar]
- 43.Stark A, Lin MF, Kheradpour P, Pedersen JS, Parts L, Carlson JW, Crosby MA, Rasmussen MD, Roy S, Deoras AN, et al. Discovery of functional elements in 12 Drosophila genomes using evolutionary signatures. Nature. 2007;450:219–232. doi: 10.1038/nature06340. [DOI] [PMC free article] [PubMed] [Google Scholar]
- 44.Zweig AS, Karolchik D, Kuhn RM, Haussler D, Kent WJ. UCSC genome browser tutorial. Genomics. 2008;92:75–84. doi: 10.1016/j.ygeno.2008.02.003. [DOI] [PubMed] [Google Scholar]
- 45.Clyde DE, Corado MS, Wu X, Pare A, Papatsenko D, Small S. A self-organizing system of repressor gradients establishes segmental complexity in Drosophila. Nature. 2003;426:849–853. doi: 10.1038/nature02189. [DOI] [PubMed] [Google Scholar]
- 46.von Hippel PH, Berg OG. Facilitated target location in biological systems. J. Biol. Chem. 1989;264:675–678. [PubMed] [Google Scholar]
- 47.Slutsky M, Mirny LA. Kinetics of protein-DNA interaction: facilitated target location in sequence-dependent potential. Biophys. J. 2004;87:4021–4035. doi: 10.1529/biophysj.104.050765. [DOI] [PMC free article] [PubMed] [Google Scholar]
- 48.Tirosh I, Barkai N. Two strategies for gene regulation by promoter nucleosomes. Genome Res. 2008;18:1084–1091. doi: 10.1101/gr.076059.108. [DOI] [PMC free article] [PubMed] [Google Scholar]
- 49.Valouev A, Ichikawa J, Tonthat T, Stuart J, Ranade S, Peckham H, Zeng K, Malek JA, Costa G, McKernan K, et al. A high-resolution, nucleosome position map of C. elegans reveals a lack of universal sequence-dictated positioning. Genome Res. 2008;18:1051–1063. doi: 10.1101/gr.076463.108. [DOI] [PMC free article] [PubMed] [Google Scholar]
- 50.Gray S, Szymanski P, Levine M. Short-range repression permits multiple enhancers to function autonomously within a complex promoter. Genes Dev. 1994;8:1829–1838. doi: 10.1101/gad.8.15.1829. [DOI] [PubMed] [Google Scholar]
- 51.Fu Y, Sinha M, Peterson CL, Weng Z. The insulator binding protein CTCF positions 20 nucleosomes around its binding sites across the human genome. PLoS Genet. 2008;4:e1000138. doi: 10.1371/journal.pgen.1000138. [DOI] [PMC free article] [PubMed] [Google Scholar]
- 52.Daenen F, van Roy F, De Bleser PJ. Low nucleosome occupancy is encoded around functional human transcription factor binding sites. BMC Genomics. 2008;9:332. doi: 10.1186/1471-2164-9-332. [DOI] [PMC free article] [PubMed] [Google Scholar]
- 53.Levitsky VG, Podkolodnaya OA, Kolchanov NA, Podkolodny NL. Nucleosome formation potential of eukaryotic DNA: calculation and promoters analysis. Bioinformatics. 2001;17:998–1010. doi: 10.1093/bioinformatics/17.11.998. [DOI] [PubMed] [Google Scholar]
- 54.Levitsky VG, Katokhin AV, Podkolodnaya OA, Furman DP, Kolchanov NA. NPRD: nucleosome positioning region database. Nucleic Acids Res. 2005;33:D67–D70. doi: 10.1093/nar/gki049. [DOI] [PMC free article] [PubMed] [Google Scholar]
- 55.ten Bosch JR, Benavides JA, Cline TW. The TAGteam DNA motif controls the timing of Drosophila pre-blastoderm transcription. Development. 2006;133:1967–1977. doi: 10.1242/dev.02373. [DOI] [PubMed] [Google Scholar]
- 56.Liang HL, Nien CY, Liu HY, Metzstein MM, Kirov N, Rushlow C. The zinc-finger protein Zelda is a key activator of the early zygotic genome in Drosophila. Nature. 2008;456:400–403. doi: 10.1038/nature07388. [DOI] [PMC free article] [PubMed] [Google Scholar]
- 57.Szymanski P, Levine M. Multiple modes of dorsal-bHLH transcriptional synergy in the Drosophila embryo. EMBO J. 1995;14:2229–2238. doi: 10.1002/j.1460-2075.1995.tb07217.x. [DOI] [PMC free article] [PubMed] [Google Scholar]
- 58.Guss KA, Nelson CE, Hudson A, Kraus ME, Carroll SB. Control of a genetic regulatory network by a selector gene. Science. 2001;292:1164–1167. doi: 10.1126/science.1058312. [DOI] [PubMed] [Google Scholar]
- 59.Stathopoulos A, Levine M. Localized repressors delineate the neurogenic ectoderm in the early Drosophila embryo. Dev. Biol. 2005;280:482–493. doi: 10.1016/j.ydbio.2005.02.003. [DOI] [PubMed] [Google Scholar]
- 60.Hulskamp M, Pfeifle C, Tautz D. A morphogenetic gradient of hunchback protein organizes the expression of the gap genes Kruppel and knirps in the early Drosophila embryo. Nature. 1990;346:577–580. doi: 10.1038/346577a0. [DOI] [PubMed] [Google Scholar]
- 61.Papatsenko D, Levine MS. Dual regulation by the Hunchback gradient in the Drosophila embryo. Proc. Natl Acad. Sci. USA. 2008;105:2901–2906. doi: 10.1073/pnas.0711941105. [DOI] [PMC free article] [PubMed] [Google Scholar]
- 62.Fujioka M, Emi-Sarker Y, Yusibova GL, Goto T, Jaynes JB. Analysis of an even-skipped rescue transgene reveals both composite and discrete neuronal and early blastoderm enhancers, and multi-stripe positioning by gap gene repressor gradients. Development. 1999;126:2527–2538. doi: 10.1242/dev.126.11.2527. [DOI] [PMC free article] [PubMed] [Google Scholar]
- 63.Boeva V, Regnier M, Papatsenko D, Makeev V. Short fuzzy tandem repeats in genomic sequences, identification, and possible role in regulation of gene expression. Bioinformatics. 2006;22:676–684. doi: 10.1093/bioinformatics/btk032. [DOI] [PubMed] [Google Scholar]
- 64.Yakoby N, Bristow CA, Gong D, Schafer X, Lembong J, Zartman JJ, Halfon MS, Schupbach T, Shvartsman SY. A combinatorial code for pattern formation in Drosophila oogenesis. Dev. Cell. 2008;15:725–737. doi: 10.1016/j.devcel.2008.09.008. [DOI] [PMC free article] [PubMed] [Google Scholar]
- 65.Zuo P, Stanojevic D, Colgan J, Han K, Levine M, Manley JL. Activation and repression of transcription by the gap proteins hunchback and Kruppel in cultured Drosophila cells. Genes Dev. 1991;5:254–264. doi: 10.1101/gad.5.2.254. [DOI] [PubMed] [Google Scholar]
- 66.Hong JW, Hendrix DA, Papatsenko D, Levine MS. How the Dorsal gradient works: insights from postgenome technologies. Proc. Natl Acad. Sci. USA. 2008;105:20072–20076. doi: 10.1073/pnas.0806476105. [DOI] [PMC free article] [PubMed] [Google Scholar]
Associated Data
This section collects any data citations, data availability statements, or supplementary materials included in this article.