Abstract
Background
High-sensitivity C-reactive protein (hsCRP) and lipoprotein-associated phospholipase A2 (Lp-PLA2) are hypothesized to be biomarkers of systemic inflammation and risk of myocardial infarction (MI) and stroke. Little is known, however, about the stability of these markers over time, and in particular, about the effects of acute vascular events on these marker levels.
Methods
Serum samples were collected at 4 annual intervals in 52 stroke-free participants from the Northern Manhattan Study (NOMAS), and assayed for hsCRP and Lp-PLA2 mass and activitylevels using standard techniques. Log transformation of levels was performed as needed to stabilize the variance. Stability of marker levels over time was assessed using random effects models unadjusted and adjusted for demographics and other risk factors. In addition, samples from 37 initially stroke-free participants with stroke (n=17) or MI (n=20) were available for measurement before and after the vascular event (median 5 days, range 2–40 days). Levels before and after events were compared using non-parametric tests.
Results
HsCRP and Lp-PLA2 activity levels were stable over time, while Lp-PLA2 mass levels decreased on average 5% per year (p=0.0015). Using accepted thresholds to define risk categories of Lp-PLA2 mass, there was no significant change over time. HsCRP increased after stroke (from median 2.2 mg/L pre-stroke to 6.5 mg/L post-stroke; p=0.0067) and MI (from median 2.5 mg/L pre-MI to 13.5 mg/L post-MI; p<0.0001). Lp-PLA2 mass and activity levels both decreased significantly after stroke and MI (for Lp-PLA2 mass, from median 210.0 ng/mL to 169.4 ng/mL post-stroke, p=0.0348, and from median 233.0 ng/mL to 153.9 post-MI, p<0.0001).
Conclusion
Lp-PLA2 mass levels decrease modestly, while hsCRP and Lp-PLA2 activity appear stable over time. Acutely after stroke and MI, hsCRP increases, while Lp-PLA2 mass and activity levels decrease. These changes imply that measurements made soon after stroke and MI are not reflective of pre-stroke levels, and may be less reliable for long-term risk stratification.
Keywords: C-reactive protein, Biomarker, Inflammation, Ischemic-Stroke, Myocardial Infarction
INTRODUCTION
Systemic inflammatory biomarkers, including high-sensitivity C-reactive protein (hsCRP) and lipoprotein-associated phospholipase A2 (LpPLA2), predict risk of first and recurrent myocardial infarction (MI) and, possibly, stroke.1,2, 3 Some studies provide evidence that hsCRP levels in disease-free individuals may fluctuate from one visit to the next, however, suggesting limited utility of this measure.4,5 There is relatively little data available, however, about hsCRP stability in multi-ethnic population-based cohorts, and even less about stability of Lp-PLA2 over time.
Measurement of inflammatory biomarkers after ischemic events for the purpose of secondary risk prognostication may also be limited by the impact of the event itself on the biomarker. In the Northern Manhattan Study (NOMAS), for example, hsCRP levels measured acutely after stroke were associated with stroke severity and were higher among patients with stroke than among stroke-free participants from the same population.6,7 HsCRP was associated with mortality, but not recurrence of stroke or other vascular events. Lp-PLA2levels were not associated with stroke severity, however, and predicted subsequent vascular events, including recurrent stroke. It remains largely unexplored, however, whether levels of these biomarkers change when measured before and after an event in the same individual. Because we have early access to many of the participants in our prospective cohort study who are hospitalized with acute MI and stroke, we were able to compare levels of these biomarkers before and soon after vascular events.
We hypothesized that (1) levels of these biomarkers would remain stable on repeated measurement in event-free individuals over the course of several years; and (2) levels would change as a result of acute vascular events.
METHODS
Selection and evaluation of participants
NOMAS includes a population-based prospective cohort study in a multi-ethnic, urban population. Methods of participant recruitment, assessment, and follow-up have been described previously.8 Briefly, stroke-free participants were identified by random digit dialing. Participants were eligible if they had no history of stroke, were ≥40 years of age, and if they resided in northern Manhattan for ≥3 months. Baseline assessment included medical history ascertained using questions adapted from the Behavioral Risk Factor Surveillance System from the Centers for Disease Control and Prevention,9 neurological examination, and questionnaires regarding diet and alcohol consumption. Hypertension was defined by history of hypertension or use of anti-hypertensive medications, and diabetes by fasting blood glucose level ≥126 mg/dl or self-reported history of insulin or oral hyperglycemic use.8
The cohort was followed with annual telephone interviews and local hospital surveillance for stroke, myocardial infarction, and death. A 10% subsample returned for annual in-person visits. Serum samples were collected at 4 annual intervals in 52 participants, and assayed for hsCRP and LpPLA2 mass and activitylevels.
In addition, samples from 37 initially stroke-free participants with stroke (n=17) or MI (n=20) were available for measurement before and after the vascular event (median 5 days, interquartile range 4–8 days, range 2–40 days).
The study was approved by the Columbia University Medical Center (CUMC) Institutional Review Board, and all patients provided informed consent.
Biomarker assays
Blood samples were collected at the time of clinic visit or hospitalization in 5 cc serum separator tubes by a trained phlebotomist, centrifuged at 3000 g for 15 minutes, and then aliquotted into 2 mL Eppendorf tubes. Samples were stored at −80° C until assays were run. Serum samples were assayed for hsCRP using an enzyme-linked immunoassay (BioCheck, Foster City, CA), and Lp-PLA2 mass using a microplate-based ELISA (PLAC™ assay, diaDexus, Inc., South San Francisco, CA) as previously described.2,10 LpPLA2 activity was measured with a colorimetric method (diaDexus Inc, South San Francisco, California).11,12 Assays were run at a central laboratory at diaDexus, Inc. Laboratory personnel were blinded to all patient clinical data and outcomes.
Statistical Analysis
Means and standard deviations of hsCRP, Lp-PLA2 mass, and Lp-PLA2 activity were calculated. Levels of markers were log-transformed before analysis as needed to stabilize the variance. Stability of marker levels over time was assessed using random effects models before and after adjusting for demographics and other vascular risk factors, including level of low-density lipoprotein (LDL) and leukocyte count. Terms for interactions between use of lipid-lowering medication and change in marker levels over time were also added to account for the possible effect of use of these medications on marker levels. Marker levels before and after stroke or MI were compared using non-parametric tests (signed Wilcoxon). Type I error was set at 0.05. Statistical analysis was conducted using SAS Version 8.2 (SAS Institute, Cary, NC).
RESULTS
Serial measurements of biomarkers over time among those without events
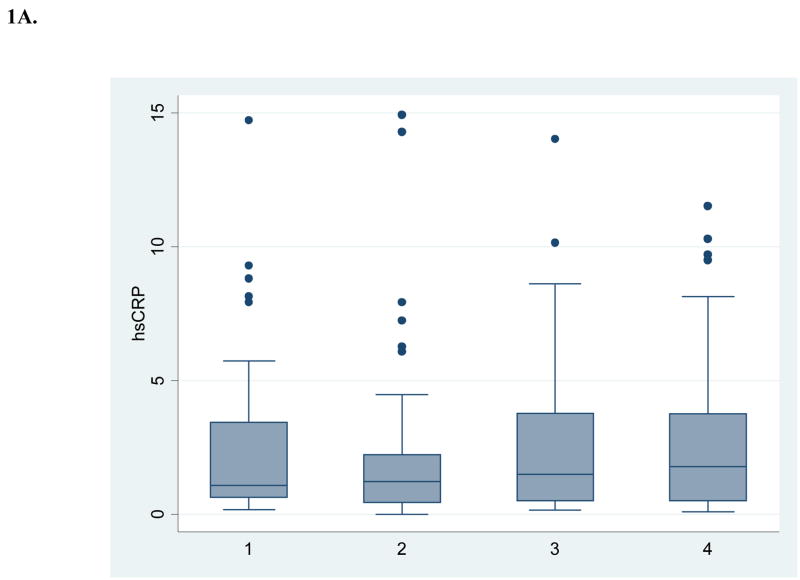
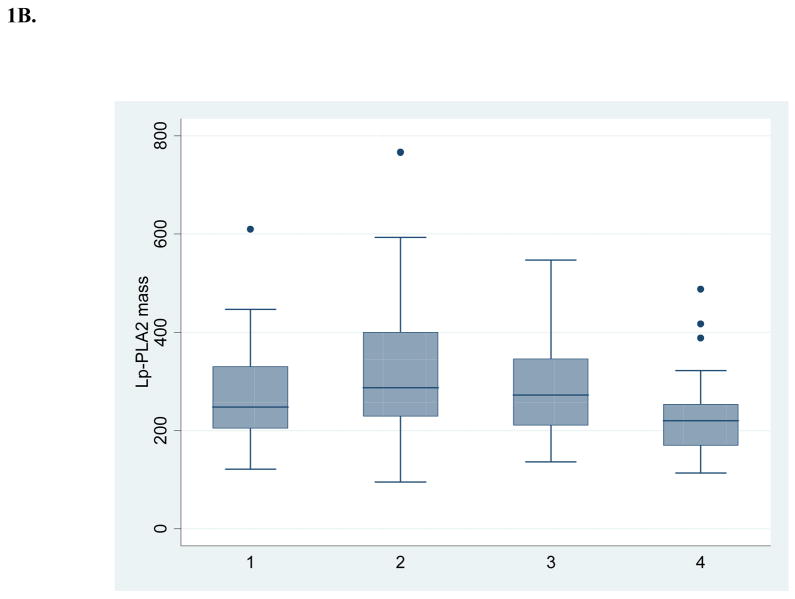
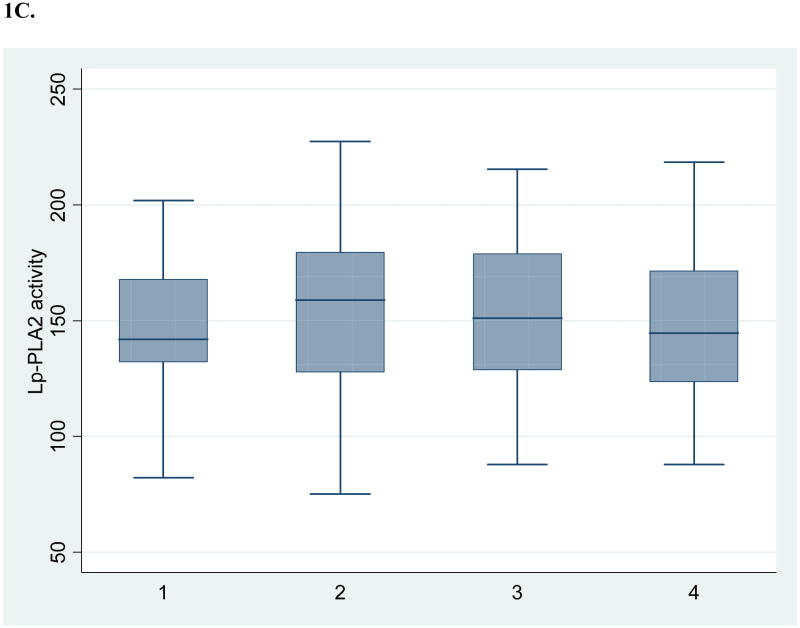
Table 1 shows the baseline demographic and vascular disease risk factor profile of the 52 subjects with 4 annual repeated measurements available for this analysis. Figure 1 shows box and whisker plots for crude measures of the biomarkers over annual intervals. Table 2 shows results for log-transformed values over time, both unadjusted and adjusted for demographics and risk factors. There was no evidence of a time trend in levels of hsCRP and Lp-PLA2 activity. Lp-PLA2 mass levels showed a modest decrease over time (5% per year, p=0.0041 after adjusting for other risk factors). There was marginal evidence of an interaction with the use of lipid-lowering medications during follow-up (p=0.0681), indicating a larger reduction in Lp-PLA2 mass among those on these medications. For those on these medications, there was a significant reduction in Lp-PLA2 mass over time (8% per year, p=0.0009), while among those not on these medications there was no significant reduction (3% per year, p=0.0655). No interaction with medication was present for hsCRP.
Table 1.
Baseline characteristics of stroke-free participants
| N | 52 |
| Age (mean ± SD) | 70.5 ± 9.9 yrs |
| Men (N, %) | 16 (30.8) |
| Race-ethnicity (N, %): | |
| Non-Hispanic White | 23 (44.2) |
| Non-Hispanic Black | 14 (26.9) |
| Hispanic | 15 (28.9) |
| Hypertension (N, %) | 42 (80.8) |
| Current smoking (N, %) | 8 (15.4) |
| Diabetes mellitus (N, %) | 7 (13.5) |
| Coronary disease (N, %) | 14 (26.9) |
| hsCRP (mg/L, median ± SD) | 1.42 ± 2.9 |
| Lp-PLA2 levels (mean ± SD) | |
| mass (ng/mL) | 251.2 ± 108.64 |
| activity (nmol/min/mL) | 150.6 ± 32.95 |
Figure 1. Crude levels of biomarkers at 4 annual intervals (n=52).
A. High sensitivity C-reactive protein
B. Lipoprotein-associated phospholipase A2 mass
C. Lipoprotein-associated phospholipase A2 activity
Table 2.
Changes in biomarker levels over time
| Change in level per year | p | |
|---|---|---|
| Log (hsCRP) | ||
| unadjusted | 0.04 | 0.38 |
| fully adjusted† | 0.05 | 0.36 |
| Log (Lp-PLA2 mass) | ||
| unadjusted | −0.05 | 0.0014 |
| fully adjusted† | −0.05 | 0.0041 |
| Lp-PLA2 activity | ||
| unadjusted | 0.39 | 0.69 |
| fully adjusted† | 0.35 | 0.73 |
Adjusted for age, sex, race-ethnicity, hypertension, diabetes, smoking, leukocyte count and low-density lipoprotein
Because Lp-PLA2 mass levels have formerly been dichotomized into high (> 235 ng/ml) and low-to-moderate (<235 ng/ml) risk categories,13 additional analyses were undertaken to determine whether risk categories changed during follow-up. There was no significant change in categories over time (p=0.23). Using a more recent dichotomization (high risk ≥200 ng/ml and low-to-moderate risk <200 ng/ml),14 there was evidence of annual decline in the proportion of those with Lp-PLA2 mass ≥200 ng/ml (adjusted OR = 0.70, p=0.01) The change in categories over time was significant among those taking lipid lowering medications (adjusted OR= 0.59, p= 0.0189), but not for those not on medications (adjusted OR=0.77, p=0.0694).
Differences in biomarker levels before and after acute events
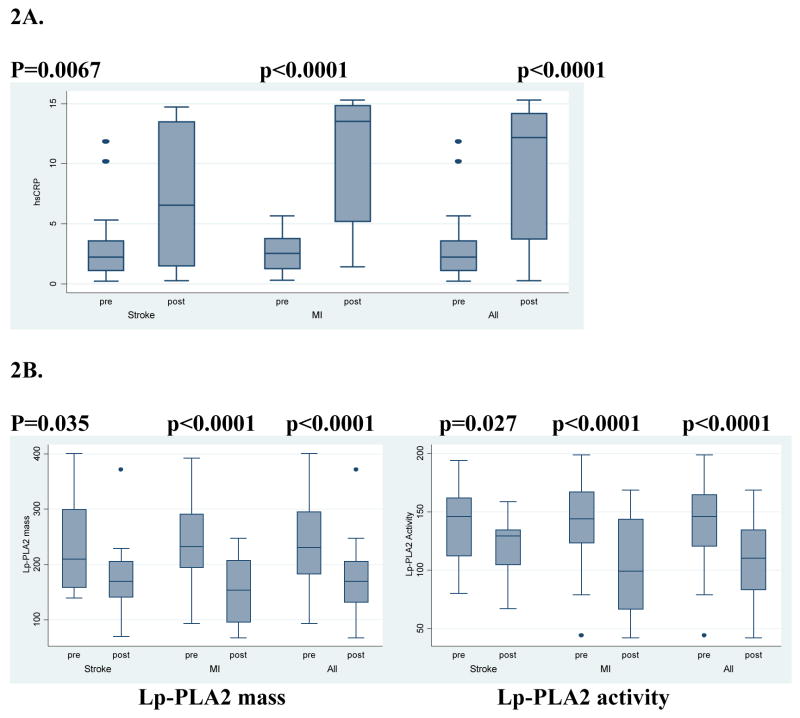
Figure 2 shows the levels of hsCRP before and after acute vascular events, both separately for stroke and MI and as a combined group. The mean time between the pre-event and the post-event measurement was 3.0 ± standard deviation 2.1 years (median 3.3 years).
Figure 2. Levels of biomarkers before and after acute vascular events (n=37).
A. High sensitivity C-reactive protein
B. Lipoprotein-associated phospholipase A2 mass and activity
HsCRP increased after stroke from a median of 2.2 mg/L pre-stroke to 6.5 mg/L post-stroke (p=0.0067). Levels increased after MI even more, from a median of 2.5 mg/L pre-MI to 13.5 mg/L post-MI (p<0.0001). Lp-PLA2 mass and activity levels both decreased significantly after stroke and MI. For Lp-PLA2 mass, levels decreased from a median of 210.0 ng/mL to 169.4 ng/mL post-stroke (p=0.0348), and from a median of 233.0 ng/mL to 153.9 post-MI (p<0.0001). Lp-PLA2 activity decreased from 145.9 to 129.2 nmol/min/mL post-stroke (p=0.027), and from 144.0 to 99.2 post-MI (p<0.0001).
In an analysis restricted to those whose sample was drawn within 7 days of the acute event (n=27), the results were essentially unchanged.
DISCUSSION
Inflammation is increasingly recognized to play an important role in atherosclerosis and stroke.1,15 Macrophages, cytokines, and leukocyte adhesion molecules contribute to vascular injury, endothelial dysfunction, plaque formation, plaque rupture, and coagulopathy.16 Because of this, serum levels of inflammatory biomarkers such as hsCRP, an acute phase protein, have been used as non-specific measures of vascular inflammation. Lp-PLA2 is an enzyme derived from leukocytes, particularly macrophages, that is involved in metabolism of LDL to the pro-inflammatory mediators lysophosphatidylcholine and oxidized fatty acids.3,10 Lysophosphatidylcholine increases expression of vascular adhesion molecules, upregulates cytokines and CD40 ligand, and stimulates macrophage proliferation.
Our findings provide evidence that hsCRP and LpPLA2activity levels are stable when repeated annually. Our findings are similar to findings of stability for hsCRP from other populations.17,18 In one study among patients with stable ischemic heart disease,4 hsCRP levels changed across sampling times, and these changes were associated with changes in risk categories.19 This study population differs from our own, however, in including only patients with coronary disease, using variable numbers of measurements per patient, and using measurements at timepoints from 15 days to 6 years. In our study, moreover, we modeled change while adjusting for other risk factors.
Similar data on stability of Lp-PLA2 is lacking, however. We found evidence of a modest decrement in Lp-PLA2mass levels, though these changes were not sufficient to change risk categories in most patients. In individuals on lipid lowering therapies, however, levels decreased more dramatically and there was a change in risk category levels, depending upon threshold used. This finding is consistent with studies that demonstrated effects of lipid lowering therapies in lowering Lp-PLA2.20,21 Though further studies are warranted to determine the precise role of these biomarkers in clinical management, the present results indicate that levels can probably be considered a stable measurement in individuals free of intercurrent events.
Our study provides evidence, moreover, that biomarker levels change in the acute phase of acute events, such as stroke and MI. Our study is unique in having biomarker levels available both before and after events in the same individuals. Of note, biomarkers changed in opposite directions. HsCRP levels increased after both stroke and MI, while both Lp-PLA2mass and activity levels decreased. The increase in hsCRP, an acute phase protein, likely represents non-specific inflammation occurring in stroke patients, and this could be due to brain injury and inflammation or to secondary infectious and inflammatory complications of stroke, such as urinary tract infections, pneumonias, and decubiti. The increase in hsCRP is consistent with findings in our prognostic study among patients with stroke, in which stroke severity was associated with elevations in hsCRP. In a previous study,6 we also found that levels of hsCRP are stable for at least one month after elevation at the time of stroke.
The decrease in Lp-PLA2 mass and activity, on the other hand, may reflect the colocalization of Lp-PLA2 with LDL. LDL levels also decrease after MI and, to a lesser extent, after stroke.22 Additional possible reasons for the decline in Lp-PLA2 include the acute phase response itself, with consequent changes in levels of hepatically-produced acute phase proteins, including albumin and fibrinogen. These proteins could affect protein-binding and activity of Lp-PLA2. The fact that Lp-PLA2 levels move in the opposite direction from hsCRP after stroke further confirms that not all inflammation-related markers behave similarly.
Changes in marker levels at the time of stroke may have implications for clinical management. Measurements made soon after stroke and MI may not be reflective of stable, pre-event levels. Use of these biomarkers in secondary prevention, therefore, likely requires use of different thresholds to determine risk than in primary prevention. Further studies, ideally multicenter, are needed to determine these thresholds.
In conclusion, Lp-PLA2 mass levels decrease slightly over time, and to a greater extent in those on lipid modifying therapy, but their use in defining major risk categories remains relatively stable. HsCRP and LpPLA2 activity appear stable over time. Acutely after stroke and myocardial infarction, however, hsCRP increases, while LpPLA2 mass and activity levels decrease modestly. These changes imply that measurements made soon after stroke and MI may not be reflective of stable, pre-event levels. Use of these biomarkers in secondary prevention likely requires use of different thresholds to determine risk than in primary prevention.
Acknowledgments
Acknowledgments and Funding
Funding for this study was provided by the National Institute of Neurological Disorders and Stroke (R37 NS29993, R01 NS48134), and funding for performance of blood assays came from Diadexus, Inc. The company did not participate in study design, collection, analysis, interpretation of data, or writing this manuscript, although they did have the opportunity to review and comment on it. Dr. Elkind receives research funding from diaDexus, Inc. The other authors have no disclosures.
References
- 1.Ross R. Atherosclerosis-an inflammatory disease. N Engl J Med. 1999;340:115–126. doi: 10.1056/NEJM199901143400207. [DOI] [PubMed] [Google Scholar]
- 2.Oei HHS, van den Meer IM, Hofman A, Koudstaal PJ, Stijnen T, Breteler MMB, Witteman JCM. Lipoprotein-phospholipase A2 activity is associated with risk of coronary heart disease and ischemic stroke: The Rotterdam Study. Circulation. 2005;111:570–575. doi: 10.1161/01.CIR.0000154553.12214.CD. [DOI] [PubMed] [Google Scholar]
- 3.Caslake MJ, Packard CJ, Suckling KE, Holmes SD, Chamberlain P, Macphee CH. Lipoprotein-associated phospholipase A2, platelet-activating factor acetylhydrolase: a potential new risk factor for coronary artery disease. Atherosclerosis. 2000;150:413–419. doi: 10.1016/s0021-9150(99)00406-2. [DOI] [PubMed] [Google Scholar]
- 4.Bogaty P, Brophy JM, Boyer L, Simard S, Joseph L, Bertrand F, Dagenais GR. Fluctuating Inflammatory Markers in Patients with Stable Ischemic Heart Disease. Arch Intern Med. 2005;165:221–226. doi: 10.1001/archinte.165.2.221. [DOI] [PubMed] [Google Scholar]
- 5.Di Napoli M, Schwaninger M, Cappeli R, Ceccarelli E, Di Gianfilippo G, Donati C, Emsley HC, Forconi S, Sander D, Sander K, Smith CJ, Stefanini A, Weber D. Evaluation of C-reactive protein measurement for assessing the risk and prognosis in ischemic stroke: a statement for health care professionals from the CRP Pooling Project members. Stroke. 2005;36:1316–29. doi: 10.1161/01.STR.0000165929.78756.ed. [DOI] [PubMed] [Google Scholar]
- 6.Elkind MSV, Tai W, Coates K, Paik MC, Sacco RL. Lipoprotein-associated phospholipase A2, C-reactive protein, and outcome after ischemic stroke. Arch Int Med. 2006;166:2073–2080. doi: 10.1001/archinte.166.19.2073. [DOI] [PubMed] [Google Scholar]
- 7.Elkind MSV, Coates K, Tai W, Paik MC, Boden-Albala B, Sacco RL. Levels of acute phase proteins remain stable after ischemic stroke. BMC Neurology. 2006;6:37. doi: 10.1186/1471-2377-6-37. [DOI] [PMC free article] [PubMed] [Google Scholar]
- 8.Sacco RL, Anand K, Lee HS, Boden-Albala B, Stabler S, Allen R, Paik MC. Homocysteine and the risk of ischemic stroke in a triethnic cohort: the NOrthern MAnhattan Study. Stroke. 2004;35:2263–9. doi: 10.1161/01.STR.0000142374.33919.92. [DOI] [PubMed] [Google Scholar]
- 9.Gentry EM, Kalsbeek WD, Hegelin G, Jones JT, Gaines KL, Forman MR, Marks JS, Trowbridge FL. The Behavioral Risk Factor Surveys: II. Design, methods, and estimates from combined state data. Am J Prev Med. 1985;1:9–14. [PubMed] [Google Scholar]
- 10.Packard CJ, O’Reilly DSJ, Caslake MJ, McMahon AD, Ford I, Cooney J, Macphee CH, Suckling KE, Krishna M, Wilkinson FE, Rumley A, Lowe GDO. Lipoprotein-associated phospholipase A2 as an independent predictor of coronary heart disease. N Engl J Med. 2000;343:1148–1155. doi: 10.1056/NEJM200010193431603. [DOI] [PubMed] [Google Scholar]
- 11.Iribarren C, Gross MD, Darbinian JA, Jacobs DR, Jr, Sidney S, Loria CM. Association of lipoprotein-associated phospholipase A2 mass and activity with calcified coronary plaque in young adults: the CARDIA study. Arterioscler Thromb Vasc Biol. 2005;25:216–21. doi: 10.1161/01.ATV.0000148322.89911.44. [DOI] [PubMed] [Google Scholar]
- 12.Elkind MSV, Tai W, Coates K, Paik MC, Sacco RL. Lipoprotein-associated phospholipase A2 activity and risk of recurrent stroke. Cerebrovasc Dis. 2009;27:42–50. doi: 10.1159/000172633. [DOI] [PMC free article] [PubMed] [Google Scholar]
- 13.Lanman RB, Wolfert RL, Fleming JK, Jaffe AS, Roberts WL, Warnick GR, McConnell JP. Lipoprotein-associated phospholipase A2: review and recommendation of a clinical cut point for adults. Prev Cardiol. 2006;9:138–143. doi: 10.1111/j.1520-037x.2006.05547.x. [DOI] [PubMed] [Google Scholar]
- 14.Corson MA, Jones PH, Davidson MH. Review of the evidence for the clinical utility of lipoprotein-associated phospholipase A2 as a cardiovascular risk marker. Amer J Cardiol. 2008;101(Suppl 12A):41F–50F. doi: 10.1016/j.amjcard.2008.04.018. [DOI] [PubMed] [Google Scholar]
- 15.Packard RR, Libby P. Inflammation in atherosclerosis: from vascular biology to biomarker discovery and risk prediction. Clin Chem. 2008;54:24–38. doi: 10.1373/clinchem.2007.097360. [DOI] [PubMed] [Google Scholar]
- 16.Elkind MSV. Inflammation, Atherosclerosis, and Stroke. The Neurologist. 2006;12(3):140–148. doi: 10.1097/01.nrl.0000215789.70804.b0. [DOI] [PubMed] [Google Scholar]
- 17.Kayaba K, Ishikawa S, Gotoh T, Nago N, Kajii E, Nakamura Y, Kario K. Five-year intra-individual variability in C-reactive protein levels in a Japanese population-based study: the Jichi Medical School Cohort Study at Yamato, 1993–1998. Jpn Circ J. 2000;64:303–8. doi: 10.1253/jcj.64.303. [DOI] [PubMed] [Google Scholar]
- 18.Alley DE, Crimmins E, Bandeen-Roche K, Guralnik J, Ferrucci L. Three-year change in inflammatory markers in elderly people and mortality: the Invecchiare in Chianti study. J Am Geriatr Soc. 2007;55:1801–7. doi: 10.1111/j.1532-5415.2007.01390.x. [DOI] [PMC free article] [PubMed] [Google Scholar]
- 19.Pearson TA, Mensah GA, Alexander RW, et al. Markers of inflammation and cardiovascular disease. Application to clinical and public health practice. A statement for healthcare professionals from the Centers for Disease Control and Prevention and the American Heart Association. Circulation. 2003;107:499–511. doi: 10.1161/01.cir.0000052939.59093.45. [DOI] [PubMed] [Google Scholar]
- 20.O’Donoghue M, Morrow DA, Sabatine MS, Murphy SA, McCabe CH, Cannon CP, Braunwald E. Lipoprotein-associated phospholipase A2 and its association with cardiovascular outcomes in patients with acute coronary syndromes in the PROVE IT-TIMI 22 (PRavastatin Or atorVastatin Evaluation and Infection Therapy-Thrombolysis In Myocardial Infarction) trial. Circulation. 2006;113:1745–52. doi: 10.1161/CIRCULATIONAHA.105.612630. [DOI] [PubMed] [Google Scholar]
- 21.Albert MA, Glynn RJ, Wolfert RL, Ridker PM. The effect of statin therapy on lipoprotein associated phospholipase A2 levels. Atherosclerosis. 2005;182:193–198. doi: 10.1016/j.atherosclerosis.2005.05.006. [DOI] [PubMed] [Google Scholar]
- 22.Kargman DE, Tuck C, Berglund L, Lin IF, Mukherjee RS, Thompson EV, Jones J, Boden-Albala B, Paik MC, Sacco RL. Lipid and lipoprotein levels remain stable in acute ischemic stroke: the Northern Manhattan Stroke Study. Atherosclerosis. 1998;139:391–9. doi: 10.1016/s0021-9150(98)00085-9. [DOI] [PubMed] [Google Scholar]


